

The average retirement age in the United States is between 61 and 62, based on recent surveys of people who have already retired. Americans who are still working generally expect to retire later, at age 65 or 66.
None of these figures represents a mandatory retirement age. Americans can stop working whenever their finances allow. Social Security retirement benefits can begin at 62, Medicare eligibility normally begins at 65, and full Social Security retirement age is 67 for people born in 1960 or later.
The difference between expected and actual retirement is important. Many workers plan to remain employed until their mid-60s, but health problems, layoffs, caregiving responsibilities and workplace changes often force them to retire several years earlier.
Key Insights
- Gallup reports an average actual retirement age of 61.
- The average retirement age expected by workers is 66.
- EBRI reports a median actual retirement age of 62.
- The median age workers expect to retire is 65.
- The labor-force-based retirement age is 64.8 for men and 63.3 for women.
- Nearly half of retirees left work earlier than they had planned.
- Social Security retirement benefits can begin at 62.
- Full retirement age is 67 for people born in 1960 or later.
- Medicare eligibility normally begins at 65.
- Life expectancy at age 65 is 19.7 additional years for the total U.S. population.
What Is the Average Retirement Age in the United States?
The answer depends on how retirement is measured.
| Measurement | Retirement Age | What It Represents |
|---|---|---|
| Gallup average for current retirees | 61 | The average age retirees say they stopped working |
| EBRI median for current retirees | 62 | The midpoint of reported retirement ages |
| Gallup expected age for workers | 66 | The average age nonretired adults expect to retire |
| EBRI expected age for workers | 65 | The median target retirement age |
| Labor-force measure for men | 64.8 | The age when male labor force participation falls below 50% |
| Labor-force measure for women | 63.3 | The age when female labor force participation falls below 50% |
The Gallup retirement findings for 2026 show that current retirees stopped working at an average age of 61. Adults who remain in the workforce expect to retire at 66.
The five-year difference is not caused only by poor planning. Retirement frequently arrives through a combination of personal choice and events that workers cannot fully control.
Why Some Sources Say 61 and Others Say 65
An average based on survey responses answers a different question from an estimate based on labor force participation.
Gallup asks retirees when they retired. The Center for Retirement Research examines the age when fewer than half of people remain in the labor force.
Someone may describe herself as retired at 61 but continue working part time. Another person may stop a long-term career at 63, take a temporary job and delay describing himself as fully retired.
Mean and median calculations can also produce different answers. A mean adds all retirement ages and divides the total by the number of respondents. A median identifies the middle retirement age after responses are arranged in order.
For a reader seeking more detailed explanation, 61 to 62 is the current actual retirement range. Ages 65 to 66 represent what workers generally expect rather than what retirees consistently experience.
Actual Retirement Age Versus Expected Retirement Age
The 2026 Retirement Confidence Survey from the Employee Benefit Research Institute places the median expected retirement age at 65. The median age reported by retirees is 62.
Three in five retirees stopped working before 65. Another 46% said retirement began earlier than they had planned.
Among people who retired early:
- 41% reported a health problem or disability.
- 36% said they could afford to stop working sooner.
- 35% pointed to workplace changes such as downsizing, closure or reorganization.
- 16% wanted to pursue something else.
- 16% needed to care for a spouse or another family member.
- 11% received an early retirement offer or employer incentive.
Respondents could report more than one reason. Overall, 76% of those who retired early identified at least one factor outside their control.
The 2026 Retirement Confidence Survey also found a difference between plans to work during retirement and the actual experience. About 74% of workers expect to earn money after retiring, but only 31% of retirees report doing so.
We recently wrote about the possible plan by Social Security to raise the retirement age to 70 years.
Average Retirement Age for Men and Women

The Center for Retirement Research calculates retirement age from the point where labor force participation drops below 50%.
| Group | Average Retirement Age |
|---|---|
| Men | 64.8 |
| Women | 63.3 |
The figures come from an analysis of the Current Population Survey covering 2025. They should not be confused with the lower self-reported retirement ages found in Gallup and EBRI surveys.
The long-term retirement age data show that the male retirement age has increased by about three years since the early 1990s. The retirement age for women has also risen as later generations spent more years in paid employment.
Women may still retire sooner because of caregiving responsibilities, health differences, employment patterns and the retirement timing of a spouse. Career interruptions can also leave women with smaller Social Security benefits and workplace retirement balances.
Why Americans Are Working Longer?
Older Americans are more likely to remain employed than they were several decades ago. In 2025, 19.1% of people age 65 and older were working or actively looking for work. The comparable rate was 12.9% in 2000.
The Bureau of Labor Statistics data on older workers show that continued employment after 65 is no longer unusual.
Several forces support longer careers:
- Full Social Security retirement age has gradually risen.
- Traditional employer pensions are less common in private-sector work.
- 401(k) plans place more responsibility on individual workers.
- Many jobs are less physically demanding than they were in previous decades.
- Remote and flexible work can make employment possible for longer.
- Healthcare and housing costs require larger retirement budgets.
- Longer lives require savings to support more years without wages.
- Some adults continue working for routine, social contact or professional interest.
Continued employment is not always voluntary. Workers may remain in their jobs because they lack savings, carry substantial debt or need employer health coverage before Medicare eligibility.
How Long Does the Average Retirement Last?
A person retiring at 62 should not build a plan that ends at 75 or 80. Retirement can last for several decades.
The latest national life expectancy figures released in 2026 show that a 65-year-old can expect to live another 19.7 years on average.
| Population at Age 65 | Average Remaining Life Expectancy |
|---|---|
| Total population | 19.7 years |
| Men | 18.4 years |
| Women | 20.8 years |
The figures are population averages, not personal forecasts. Health, income, location, smoking history, family longevity and access to medical care can produce major differences.
The National Center for Health Statistics life expectancy report indicates that many people retiring at 65 will live into their mid-80s. A substantial share will live longer.
Our wider analysis of U.S. life expectancy trends explains how longevity has changed and why national averages differ across demographic groups.
Average Retirement Age by State

No federal agency publishes a single annual table showing the official average retirement age in every state under one consistent definition.
State lists found online are usually estimates assembled from surveys, labor participation data or the age distribution of retirees. Results can differ because each publisher defines retirement differently.
Location still has a major effect on when a person can afford to stop working. Relevant state and local factors include:
- housing prices and property taxes
- state taxation of retirement income
- healthcare access
- the availability of public-sector or union pensions
- the types of jobs common in the local economy
- insurance costs before Medicare
- transportation expenses
- the ability to work remotely or part time
High living costs do not automatically produce a later retirement age. Residents of expensive states may also have higher incomes, larger home equity balances or stronger pension coverage.
Low-cost states do not guarantee that workers can retire early. Lower wages and smaller lifetime earnings can reduce both personal savings and Social Security benefits.
Social Security Retirement Ages in 2026
Retirement from work and claiming Social Security are separate decisions. A person can stop working without immediately claiming benefits. Another person can claim benefits and continue working.
| Age | Social Security Rule |
|---|---|
| 62 | Earliest age for retirement benefits |
| 65 | Medicare normally begins, but this is not full Social Security retirement age |
| 66 to 67 | Full retirement age, depending on birth year |
| 70 | Age when delayed retirement credits stop increasing the benefit |
The Social Security full retirement age is 66 years and 10 months for people born in 1959. It is 67 for people born in 1960 or later.
Full retirement age does not mean that a worker is required to retire. It identifies the point when the worker can receive 100% of the benefit calculated from the earnings record.
How Early Claiming Reduces the Monthly Benefit
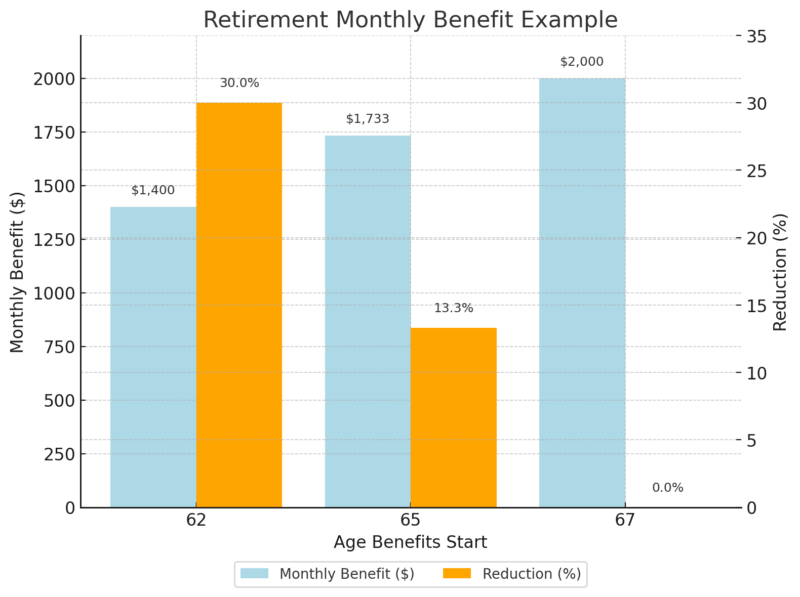
A person with a full retirement age of 67 who claims at 62 receives about 70% of the full benefit. The reduction is generally permanent.
| Claiming Age | Share of Full Benefit | Example if Full Benefit Is $2,000 |
|---|---|---|
| 62 | 70.0% | $1,400 per month |
| 65 | About 86.7% | About $1,733 per month |
| 67 | 100% | $2,000 per month |
| 70 | 124% | $2,480 per month |
The SSA early retirement reduction table shows that claiming at 62 can reduce a worker benefit by 30% when full retirement age is 67.
Waiting after full retirement age adds delayed retirement credits. Benefits rise by 8% for each full year of delay until age 70 for people born in 1943 or later.
Average and Maximum Social Security Benefits in 2026
The estimated average monthly benefit for a retired worker was $2,071 at the start of 2026.
The average Social Security retirement benefit changes during the year as new beneficiaries enter the system and existing records are adjusted.
Maximum benefit examples for a worker who earned the taxable maximum throughout a long career are much higher:
| Claiming Point in 2026 | Maximum Monthly Benefit |
|---|---|
| Age 62 | $2,969 |
| Full retirement age | $4,152 |
| Age 70 | $5,181 |
The maximum retirement benefit examples apply only to workers with maximum-taxable earnings beginning at age 22. Most retirees receive substantially less.
Social Security benefits increased by 2.8% in 2026 under the annual cost-of-living adjustment. We also follow the calculations behind each Social Security COLA projection.
Working While Receiving Social Security
Social Security permits beneficiaries to work, but an earnings test applies before full retirement age.
| Situation in 2026 | Earnings Limit | Benefit Withholding Rule |
|---|---|---|
| Under full retirement age for the entire year | $24,480 | $1 withheld for every $2 earned above the limit |
| Reaching full retirement age during 2026 | $65,160 before the qualifying month | $1 withheld for every $3 earned above the limit |
| At or above full retirement age | No limit | No benefits withheld because of earnings |
Benefits withheld under the earnings test are not simply lost. The SSA recalculates the monthly benefit after full retirement age to account for months when payments were withheld.
The official 2026 earnings test rules apply to wages and net self-employment income. Investment income and most pensions do not count toward the limit.
Medicare and Retirement at 65
Medicare normally becomes available at 65, which is one reason many Americans treat 65 as the traditional retirement age.
Someone who retires before 65 may need coverage through a spouse, former employer, private insurer, Affordable Care Act marketplace plan or another eligible program.
The standard Medicare Part B premium is $202.90 per month in 2026. Higher-income beneficiaries can pay more. The annual Part B deductible is $283.
The official Medicare costs for 2026 also show that patients using Original Medicare generally pay 20% of the approved amount for Part B services after meeting the deductible.
The initial Medicare enrollment period normally begins three months before the month a person turns 65 and ends three months afterward. People covered by an active employer plan may qualify for a special enrollment period.
Retiring at 65 does not require claiming Social Security at the same time. A worker can enroll in Medicare and delay Social Security until 67 or 70.
How Much Money Do You Need to Retire?
No reliable calculation can assign one required savings amount to every resident of a state. Housing, family size, pensions, Social Security, taxes, health and desired spending create large differences between households living in the same area.
A more useful calculation begins with the income gap:
- Estimate annual retirement spending.
- Subtract Social Security, pensions and other reliable income.
- Determine how much the investment portfolio must provide each year.
- Divide that annual gap by a planned withdrawal rate.
Retirement Savings Examples
| Annual Spending Gap | Savings at a 4% Initial Withdrawal | Savings at a 3.5% Initial Withdrawal |
|---|---|---|
| $20,000 | $500,000 | About $571,000 |
| $30,000 | $750,000 | About $857,000 |
| $40,000 | $1,000,000 | About $1.14 million |
| $50,000 | $1.25 million | About $1.43 million |
| $60,000 | $1.5 million | About $1.71 million |
The withdrawal-rate approach is a planning tool, not a guarantee. Market returns, inflation, taxes, investment fees, longevity and spending changes can alter the result.
Retiring at 60 generally requires more savings than retiring at 67. The portfolio must support more years, and the retiree may need to pay for health insurance before Medicare begins.
Do Not Build the Plan Around Average Spending
A national spending average can provide context, but personal expenses determine retirement readiness.
Review at least the following categories:
- housing and property taxes
- food and utilities
- health insurance and medical expenses
- transportation
- travel and entertainment
- support for family members
- home repairs and vehicle replacement
- income taxes
- long-term care
The 2026 EBRI survey found that 41% of retirees were spending more than they had expected when they first retired. A useful budget should therefore include room for unexpected costs rather than covering only normal monthly bills.
Retirement Contribution Limits in 2026
Workers approaching retirement can use higher federal contribution limits to add more to tax-advantaged accounts.
| Account or Contribution | 2026 Limit |
|---|---|
| 401(k), 403(b) and most governmental 457 plans | $24,500 |
| Standard catch-up for age 50 and older | $8,000 |
| Higher catch-up for ages 60 through 63 | $11,250 |
| Traditional and Roth IRA combined limit | $7,500 |
| IRA limit for age 50 and older | $8,600 |
The IRS retirement contribution limits for 2026 allow workers in their early 60s to make a larger workplace-plan catch-up contribution than other workers over 50.
Contribution eligibility, tax deductions and Roth IRA income limits depend on individual circumstances. Workers should also confirm that their employer plan permits catch-up contributions.
How to Determine Your Retirement Age?
The national average shows what other people did. It does not show when a specific household is ready.
A retirement date should pass several financial and practical tests.
1. Essential Expenses Are Covered
Calculate whether Social Security, pensions and planned portfolio withdrawals can cover housing, food, utilities, transportation, insurance and taxes.
A plan that depends on unusually strong investment returns or immediate spending cuts may not be ready.
2. Health Coverage Is Arranged
Anyone leaving work before 65 needs a clear plan for health insurance. Include premiums, deductibles, copayments, prescriptions and out-of-network expenses.
Medicare also does not eliminate medical spending. Premiums, cost sharing, dental care, vision care, hearing services and long-term care can remain significant expenses.
3. High-Interest Debt Is Controlled
Credit card balances and expensive personal loans can place heavy pressure on a fixed retirement income.
A mortgage does not automatically prevent retirement, but the payment must fit comfortably within the long-term budget.
4. The Portfolio Can Survive a Bad Start
Large market losses during the first years of retirement can damage a portfolio when withdrawals continue at the same time.
Testing the plan against lower returns, higher inflation and an early bear market provides a more realistic picture than using one optimistic projection.
5. Social Security Has Been Evaluated Separately
Stopping work does not require immediate claiming. Savings can sometimes support the first retirement years while Social Security is delayed to create a larger monthly benefit.
Claiming earlier may still be appropriate when health is poor, cash is urgently needed or a household strategy favors earlier benefits.
6. Retirement Can Begin Earlier Than Planned
The 2026 data show that almost half of retirees left work before they expected. Every plan should therefore include an earlier-retirement scenario.
Calculate what happens if wages stop two or three years before the intended date. Include the cost of insurance before Medicare and the effect of claiming Social Security sooner.
Retirement Planning by Age Group

In Your 20s and 30s
- Contribute enough to receive the full employer match.
- Increase contributions when income rises.
- Keep investment fees low.
- Build an emergency fund so retirement accounts are not used for short-term expenses.
- Review beneficiary designations after major family changes.
In Your 40s
- Estimate retirement spending for the first time.
- Review pension and Social Security estimates.
- Increase contributions when possible.
- Develop a plan for mortgages, education costs and other major debts.
- Check whether insurance coverage would protect savings after disability or death.
In Your 50s
- Use catch-up contributions.
- Compare retirement at 62, 65, 67 and 70.
- Estimate health insurance costs before Medicare.
- Review investment risk and cash needs.
- Test the plan against an earlier-than-expected job loss.
In Your 60s
- Choose a Social Security claiming strategy.
- Complete Medicare enrollment at the proper time.
- Prepare a tax-efficient withdrawal order.
- Keep sufficient accessible savings for near-term expenses.
- Review required minimum distribution rules.
- Confirm estate documents and account beneficiaries.
How the US Retirement Age Compares Internationally?

The normal pension age across OECD countries averaged 64.7 for men and 63.9 for women in the latest comparable data.
The United States moved into the age-67 group for workers born in 1960 or later. Denmark, Iceland and Norway also have normal pension ages of 67 under the OECD comparison.
The OECD public pension data project further increases in normal retirement ages as governments respond to population aging and longer periods of benefit payment.
Normal pension age does not show when people actually stop working. Early retirement programs, private pensions, disability benefits, savings and local employment conditions can produce a much lower effective retirement age.
Frequently Asked Questions
What is the average retirement age in the U.S. in 2026?
Current survey data place the actual retirement age at 61 to 62. Labor-force-based calculations produce higher figures of 64.8 for men and 63.3 for women.
At what age do most Americans expect to retire?
Workers generally expect to retire at 65 or 66. The target remains several years later than the age reported by current retirees.
Can I retire at 62?
Yes. There is no federal law requiring a person to remain employed until a particular age. Social Security retirement benefits can begin at 62, but the monthly amount will be reduced when benefits start before full retirement age.
Can I claim Social Security at 62 and continue working?
Yes. Benefits may be temporarily withheld when earnings exceed the annual limit before full retirement age.
Does working after 65 increase Social Security?
Additional earnings can increase the benefit when they replace a lower year in the 35-year earnings calculation. Delaying the claim after full retirement age also produces delayed retirement credits until 70.
Is the average retirement age different for men and women?
Yes. The labor-force-based measure is 64.8 for men and 63.3 for women. Self-reported surveys generally show retirement in the early 60s for both groups.
How long should retirement savings last?
A 65-year-old can expect almost 20 additional years of life on average. A careful plan should also account for living into the 90s.
How much money is needed to retire?
The required amount depends on annual spending, Social Security, pensions, taxes, healthcare costs and expected retirement length. A person needing $40,000 a year from investments would need about $1 million under a 4% initial withdrawal calculation.
Should I claim Social Security as soon as I retire?
Not necessarily. Retirement and Social Security claiming can occur at different times. Delaying can produce a larger monthly benefit, but health, income needs and household circumstances must be considered.
Can I enroll in Medicare without claiming Social Security?
Yes. Medicare enrollment and Social Security retirement benefits are separate. Someone delaying Social Security should still complete Medicare enrollment when required.
Is retirement income taxable?
Withdrawals from traditional retirement accounts are generally taxable. Part of Social Security may also become taxable depending on combined income. State rules vary.
Methodology
The average retirement figures in this article use three separate measurements:
- Gallup’s 2026 survey provides the mean actual and expected retirement ages.
- The 2026 EBRI and Greenwald Research survey provides median retirement ages and reasons for retiring early.
- The Center for Retirement Research uses Current Population Survey data to estimate the age when labor force participation falls below 50%.
Social Security figures come from the Social Security Administration. Medicare premiums and deductibles come from Medicare. Contribution limits come from the Internal Revenue Service.
Life expectancy figures use the latest National Center for Health Statistics data available in 2026. State retirement ages were not presented as an official table because federal agencies do not publish a directly comparable annual figure for every state.
Final Thoughts

The average American retires at 61 or 62, several years earlier than workers expect. That gap should shape retirement planning more than the traditional image of leaving work at 65.
A strong plan should work at the preferred retirement age and remain viable if employment ends sooner. Health problems, workplace changes and family responsibilities do not always wait for savings to reach a perfect number.
Age 62 opens access to reduced Social Security benefits. Medicare generally begins at 65. Full Social Security retirement age reaches 67 for younger workers, and delaying benefits until 70 can produce a larger monthly payment.
The best retirement age is therefore not the national average. It is the point when essential expenses, health coverage, debt, savings and reliable income can support a long period without a regular paycheck.