
With a projected population of 923,164 in 2025, Charlotte is witnessing a substantial rise, reflecting its growing appeal and economic significance.
As part of the Charlotte metro area, which now numbers approximately 2,321,000 inhabitants, the city plays a vital role in the region’s development.
The expanding population indicates vibrant growth and opportunities in various sectors, underscoring Charlotte’s dynamic position in the southeastern United States.
Amidst this rapid expansion, Charlotte stands out as an attractive destination for those seeking a blend of urban living and economic prospects.
Key Takeaways
Total Population

As of 2025 , Charlotte’s population stands at approximately 923,164, reflecting consistent growth according to World Population Review.
This increase highlights Charlotte’s appeal as a dynamic urban center attracting people from various regions.
The city’s residents enjoy an average household income of $113,613, indicating a prosperous and thriving community.
Charlotte encompasses parts of Cabarrus, Mecklenburg, and Union counties, solidifying its importance as a regional hub in North Carolina.
Population Growth Rate
CLT Alliance notes that Charlotte’s population is growing at a rate of about 1.3% annually. This growth signifies a healthy, expanding city that draws attention to both residential and business opportunities.
The city has experienced an increase of 5.41% in population since the 2013 census. Such growth is indicative of the positive economic and social dynamics that Charlotte offers, making it one of the fastest-growing urban areas in the United States.
Charlotte’s rapid population growth parallels trends seen in cities like Nashville, which has also experienced consistent increases in residents. Both cities are grappling with challenges related to infrastructure, housing, and job vacancies as they expand.
Age Distribution
Category
Value
Charlotte Median Age
Total
34.5 years
Male
33.6 years
Female
35.3 years
Charlotte Adults
674,827
Seniors
93,488
Charlotte Age Dependency
Age Dependency Ratio
50.5
Old Age Dependency Ratio
16.1
Child Dependency Ratio
34.4
Charlotte Sex Ratio
Female Population
450,872 (51.53%)
Male Population
424,173 (48.47%)
Median Age: The median age of Charlotte residents is 34.5 years. This figure is further broken down by gender, with males having a slightly younger median age (33.6 years) compared to females (35.3 years).
Charlotte Adults: The total adult population in Charlotte is 674,827. This group includes 93,488 senior citizens (those generally aged 65 and older).
Age Dependency Ratios: These figures give insight into the proportion of the population that is dependent (either elderly or children) compared to those of working age.
- The Age Dependency Ratio of 50.5 indicates that for every 100 working-age adults, there are about 50.5 dependents (children or elderly).
- The Old Age Dependency Ratio of 16.1 reflects the number of elderly dependents (65+) per 100 working-age adults.
- The Child Dependency Ratio of 34.4 represents the number of dependents aged under 18 per 100 working-age adults.
Sex Ratio: The data also provides a breakdown of Charlotte’s population by gender. Females make up 51.53% (450,872) of the population, while males account for 48.47% (424,173).
Best Neighborhoods To Live
Income Levels

Charlotte’s average household income exhibits a significant range. Recent data indicates an average household income of approximately $113,613, reflecting a noticeable increase over previous years. This rise in income levels can be attributed to the city’s expanding job market and economic development.
The disparity between different income groups is evident, yet the median household income stands at a solid $74,070, suggesting a healthy middle-class base according to datausa. Additionally, this upward trend highlights Charlotte’s growing appeal as a residential and business hub.
Poverty Level
Employment Statistics
View this post on Instagram
Employment opportunities in Charlotte are diverse, contributing to a robust labor market. The city is known for its thriving sectors such as finance, technology, and healthcare, providing numerous job prospects. According to the U.S. Bureau of Labor Statistics, average weekly wages in the area slightly trail the national average but indicate strong economic potential.
The unemployment rate remains relatively low compared to national figures, underscoring the resilience of Charlotte’s economy. The increasing influx of companies setting up operations in the city further boosts employment opportunities.
Charlotte’s employment landscape in 2024 is characterized by robust growth across key sectors, with the city’s economy outpacing both state and national averages. As of mid-2024, Charlotte’s unemployment rate stands at approximately 3.8%, slightly lower than the national rate of 4.2% as per the Bureau of Labor Statistics.
Employment growth in the region has been strong, with notable expansion in industries such as Leisure & Hospitality and Construction, which together added thousands of new jobs.
In terms of average weekly wages, Charlotte’s workers earn around $1,387, slightly below the national average of $1,435
However, wages in specific sectors, such as Finance, Business Operations, and Healthcare, are notably competitive. For instance, professionals in management earn an average hourly wage of $68.61, and those in computer and mathematical occupations make $55.78
Charlotte’s employment growth rate continues to surpass national trends, with the region experiencing a 4.6% increase in jobs year-over-year compared to the national growth of 2.9% as per CLT Alliance.
This reflects a thriving labor market, driven by an influx of companies, particularly in the financial services, technology, and manufacturing sectors.
Education Levels
Educational Level
Percentage of Population
High School Graduate or Higher
90.6%
Bachelor’s Degree or Higher
48.8%
Post-Graduate Degree
17.0%
Comparison of Charlotte’s Educational Attainment with Regional and State Averages
Educational Level
Charlotte
Charlotte-Concord-Gastonia Metro Area
North Carolina
High School Graduate or Higher
90.6%
91.5%
90.2%
Bachelor’s Degree or Higher
48.8%
40.7%
35.9%
Post-Graduate Degree
17.0%
14.0%
13.0%
Population by Highest Level of Education
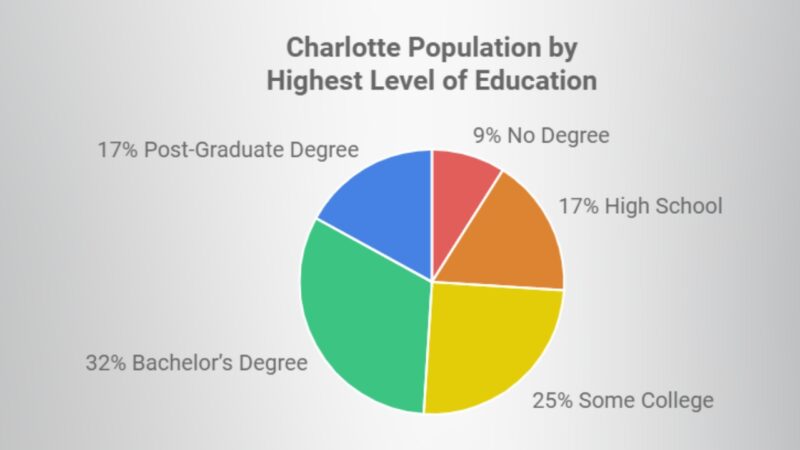
Charlotte demonstrates a highly educated population, with 90.6% of its residents aged 25 and over having attained at least a high school diploma. This rate is almost identical to both the Charlotte-Concord-Gastonia Metro Area average (91.5%) and North Carolina’s average (90.2%).
Censusreporter says that Charlotte stands out, with 48.8% of its population holding a Bachelor’s degree or higher, a figure that is approximately 20% higher than the regional metro area rate of 40.7%, and about 1.4 times higher than the state rate of 35.9%.
Similarly, 17% of residents have a Post-Graduate degree, which is significantly higher than both the Metro Area’s (14%) and North Carolina’s (13%) averages.
These figures suggest that Charlotte is a city with a highly educated workforce, particularly when compared to the surrounding region and the state as a whole. The city’s high percentage of residents with post-secondary degrees may be a contributing factor to its growing economy and appeal to businesses, particularly in sectors requiring specialized skills and knowledge.
Race & Ethnic Diversity of Charlotte Residents
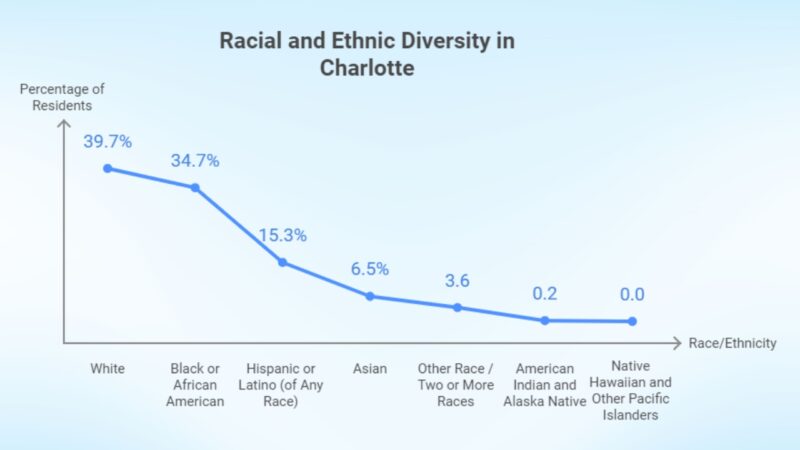
Charlotte is a highly diverse city, with its population consisting of a mixture of racial and ethnic groups. White residents makeup 39.7% of the population, followed closely by Black or African American individuals at 34.7%.
Hispanic or Latino residents, comprising 15.3%, reflect the growing influence of this community. Smaller but significant groups include Asian residents (6.5%) and individuals identifying as Other Race or Two or More Races (3.6%) as per World Population Review.
Ancestry of Charlotte Residents
Ancestry
Percentage of Residents
German
7.7%
English
7.4%
Irish
6.8%
Italian
3.4%
Scots-Irish
1.7%
The ancestry of Charlotte’s residents showcases European influences, with the largest groups being German (7.7%), English (7.4%), and Irish (6.8%) descent. Smaller portions of the population identify with Italian and Scots-Irish ancestry, reflecting historical migration trends into the region.
Languages Spoken by Charlotte Residents
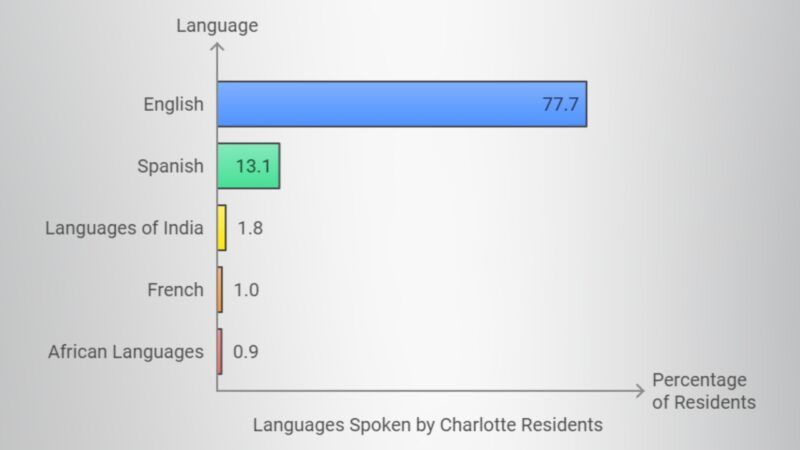
While English is the primary language spoken by 77.7% of the population, Spanish is the most widely spoken foreign language, representing 13.1% of residents. Other languages, including those from India, French, and various African languages, also reflect the city’s multicultural makeup as per Neighborhoodscout.
Foreign-Born Charlotte Residents
Category
Percentage of Residents
Foreign Born
17.4%
Approximately 17.4% of Charlotte’s residents are foreign-born, illustrating the city’s growing status as a destination for immigrants from around the world. This diverse group contributes to the cultural richness and dynamism of the city’s economy and social fabric.
Charlotte’s Housing Market in 2024
Charlotte, North Carolina continues to experience robust growth, reflected in its housing and economic indicators. The median home price in Charlotte as of mid-2024 stands at $450,000 for listings, with homes selling for a slightly lower median price of $417,500.
This represents a stable year-over-year performance in the market. On average, homes in Charlotte are selling in 33 days, with most properties selling close to their asking price, suggesting a balanced market despite slight fluctuations according to Realtor.
Rental Market Trends

RealWealth says that the rental market in Charlotte has been on an upward trajectory over the last decade, with 53% growth in rental prices. Median rent peaked at nearly $2,000 per month but has recently cooled to around $1,839 due to an increase in available apartments.
The sustained rent growth, which outpaced the national average by 28%, highlights the high demand for housing, driven largely by rapid population growth.
Household Income and Economic Disparities
Income distribution in Charlotte reflects a substantial disparity. The median household income is approximately $77,125, with family households earning a median income of $93,815 and non-family households around $56,322.
However, there is a stark gap between income brackets: the lowest 20% of earners make on average $18,211, while the top 20% average $315,956, and the top 5% exceed $607,000. This income inequality is represented by a Gini coefficient of 0.507, indicating moderate inequality referring to the Neilsberg article.
Migration Trends

An average of 117 people are moving to Charlotte daily, illustrating the region’s increasing appeal. The city’s economic opportunities, mild climate, and cultural amenities contribute to its attractiveness to new residents.
Most of this influx is domestic, with people relocating from cities like New York and Los Angeles seeking a lower cost of living and better quality of life. While the number of newcomers is substantial, outbound flows are relatively low, indicating a net gain in population.
The city has become a magnet for international migrants who enrich the region’s cultural diversity. This has led to the establishment of vibrant communities and multicultural events which boost local tourism and business.
Immigrants contribute to the economy through entrepreneurship and labor force participation, filling vital roles in healthcare, technology, and service sectors.
However, these trends also highlight the need for infrastructure development and housing solutions to accommodate the growing population. Public services must adapt to provide educational and language support for immigrant families, ensuring successful integration and community cohesion.
Health and Well-being
Charlotte offers a robust healthcare system anchored by prominent providers such as Atrium Health and Novant Health, ensuring a wide range of services from general care to specialized treatments.
Despite the presence of over 200 pharmacies and several medical facilities, disparities in healthcare access persist. Low-income areas, particularly in the northern, eastern, and western parts of the city, often face challenges in accessing affordable healthcare and pharmacy services according to Urban Institute.
About 18% of households in Mecklenburg County are within a half-mile of Medicaid providers or free clinics, leaving many residents, especially in underprivileged areas, reliant on community health initiatives and mobile clinics.
The latest data from 2020 shows that 15% or 105,000 residents in Mecklenburg County don’t have access to health insurance. https://t.co/9TEL0KfQR6
— WSOCTV (@wsoctv) May 31, 2024
Public health programs and Medicaid expansion aim to improve accessibility, especially for the 15% of residents in Mecklenburg County who depend on public insurance.
These initiatives are crucial for closing healthcare gaps and addressing chronic health issues among underserved populations.
Life Expectancy
CDC notes that life expectancy in Charlotte mirrors that of the broader Mecklenburg County, averaging 79.6 years, which is slightly higher than the North Carolina state average of 76.1 years.
However, significant disparities exist based on socioeconomic status and geography. Residents in wealthier neighborhoods in the southeastern part of the city enjoy life expectancies of 80 years or more, while in lower-income areas, particularly in the north and west, the average life expectancy drops to the 60s, highlighting the impact of social determinants on health.
Cultural Impact
Charlotte is home to various notable cultural institutions that play a crucial role in the city’s artistic community.
The Mint Museum, renowned for its comprehensive art collections, offers residents and visitors alike an opportunity to explore diverse art forms.
The Bechtler Museum of Modern Art showcases contemporary artistic works and frequently updates its exhibits to ensure a dynamic viewing experience.
Additionally, the Levine Museum of the New South provides an in-depth exploration of Southern history and culture.
These institutions not only preserve art and history but also actively engage the community through educational programs and curated exhibitions.
Cultural Events and Festivals
View this post on Instagram
Charlotte hosts numerous cultural events and festivals that reflect the city’s diversity and vibrant spirit.
The annual Charlotte Jazz Festival brings together renowned musicians and enthusiasts for performances across the city.
The Latin American Festival celebrates Hispanic heritage with captivating music, dance, and cuisine.
Meanwhile, the Carolina Renaissance Festival, held just outside the city, transports attendees to a bygone era with its lively reenactments and entertainment.
Events like these not only entertain but also foster community spirit and cultural appreciation.
Methodology
We begin by collecting accurate and relevant data from trusted sources such as the U.S. Census Bureau, World Population Review, and the Bureau of Labor Statistics. Once gathered, the data is organized into key sections such as population growth, education levels, employment, and diversity.
This structure ensures the post is clear and easy to follow. To add context, we compare Charlotte’s data with regional, state, and national statistics, highlighting trends that make the city stand out. We also ensure the accuracy of the data by cross-referencing multiple reputable sources.
Finally, qualitative insights, such as neighborhood reviews and cultural highlights, are included to provide a more well-rounded understanding. The post is periodically updated to reflect the latest statistics.