In 2025, El Paso population is 678,859 people, reflecting its importance as a major urban center in Texas.
Table of Contents
ToggleBut some government sources say it has around 885.00 people.
The El Paso metropolitan area is estimated to have a population of 996,000, representing a steady growth compared to previous years according to Macrotrends.
This growth indicates an ongoing trend of development and diversification that enhances the city’s economic and social fabric. It is also the 22nd largest city in the United States and the 6th largest in Texas.
The projected growth of the county to 888,721 reflects positive trends in urban development.
These figures illustrate how El Paso continues to evolve, maintaining a balance between preserving its rich heritage and embracing modern growth opportunities.
Key Takeaways
- El Paso’s 2025 population is 678,859, with a metro area of 996,000, showing steady growth.
- The city’s population is 79.7% Hispanic, with a median age of 35, reflecting a youthful demographic.
- Median household income is $50,000, lower than the national average, with notable income disparities.
- Major employment sectors include military, healthcare, education, and trade, with a 4.6% unemployment rate.
- Urban development, healthcare, and education improvements are key drivers of growth, focusing on affordability and access.
Total Population
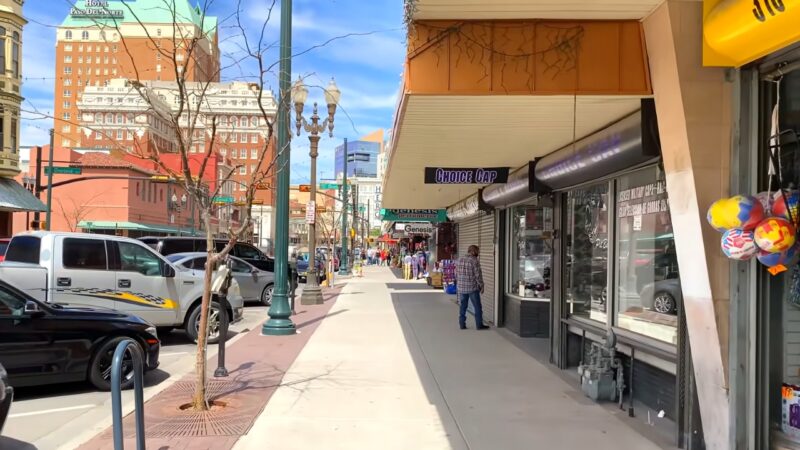
El Paso, Texas, currently has a population of approximately 678,859 as of 2025 according to World Population Review.
This makes it the sixth-largest city in Texas and the 22nd-largest in the United States.
Despite being a major city, its growth has experienced a slight decline, with a reduction rate of -0.01% annually.
As a border city, El Paso maintains a considerable Hispanic or Latino population, a factor contributing significantly to its demographic makeup.
Population Growth Rate
Neilsberg says that In 2023, the city’s population saw a minor increase of 0.17% from the previous year. Over the years, the growth patterns have fluctuated, reflecting broader economic and social trends.
While it increased by over 111,000 individuals between 2000 and 2023, the latest figures show a slight decline. This trend indicates an evolving demographic environment impacted by various factors including migration and economic conditions.
Age Distribution
El Paso’s population is predominantly young, with the median age being 35 years. The city is known for its family-friendly environment, attracting many young families.
This youthful demographic contributes to the city’s vibrant culture and economic opportunities. With a significant percentage of the population under 18, the city has a dynamic education sector and various services catering to the needs of young residents.
El Paso Adults
This section provides data on the adult population in El Paso.
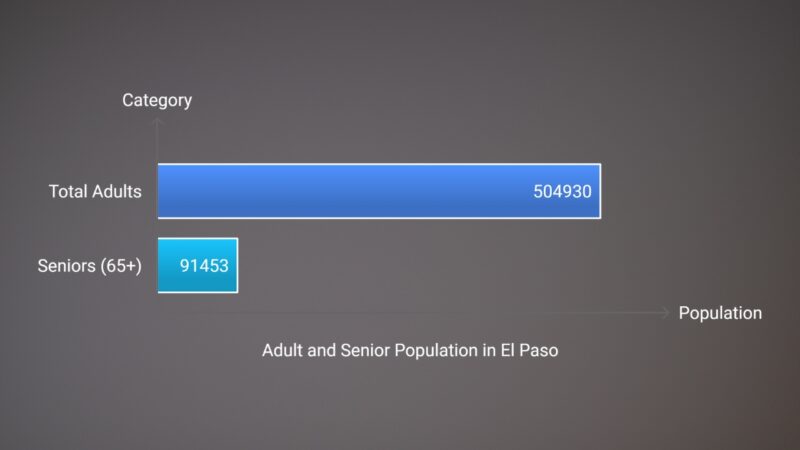
There are 504,930 adults in El Paso, including 91,453 seniors aged 65 and above.
El Paso Age Dependency Ratios
The age dependency ratio is a measure of the number of dependents (people younger than 15 or older than 64) compared to the working-age population.
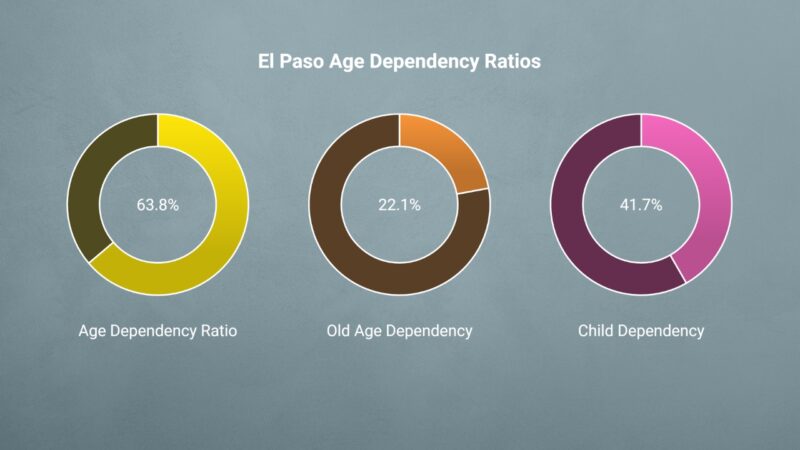
The age dependency ratio in El Paso is 63.8%, with an old age dependency of 22.1% and a child dependency of 41.7%. This means there are 63.8 dependents for every 100 working-age individuals, reflecting the burden on the working population.
Race and Ethnicity
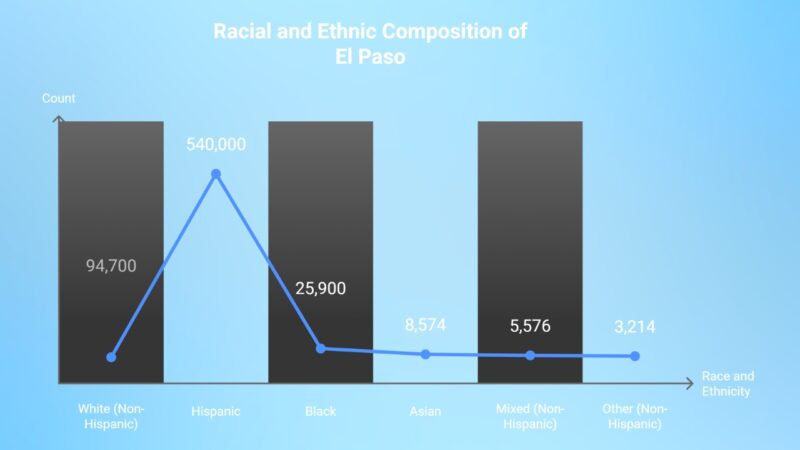
The majority of the population in El Paso identifies as Hispanic (79.7%), which is significantly higher compared to other racial and ethnic groups.
Statisticsatlas notes that The next largest group is White (Non-Hispanic) at 14.0%, followed by Black (3.8%), Asian (1.3%), Mixed (0.8%), and Other (0.5%).
Race and Ethnicity in El Paso Compared to Texas
| Race and Ethnicity | Percentage in El Paso (%) | Percentage in Texas (%) | Percentage Point Difference (El Paso – Texas) |
|---|---|---|---|
| White (Non-Hispanic) | 14.0 | 43.5 | -29.5 |
| Hispanic | 79.7 | 38.3 | +41.4 |
| Black | 3.8 | 11.9 | -8.1 |
| Asian | 1.3 | 4.4 | -3.1 |
| Mixed (Non-Hispanic) | 0.8 | 1.5 | -0.7 |
| Other (Non-Hispanic) | 0.5 | 0.4 | +0.0 |
- Hispanic Representation: El Paso has a much higher percentage of Hispanic residents (79.7%) compared to the state average (38.3%). The difference is +41.4 percentage points.
- White Representation: The percentage of White (non-Hispanic) residents in El Paso (14.0%) is much lower compared to Texas as a whole (43.5%), with a difference of -29.5 percentage points.
- Black and Asian Representation: Both Black and Asian groups are also underrepresented in El Paso compared to Texas, with differences of -8.1 and -3.1 percentage points, respectively.
- Mixed and Other: The Mixed and Other categories show smaller differences, with the Mixed group being underrepresented by -0.7 percentage points and the Other group being similar to the state average.
Median Household Income in El Paso

The median household income is an important marker for the economic standing of El Paso residents.
According to data from the U.S. Census Bureau (2022 estimates), the median household income in El Paso is approximately $50,000, which is below the national median of around $74,580. This lower median income reflects the more affordable cost of living in the city but also highlights some economic disparities.
- Income Distribution: There is significant income disparity across different neighborhoods. For instance, more affluent areas such as the West Side of El Paso have a median income nearing $70,000, while some neighborhoods in central and east El Paso have median incomes closer to $30,000. Income inequality is closely related to educational attainment and access to resources.
- Poverty Levels: According to U.S. Census Bureau data, approximately 20.4% of El Paso residents live below the poverty line, which is significantly higher than the national average of 11.5%. This reflects ongoing challenges in economic opportunities and highlights areas in need of economic development and investment.
Employment Rate
The employment rate in El Paso is a critical measure of its economic health. According to the U.S. Bureau of Labor Statistics (BLS) as of mid-2024, the unemployment rate in El Paso is around 4.6%, which is comparable to the national rate of 4.2%. The employment rate reflects El Paso’s diversified economic base and its reliance on several key sectors.
- Government and Military: Fort Bliss, one of the largest U.S. Army bases, plays a substantial role in employment, directly supporting more than 40,000 military personnel and civilians. This has a cascading impact on local businesses and services that support military families.
- Education and Healthcare: El Paso’s education and healthcare sectors are also significant employers. University Medical Center of El Paso and Texas Tech University Health Sciences Center employ thousands of healthcare workers. Additionally, El Paso Independent School District (EPISD) is a major employer, providing jobs for over 6,000 individuals.
- Trade and Transportation: The city’s border location facilitates a vibrant trade and logistics sector. The border economy, influenced heavily by the North American Free Trade Agreement (NAFTA) (now USMCA), supports many jobs in trucking, warehousing, and international trade.
Education Levels in El Paso
The information below helps illustrate El Paso’s educational landscape, focusing on the city’s main higher education institutions and their contributions to the workforce according to DATAUSA.
1. Degrees Awarded in El Paso (2022)
In 2022, universities in El Paso awarded a total of 12,147 degrees.
The table below provides a breakdown of the largest universities in El Paso.
| University Name | Degrees Awarded | Percentage of Total Degrees (%) |
|---|---|---|
| The University of Texas at El Paso (UTEP) | 5,377 | 44.3 |
| El Paso Community College | 4,045 | 33.3 |
| Western Technical College | 888 | 7.31 |
| Others | 1,837 | 15.2 |
| Total | 12,147 | 100 |
- The University of Texas at El Paso (UTEP) was the largest degree-granting institution, awarding 44.3% of all degrees in El Paso.
- El Paso Community College followed closely, contributing over 33.3% of the total degrees.
- Western Technical College awarded 7.31% of the total degrees, highlighting its role in vocational education.
2. Student Population and Demographics (2022)
In 2022, the student population in El Paso was notably skewed towards female students, with 30,421 females and 23,478 males.
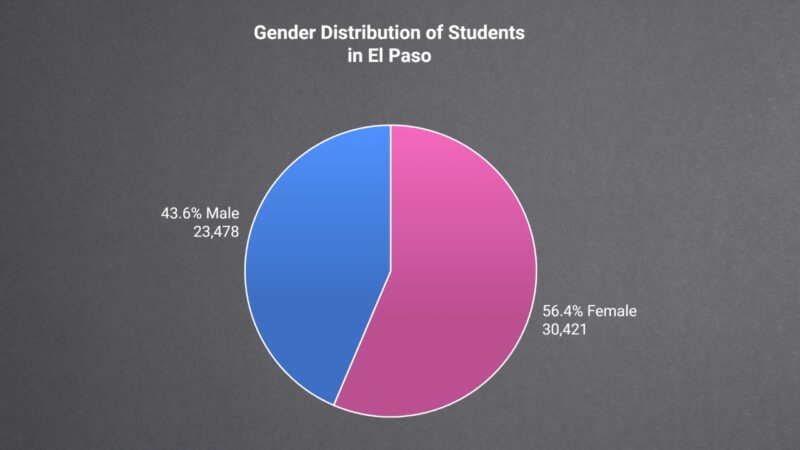
- The student population is 56.4% female and 43.6% male. This gender disparity reflects broader trends in higher education where female enrollment often exceeds male enrollment.
3. Enrollment by Race and Ethnicity (2022)
A significant proportion of the student population in El Paso is Hispanic or Latino, reflecting the city’s demographic makeup.
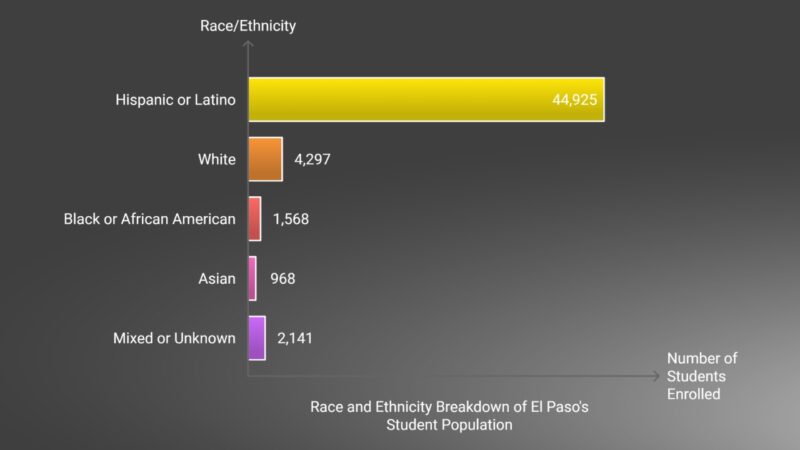
- Hispanic or Latino students make up 83.3% of the enrolled student population, highlighting the significant Hispanic presence in El Paso’s education sector.
- White students represent the second-largest group, making up 8.0% of total enrollments.
- Other racial and ethnic groups, including Black or African American and Asian, have smaller representation within the student body.
4. Graduation Demographics
The majority of students graduating from universities in El Paso in 2022 were Hispanic or Latino, accounting for 83.7% of all graduates.
| Race/Ethnicity | Number of Graduates | Percentage of Total Graduates (%) |
|---|---|---|
| Hispanic or Latino | 9,840 | 83.7 |
| White | 1,034 | 8.8 |
| Black or African American | 325 | 2.77 |
| Unknown/Other | 187 | 1.59 |
| Total | 11,754 | 100 |
- The overwhelming majority of graduates were Hispanic or Latino, illustrating both the educational attainment and representation of the Hispanic population in the higher education system of El Paso.
- White students made up 8.8% of graduates, while Black or African American and Unknown students made up smaller portions.
5. Popular Majors in El Paso (2022)
The most awarded degrees by major reveal trends in the fields of study that are popular among students in El Paso.
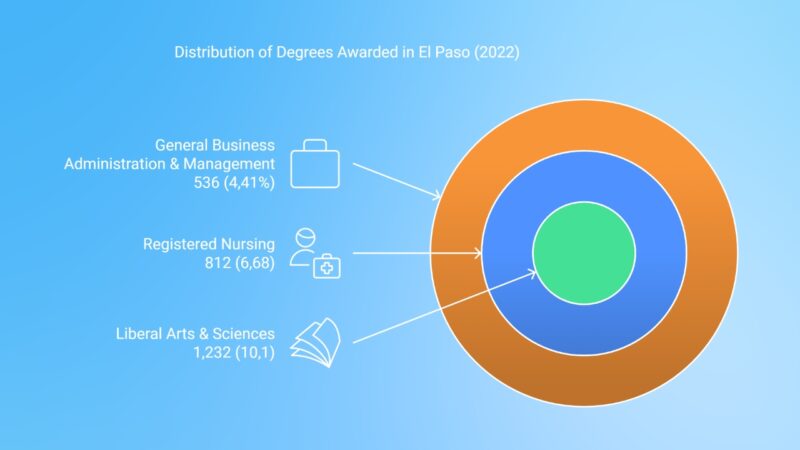
- Liberal Arts & Sciences is the most popular major, accounting for 10.1% of all degrees awarded.
- Registered Nursing is also highly popular, indicating a strong focus on healthcare professions.
- Business Administration ranks third, reflecting the demand for graduates with general business skills.
6. Admissions and Enrollment Statistics (2022)
In 2022, El Paso universities had a 99.9% acceptance rate, with an enrollment rate of 35.9% of those accepted. The total student enrollment for the year was 53,899.
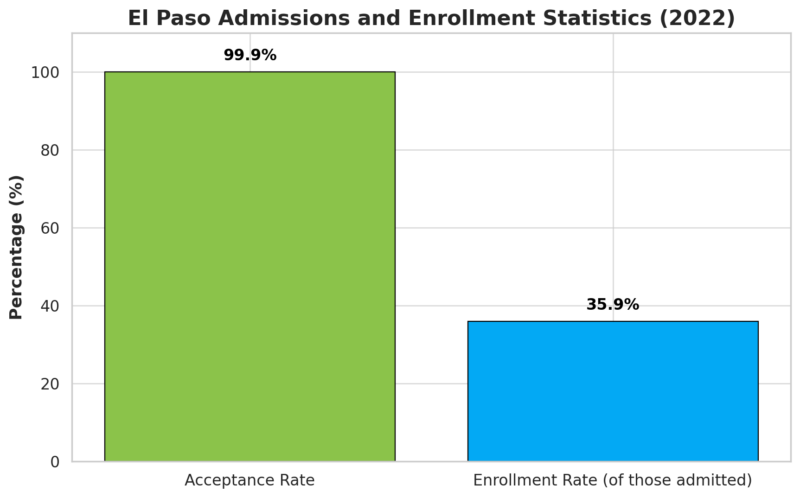
- Nearly every applicant to El Paso universities was accepted (99.9% acceptance rate). However, only 35.9% of admitted students chose to enroll, which might indicate competition from other educational opportunities or personal factors affecting decision-making.
- The high acceptance rate shows a strategy focused on inclusivity and access to higher education.
7. Tuition Costs
The median tuition cost for a four-year public college in El Paso is:
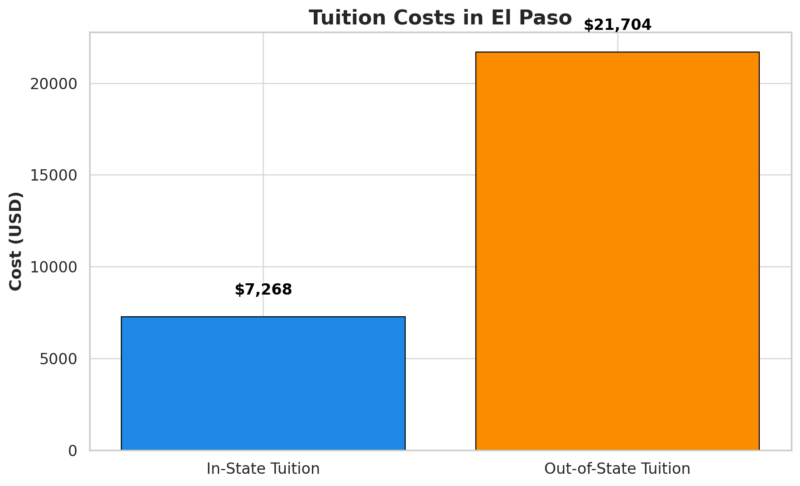
- Tuition for in-state students is relatively affordable at $7,268, supporting local residents seeking higher education.
- Out-of-state tuition, at $21,704, is considerably higher, which aligns with national trends of higher charges for non-resident students.
Population Projections
- According to the Texas Demographic Center, the population of El Paso is projected to reach approximately 900,000 by 2030. This reflects an average growth rate of 1% to 1.5% annually, depending on economic conditions and migration patterns.
Key Projection Figures
- 2024: 890,000
- 2030: 900,000 – 910,000
- 2040: 1,000,000
Housing and Urban Development in El Paso
El Paso’s housing market is experiencing a gradual shift due to government initiatives aimed at making housing more accessible while also managing urban sprawl. The median home price and rental rates in El Paso are key indicators of affordability, and recent policies are tailored to address these dynamics effectively.
Median Home Price

According to recent data from Zillow (2024), the median home value in El Paso is around $223,427. This is still lower than the national median, which is approximately $420,000, but prices in El Paso have been increasing steadily. The rise can be attributed to increased demand driven by population growth, limited supply, and heightened construction costs.
Neighborhoods like West El Paso and areas near the Upper Valley tend to have higher median home prices, often exceeding $250,000 to $300,000, whereas more central and eastern neighborhoods generally maintain lower median values, closer to $180,000.
El Paso vs. Other Texas Cities
When comparing El Paso’s housing costs to other major Texas cities, El Paso remains more affordable across key metrics such as median home price and average rent.
- El Paso: $223,427
- San Antonio: $299,000
- Austin: $500,000
- Dallas: $338,500
Affordability Challenges
Affordability is becoming an issue for low-to-middle-income families, especially given that wage growth has not kept pace with rising housing costs. The city government has initiated programs to incentivize builders to develop affordable housing units. Tax incentives and reduced permit costs are some of the measures being used to encourage such developments.
Homeownership Programs
We’ll see you soon! 🤠 Today at 10:30 am, our homeownership team will be going live on Facebook to answer your questions about down payment assistance and Mortgage Credit Certificates.
We can’t wait to see you there! https://t.co/CVqjxo500f
— TSAHC (@TSAHC) July 19, 2023
The city collaborates with non-profits and state programs to help first-time homebuyers through down payment assistance and low-interest mortgage loans. Programs like Texas State Affordable Housing Corporation (TSAHC) offer financial assistance to eligible residents.
Rental Market in El Paso
Rental Rates
The average rent for an apartment in El Paso has risen to approximately $1076.per month in 2024, according to RentCafe. This reflects a steady increase from previous years, influenced by both local population growth and rising demand for rental properties.
- One-Bedroom Apartments: Average rent for a one-bedroom apartment is about $900, while two-bedroom units typically rent for around $1,200. Rental costs in neighborhoods like Westside and East El Paso are generally higher, averaging closer to $1,300 – $1,400 for two-bedroom units, due to their desirable locations and proximity to amenities.
Affordable Rental Programs
To tackle rental affordability issues, the City of El Paso has been pushing initiatives like the Affordable Housing Rental Program, which provides subsidies for low-income families. These programs are aimed at keeping housing costs below 30% of a household’s monthly income, which is the threshold for housing affordability according to HUD guidelines.
Urban Development Strategies
El Paso’s government is actively implementing urban development policies to manage growth, improve livability, and reduce urban sprawl. Key initiatives include the development of mixed-use zones and improvements to public transportation.
Mixed-Use Zones: Mixed-use developments that combine residential, commercial, and recreational spaces are being promoted to ensure efficient land use. These developments are particularly concentrated in areas like Downtown El Paso, where they encourage higher-density living and reduce commuting times.
- The City Plan Commission has recently approved several mixed-use projects in Central and East El Paso to support growth while minimizing the urban footprint.
Public Transport Improvements: To reduce reliance on cars and improve connectivity, El Paso is investing in its public transit infrastructure. The Sun Metro bus system has seen recent expansions to include more routes connecting suburban areas with the city center, and a new bus rapid transit (BRT) line is being planned to streamline transit times for major corridors.
- The government has also been working on expanding pedestrian-friendly pathways and adding bike lanes, particularly in newly developing neighborhoods, to foster more sustainable urban mobility.
Health and Educational Services Expansion

- Healthcare Access: To improve healthcare accessibility, the city has invested in community health centers, especially in underserved areas such as Far East El Paso. These clinics provide affordable healthcare services, including primary care, mental health services, and specialized treatments.
- Telehealth Services: El Paso is also expanding telehealth initiatives to serve remote communities better. These services became particularly critical during the COVID-19 pandemic and have been retained as a permanent fixture to improve healthcare access.
Expansion of University Medical Center
The University Medical Center of El Paso (UMC) has expanded its facilities, adding more beds and new specialized care units to reduce patient wait times. UMC also partners with Texas Tech University Health Sciences Center to provide training opportunities for medical students and interns, ensuring a pipeline of healthcare professionals.
Educational Developments
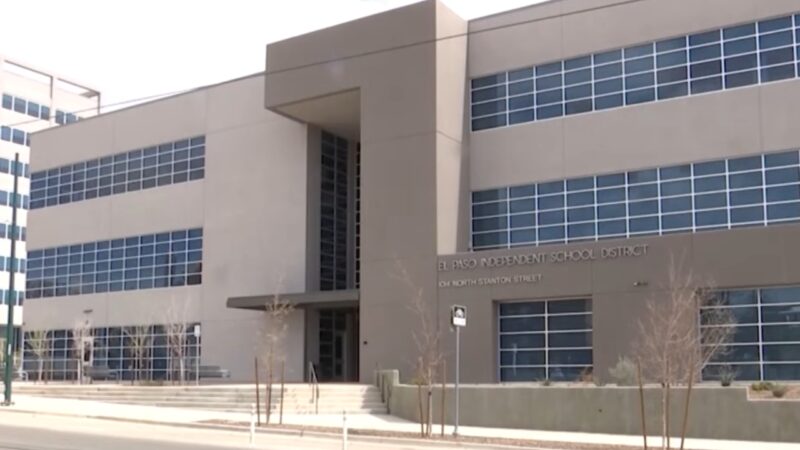
- Modernizing School Infrastructure: El Paso Independent School District (EPISD) has received funding to modernize schools, focusing on upgrading technological resources, improving classroom environments, and expanding facilities. As of 2024, investments totaling $668 million have been allocated for school renovations and new construction projects under a bond approved by voters in 2016.
- Vocational Training Programs: The city is also placing emphasis on vocational training through partnerships with El Paso Community College (EPCC). These programs aim to prepare students for high-demand jobs in fields such as healthcare, IT, and construction, thus aligning workforce skills with economic needs. The goal is to reduce the mismatch between available jobs and skilled workers in the area.
El Paso Crime Rate
Crime Data vs. United States
| Crime Type | El Paso Total (Population: 677,456) | El Paso Rate per 1,000 | U.S. Total (Population: 333,287,557) | U.S. Rate per 1,000 |
|---|---|---|---|---|
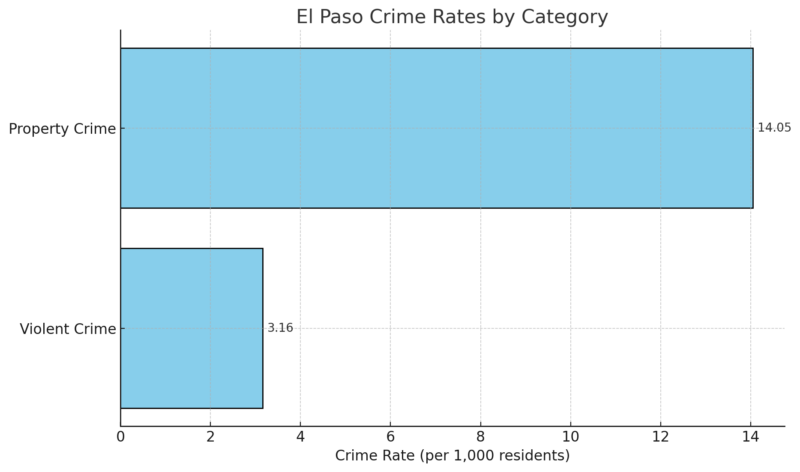
| Violent Crimes | 2,143 | 3.16 | 1,268,880 | 3.81 |
| Murder | 22 | 0.03 | 21,156 | 0.06 |
| Rape | 297 | 0.44 | 133,294 | 0.40 |
| Robbery | 269 | 0.40 | 220,450 | 0.66 |
| Assault | 1,555 | 2.30 | 893,980 | 2.68 |
| Property Crimes | 9,520 | 14.05 | 6,513,829 | 19.55 |
| Burglary | 984 | 1.45 | 899,293 | 2.70 |
| Theft | 7,122 | 10.51 | 4,672,363 | 14.02 |
| Motor Vehicle Theft | 1,414 | 2.09 | 942,173 | 2.83 |
El Paso Crime Rates and Neighborhood
| Crime Category | Chances of Victimization in El Paso | Chances of Victimization in Texas | |
|---|---|---|---|
| Violent Crime | 1 in 316 | 1 in 232 | |
| Property Crime | 1 in 71 | 1 in 43 |
Popular Neighborhoods
| Neighborhood | Crime Rate | Analysis |
|---|---|---|
| High Ridge | Low | Typically safer, residential areas. |
| Bear Ridge | Low | Safe, well-developed community. |
| Riverbend / The Willows | Low | Known for lower crime and family-friendly environment. |
| Mountain Arroyos | Low | Residential, quiet community. |
| Kohlberg North | Moderate | Some instances of property crime. |
| Prado Verde | Moderate | Moderate safety with occasional incidents. |
| Delgado Park | Moderate | Family-oriented but sees moderate crime rates. |
| Lindberg / East Bank | Moderate | Developing area, slightly higher crime rates. |
| Valley Creek South | High | Higher crime rates, including property crimes. |
| Ridgecrest / Mission Hills South | Low | Safe neighborhood, lower crime rate. |
- Violent Crime: El Paso’s violent crime rate (3.16 per 1,000) is slightly below the national average (3.81 per 1,000), indicating a safer environment in comparison to many U.S. cities. Assault is the most common violent crime in El Paso, with a rate of 2.30 per 1,000, which is lower than the national rate of 2.68 according to Neighborhood Scout.
- Property Crime: El Paso also has a lower property crime rate (14.05 per 1,000) compared to the national average (19.55 per 1,000). Theft is the most common property crime in the city, accounting for 10.51 per 1,000 residents.
- Neighborhood Safety: Neighborhoods like High Ridge, Bear Ridge, and Riverbend are among the safest in El Paso, while areas like Valley Creek South experience higher crime rates. This disparity reflects socio-economic factors and the development levels of different neighborhoods.
Methodology
For our 2024 population analysis of El Paso, we used data from:
- World Population Review, Macrotrends, and U.S. Census Bureau for primary estimates.
- Growth trends, age demographics, and dependency ratios were reviewed and compared to state averages.
- Cross-verification was done with multiple sources like Neilsberg to ensure consistency.
This blend of diverse data sources and verification ensured an accurate snapshot of El Paso’s evolving demographic profile.
References
- Elpasotexas.gov – Population Demographics, Housing Programs Division
- Neilsberg – El Paso, TX Population by Year
- World Population Review – El Paso Population 2024
- Macrotrends – Population By Year
- KVIA – EPISD nearly done with all projects from $668 million bond
- Rentcafe.com – El Paso, TX Rental Market Trends
- Zillow – El Paso, TX Housing Market
- DATAUSA – El Paso Education
- BLS – Economy At Glance
- Census.gov – Poverty Rate
- Fred.stlouisfed.org – Estimate of Median Household Income for El Paso County, TX
Related Posts:
- Idaho Population Growth in 2025 - Everything You…
- Population Data for Rhode Island 2025 - What You…
- Arkansas’ Population in 2025 - Everything You Need to Know
- Nevada’s Population in 2025 - Everything You Need to Know
- Charlotte Population 2025 - What You Need to Know
- Alaska Population 2025 - What You Need to Know


