The estimated population of Georgia in 2025 stands at around 11,145,300, based on World Population Review data.
The last official Census, conducted in 2020, recorded a population of 10, 711,908 people, marking a 20.3% increase from 2000 when the population was 8,186,453.
By July 2015, estimates indicated that Georgia’s population had grown to about 10,214,860.
Thanks to a steady growth rate of 1.19%, Georgia’s population first crossed the 10 million mark in 2013, making it one of the country’s fastest-growing states.
Table of ContentsKey Takeaways
Georgia Population by Gender
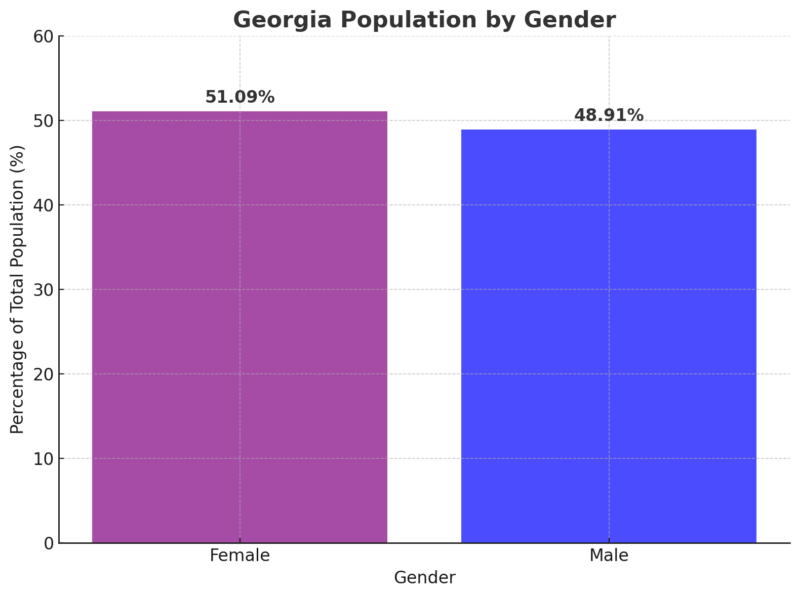
Females represent a slight majority of the population in Georgia, accounting for 51.09%, while males make up 48.91% of the population.
Gender Ratio by Age
Age Group
Male Population (%)
Female Population (%)
Gender Ratio
Under 5 years
51.34%
48.66%
1.06
5 to 9 years
51.06%
48.94%
1.04
10 to 14 years
51.11%
48.89%
1.05
15 to 19 years
50.89%
49.11%
1.04
20 to 24 years
51.23%
48.77%
1.05
25 to 29 years
49.96%
50.04%
1.00
30 to 34 years
49.10%
50.90%
0.96
35 to 39 years
48.84%
51.16%
0.95
40 to 44 years
48.79%
51.21%
0.95
45 to 49 years
48.91%
51.09%
0.96
50 to 54 years
49.23%
50.77%
0.97
55 to 59 years
48.67%
51.33%
0.95
60 to 64 years
47.65%
52.35%
0.91
65 to 69 years
46.02%
53.98%
0.85
70 to 74 years
45.71%
54.29%
0.84
75 to 79 years
43.43%
56.57%
0.77
80 to 84 years
40.87%
59.13%
0.69
85+ years
34.89%
65.11%
0.54
Data shows that the gender ratio by age, expressed in percentages, demonstrates that young children (under 5) have a slightly higher proportion of males, at 51.34%, compared to females.
However, as age increases, the balance shifts, with the female population percentage steadily increasing.
In the senior age brackets, particularly those over 80, females constitute over 59%, and in the 85+ age group, females make up 65.11% of the population.
Ethnic and Racial Diversity
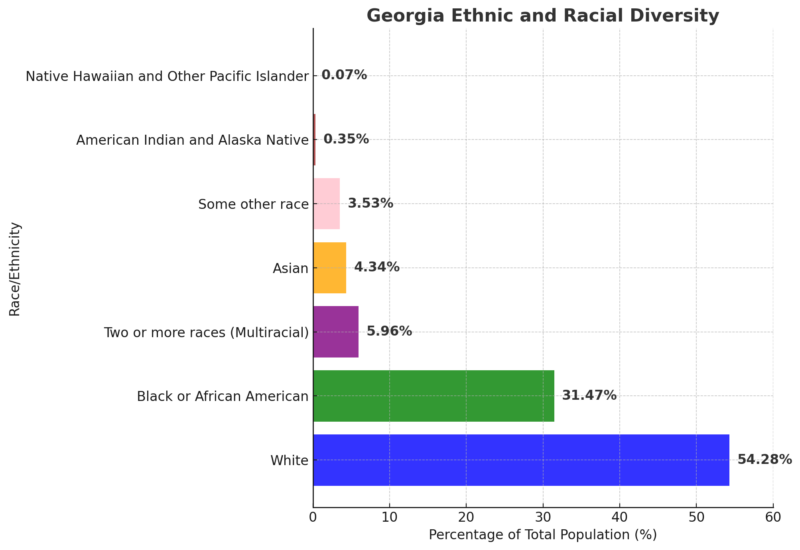
The White population represents the majority in Georgia at 54.28%, followed by Black or African American residents at 31.47%.
Multiracial individuals make up 5.96%, and Asian residents 4.34%, with smaller percentages represented by other racial groups according to Neilsberg.
Georgia Counties 2025 and Population Density
County
Population
Growth Rate (%)
Land Area (sq mi)
Population Density (per sq mi)
Fulton County
1,084,512
1.41%
203
2,058
Gwinnett County
990,879
3.39%
166
2,299
Cobb County
781,646
1.99%
131
2,299
DeKalb County
764,205
-0.04%
103
2,852
Chatham County
306,285
3.79%
167
707
Clayton County
298,201
-0.41%
55
2,100
Cherokee County
292,010
8.9%
163
694
Forsyth County
278,462
10.11%
87
1,238
Henry County
260,754
7.82%
123
817
Hall County
221,913
9.06%
152
565
Richmond County
204,484
-0.99%
125
631
Muscogee County
201,322
-2.75%
84
928
Paulding County
187,575
10.61%
120
601
Houston County
174,173
5.97%
145
463
Columbia County
167,853
7%
112
579
Coweta County
158,905
8.29%
170
360
Bibb County
156,898
-0.09%
96
630
Douglas County
150,867
4.3%
77
754
Clarke County
130,140
1.24%
46
1,094
Carroll County
129,666
8.51%
193
260
Fayette County
124,721
4.38%
75
640
Newton County
122,518
8.53%
106
447
Lowndes County
121,925
2.96%
192
245
Bartow County
117,267
7.28%
177
255
Walton County
110,340
13.57%
126
337
Whitfield County
104,279
1.45%
112
360
Floyd County
100,789
2.24%
197
198
Rockdale County
97,029
3.65%
50
746
Barrow County
96,339
14.72%
62
598
Jackson County
93,221
21.49%
131
274
Glynn County
87,199
3.22%
162
208
Bulloch County
85,616
7.12%
261
127
Dougherty County
82,395
-3.24%
127
250
Effingham County
74,048
13.62%
185
155
Troup County
71,237
2.75%
160
172
Spalding County
70,884
5.06%
76
362
Liberty County
70,501
7.94%
199
137
Walker County
70,013
3.36%
172
157
Catoosa County
68,984
1.44%
63
426
Gordon County
60,659
5.09%
137
170
Camden County
59,265
7.89%
243
94
Bryan County
51,260
13.8%
169
117
Laurens County
50,172
1.29%
312
62
Habersham County
50,049
8.47%
107
181
Colquitt County
46,504
1.34%
211
85
Thomas County
45,747
-0.06%
210
84
Polk County
44,777
4.32%
120
144
Oconee County
44,740
6.48%
71
243
Coffee County
43,387
0.76%
229
73
Baldwin County
43,159
-1.44%
100
167
Tift County
41,773
0.93%
101
160
Murray County
41,660
4.12%
133
121
Pickens County
37,113
11.33%
90
160
Harris County
37,051
6.17%
179
80
Ware County
36,889
1.82%
347
41
Lumpkin County
35,810
6.45%
109
127
Lee County
34,066
2.54%
137
96
Gilmer County
33,317
6.01%
164
78
Dawson County
33,275
22.97%
81
158
Madison County
32,932
8.77%
109
117
Haralson County
32,721
8.94%
109
116
Wayne County
32,009
6.19%
248
50
Monroe County
31,781
13.27%
153
80
Jones County
29,426
3.61%
152
75
White County
29,248
4.06%
93
121
Decatur County
29,155
-0.58%
230
49
Peach County
29,124
3.88%
58
194
Sumter County
28,916
-2.05%
186
60
Upson County
28,433
2.48%
125
88
Hart County
28,226
9.07%
90
122
Union County
27,858
12.32%
124
87
Stephens County
27,710
3.33%
69
155
Toombs County
27,267
0.7%
141
75
Butts County
27,029
5.79%
71
147
Fannin County
26,177
2.91%
149
68
Grady County
26,138
-0.33%
175
58
Chattooga County
25,482
2.23%
121
81
Franklin County
25,418
8.3%
101
97
Tattnall County
24,604
1.16%
186
51
Burke County
24,442
-0.78%
319
30
Putnam County
23,325
5.21%
133
68
Emanuel County
23,292
1.74%
263
34
McDuffie County
21,908
1.39%
99
85
Morgan County
21,896
8.39%
134
63
Greene County
21,333
12.11%
150
55
Lamar County
21,329
14.99%
71
116
Mitchell County
21,036
-2.93%
198
41
Meriwether County
20,972
1.72%
193
42
Pike County
20,967
10.67%
83
97
Long County
20,793
27.8%
154
52
Pierce County
20,660
4.62%
131
61
Banks County
20,236
11.92%
90
87
Elbert County
20,153
2.47%
135
57
Worth County
20,115
-2.98%
220
35
Washington County
19,875
-0.39%
262
29
Dodge County
19,679
-1.35%
191
40
Crisp County
19,533
-2.59%
105
72
Berrien County
18,925
4.3%
175
42
Brantley County
18,592
3.04%
171
42
Appling County
18,477
0.55%
196
36
Cook County
18,019
4.54%
88
79
Rabun County
17,617
4.17%
143
48
Ben Hill County
17,199
0.18%
97
69
Jasper County
16,931
15.48%
142
46
Dade County
16,240
0.01%
67
93
Brooks County
16,206
-0.41%
190
33
Oglethorpe County
15,977
7.45%
169
36
Jefferson County
15,072
-3.85%
203
29
Jeff Davis County
14,921
0.82%
128
45
Screven County
14,378
2.14%
249
22
Towns County
13,109
4.48%
64
79
Charlton County
13,080
4.36%
301
17
Bleckley County
12,651
1.02%
83
59
Crawford County
12,385
2.33%
125
38
Heard County
12,352
7.93%
114
42
Macon County
11,857
-1.36%
155
30
McIntosh County
11,819
7.59%
166
27
Dooly County
11,377
1.98%
152
29
Candler County
11,156
1.22%
94
46
Bacon County
11,075
-0.33%
110
39
Evans County
10,849
0.53%
71
59
Lanier County
10,727
8.04%
76
54
Early County
10,566
-2.11%
198
21
Pulaski County
10,227
3.62%
96
41
Wilkes County
9,471
-0.85%
181
20
Telfair County
9,462
-24.09%
169
22
Johnson County
9,353
1.85%
117
31
Irwin County
9,126
-5.4%
137
26
Seminole County
9,040
-1.02%
92
38
Turner County
8,982
-0.04%
110
32
Hancock County
8,935
2.57%
182
19
Montgomery County
8,879
3.53%
93
37
Wilcox County
8,807
0.23%
146
23
Wilkinson County
8,773
-0.68%
173
20
Terrell County
8,644
-5.43%
130
26
Jenkins County
8,599
-0.74%
134
25
Chattahoochee County
8,576
-9.49%
96
34
Atkinson County
8,426
1.42%
132
25
Lincoln County
7,899
2.56%
81
38
Taylor County
7,754
-0.82%
146
21
Twiggs County
7,706
-3.83%
139
21
Marion County
7,444
-1.14%
141
20
Wheeler County
6,852
-8.01%
114
23
Clinch County
6,813
1.38%
315
8
Treutlen County
6,323
-1.16%
77
32
Randolph County
6,030
-5.31%
165
14
Miller County
5,720
-4.54%
109
20
Talbot County
5,679
-0.82%
151
15
Calhoun County
5,440
-2.4%
108
19
Warren County
5,055
-2.92%
110
18
Stewart County
4,744
-10.54%
177
10
Schley County
4,555
0.42%
64
27
Echols County
3,732
0.3%
162
9
Glascock County
2,980
2.79%
56
21
Clay County
2,853
0.88%
75
15
Baker County
2,694
-5.54%
132
8
Webster County
2,337
-0.6%
81
11
Quitman County
2,301
3.32%
58
15
Taliaferro County
1,610
3.27%
75
8
Fulton County is Georgia’s most populous, with a population of approximately 1,084,512 according to WPR data.
The county has grown by 1.41% since the last census.
Other major counties with populations exceeding 500,000 include Gwinnett, Cobb, and DeKalb. Gwinnett County has experienced the highest growth among these, with a 3.39% increase.
Counties with the Smallest Populations
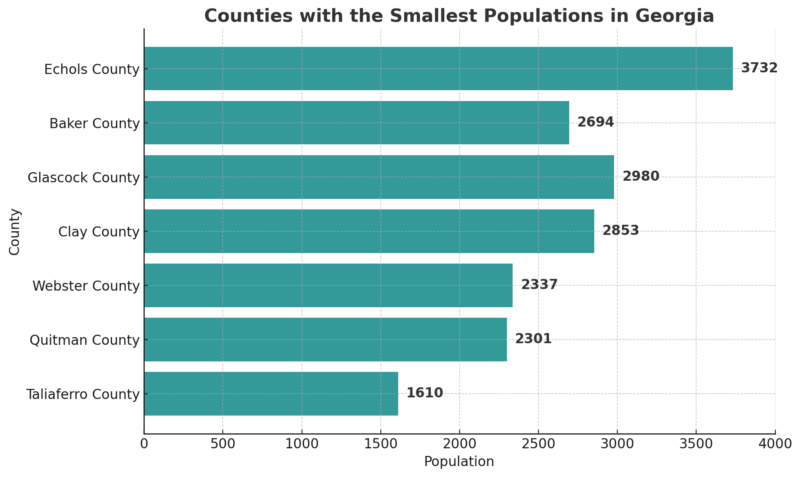
The least populated county in Georgia is Taliaferro, with around 1,610 residents, reflecting a 4.4% decrease in population since the previous census.
Other counties with populations under 5,000 include Quitman, Webster, Clay, Glascock, Baker, and Echols, all of which have seen population declines since 2010.
Georgia Counties with the Fastest Growth Rates
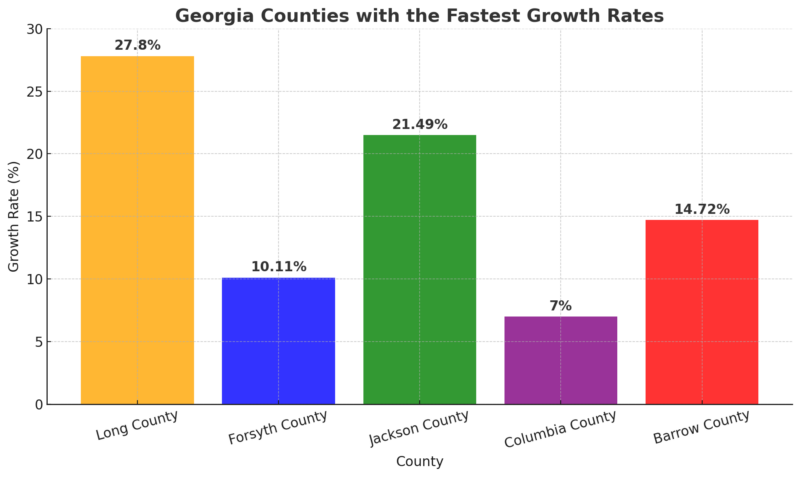
Long County has seen the highest growth rate in Georgia, increasing by 27.8% since the last census.
Forsyth County and Jackson County have also experienced rapid growth, with rates over 20%.
Birth and Death Rates
Indicator
Georgia (2022)
United States (2022)
Crude Birth Rate
11.4 per 1,000
11.0 per 1,000
Crude Death Rate
10.2 per 1,000
10.5 per 1,000
Infant Mortality Rate
7.08 per 1,000
5.6 per 1,000
Life Expectancy at Birth
74.3 years
77.5 years
- Crude Birth Rate: Georgia’s crude birth rate in 2022 was 11.4 births per 1,000 population, slightly higher than the national average of 11.0 per 1,000. This indicates a marginally higher birth rate in Georgia compared to the overall U.S. CDC.
- Crude Death Rate: The state’s crude death rate stood at 10.2 deaths per 1,000 population, slightly below the national average of 10.5 per 1,000. This suggests a marginally lower mortality rate in Georgia relative to the national figure.
- Infant Mortality Rate: Georgia’s infant mortality rate was 7.08 deaths per 1,000 live births, notably higher than the U.S. average of 5.6 per 1,000. This indicates a significant area for improvement in maternal and infant health within the state.
- Life Expectancy: The life expectancy at birth in Georgia was 74.3 years, which is 3.2 years lower than the national average of 77.5 years as the Department of Public Health notes
Migration Patterns
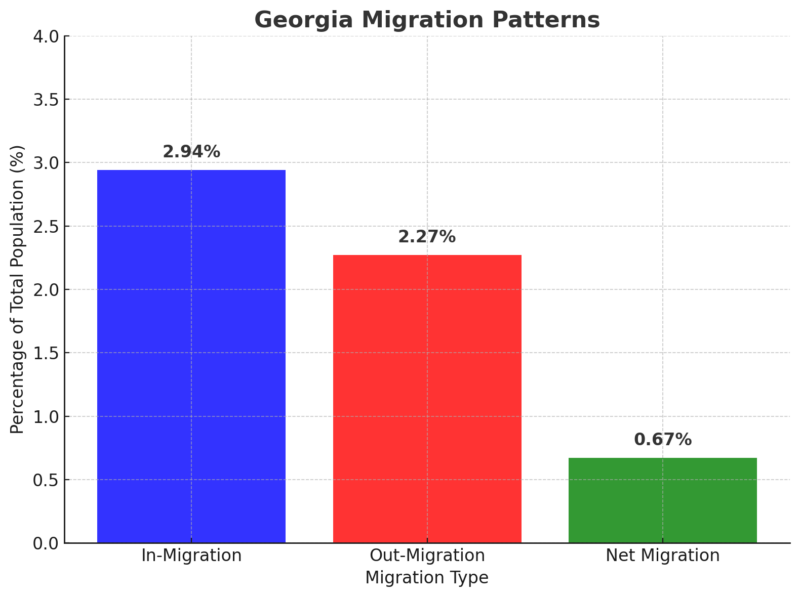
- In-Migration: In 2023, Georgia experienced an influx of 327,795 residents from other states, accounting for approximately 2.94% of the state’s total population as per the US census.
- Out-Migration: During the same period, 253,275 residents moved out of Georgia to other states, representing about 2.27% of the population. While this reflects a substantial number of departures, it is outweighed by the number of incoming residents.
- Net Migration: The net migration for Georgia in 2023 was +74,520, meaning the state gained more residents than it lost. This net gain of 0.67% of the total population suggests that Georgia continues to be a net recipient of domestic migration, contributing to its overall population growth.
Georgia’s migration office deports 60 in October. https://t.co/qIbVIvUCEN
— Agenda Georgia (@AgendaGeorgia) November 2, 2024
Labor Market Effects
Data Series
April 2024
May 2024
June 2024
July 2024
August 2024
September 2024 (Preliminary)
Civilian Labor Force
5,357.1
5,375.8
5,391.3
5,405.4
5,410.7
5,415.5
Employment
5,191.6
5,205.9
5,214.4
5,219.7
5,218.1
5,219.9
Unemployment
165.5
169.9
176.9
185.6
192.6
195.6
Unemployment Rate
3.1%
3.2%
3.3%
3.4%
3.6%
3.6%
BLS notes that Georgia’s labor force showed steady growth, increasing from 5,357.1 thousand in April 2024 to a preliminary 5,415.5 thousand in September 2024. This trend reflects more individuals entering or re-entering the workforce over this period.
Employment also rose, although at a slightly slower rate than the labor force. Employment numbers increased from 5,191.6 thousand in April to a preliminary 5,219.9 thousand in September.
Unemployment figures show a gradual increase, from 165.5 thousand in April to 195.6 thousand in September. This rise aligns with an upward trend in the unemployment rate, from 3.1% in April to 3.6% in both August and September. The increase suggests some challenges in job absorption within the growing labor force.
The unemployment rate in Georgia rose incrementally over the months, reaching a preliminary 3.6% in August and September. Although still relatively low, this increase indicates a slight slowing in job availability relative to labor force growth
Housing and Real Estate Trends
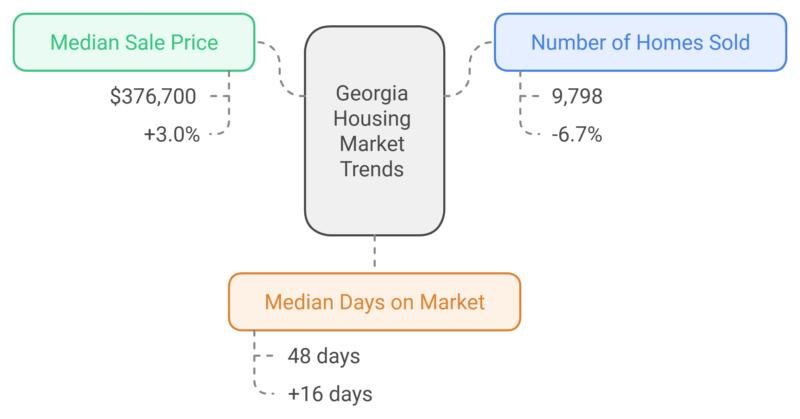
The median sale price for homes in Georgia increased by 3.0% from the previous year, reaching $376,700 in September 2024 as per Redfin.
The number of homes sold decreased by 6.7% compared to the previous year, with 9,798 homes sold in September. This reduction in sales suggests either a decrease in demand or fewer buyers in the market, possibly due to economic conditions or affordability concerns.
Homes are staying on the market longer, with the median days on the market increasing by 16 days to 48 days. This trend may imply that buyers are being more cautious or that there is an increase in inventory leading to longer selling times.
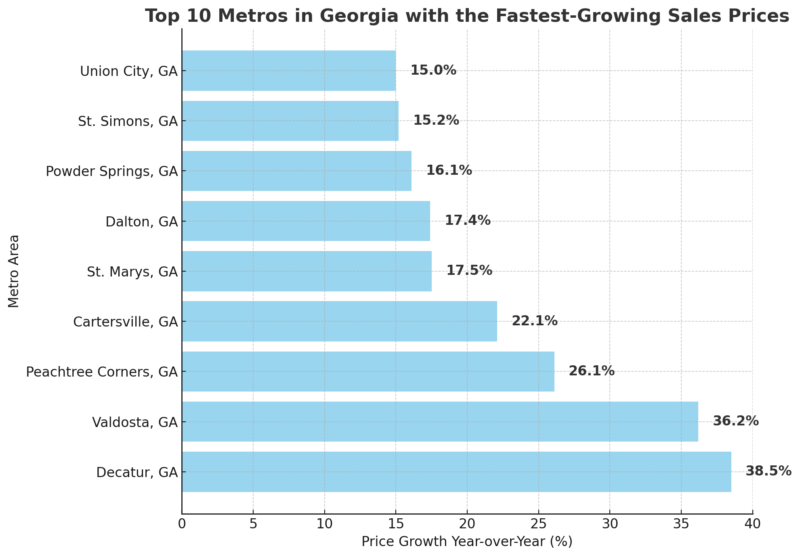
Top 10 Metros in Georgia with the Fastest-Growing Sales Prices
Georgia Income Statistics for 2025
Income Metric
Georgia Value
Comparison to US Average
Average Household Income
$99,345
6% lower than the US average ($105,833)
Median Household Income
$71,355
5% lower than the US median ($75,149)
Average Salary (Full-Time Workers)
$73,766
Not provided
Median Salary (Full-Time Workers)
$53,381
Not provided
Median Income (Single-Person Household)
$38,351
Not provided
Per Capita Income
$37,836
Not provided
Georgia’s average household income is $99,345, slightly below the national average by 6% as per incomebyzipcode. The median household income in Georgia is also below the US median, indicating that while the state has considerable earning potential, it remains slightly behind national income levels on average.
For full-time employees, the average salary is $73,766, while the median salary is lower at $53,381. This disparity suggests a skew towards higher earners, which raises the average relative to the median.
Single-person households in Georgia have a median income of $38,351, while the average per capita income is $37,836. The per capita figure accounts for the entire population, which includes non-working dependents, leading to a lower average compared to household and salary data.
Top 10 Richest Georgia Zip Codes (2025)
Rank
Zip Code
Population
Mean Income
Median Household Income
1
30327
22,585
$322,047
$173,761
2
30342
33,154
$205,054
$115,779
3
30305
26,565
$199,640
$103,982
4
30075
57,032
$196,814
$148,740
5
30319
45,025
$196,043
$127,776
6
30306
24,493
$195,439
$120,679
7
30005
40,260
$192,519
$162,808
8
30004
66,406
$192,261
$136,124
9
30307
21,266
$190,023
$140,417
10
30363
3,277
$187,652
$103,879
Educational Attainment in Georgia (2025)
Approximately 26% of Georgia’s population holds a high school diploma as their highest educational achievement, with an additional 11% not having completed high school.
A combined 35% of Georgians have either a bachelor’s degree or a post-graduate degree. This distribution shows a moderate level of higher education within the state, with 28% having attended some college but not completing a four-year degree, which may reflect either community college or incomplete university education.
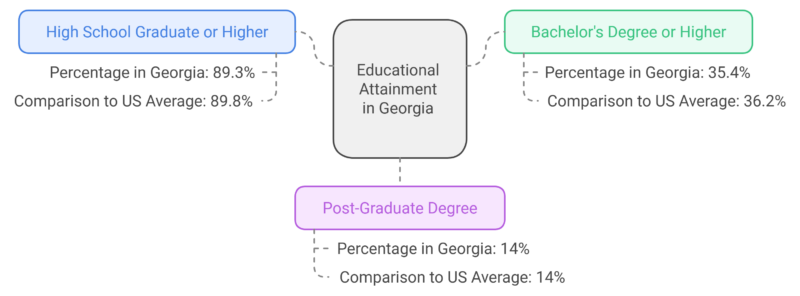
Georgia’s high school graduation rate is 89.3%, which is nearly identical to the national rate of 89.8%. This indicates that Georgia’s educational attainment at the high school level is comparable to the rest of the country.
With 35.4% of the population holding a bachelor’s degree or higher, Georgia is slightly below the national rate of 36.2%. This suggests a similar but slightly lower percentage of individuals with college degrees compared to the overall US population.
Georgia matches the national average for post-graduate degrees, with 14% of the population holding advanced degrees.
Future Projections
via https://t.co/261pAFAg2K 2024 Population Projections Data |
The Governor’s Office of Planning and Budget is charged with the responsibility of preparing, maintaining, and furnishing official demographic data for the state (O.C.G.A. § 45-12-171)… https://t.co/sB7jSTuDoS— Census State Data Centers (@censusSDC) September 6, 2024
Georgia’s population is projected to continue its growth trajectory over the coming decades. According to the Governor’s Office of Planning and Budget, the state’s population is expected to increase from approximately 11 million in 2024 to over 13 million by 2060 as per Georgia Public Broadcasting
These projections are based on the cohort-component method, which considers factors such as fertility, mortality, and migration rates. The methodology and detailed data can be accessed through the Governor’s Office of Planning and Budget’s official documentation.
Additionally, the Weldon Cooper Center for Public Service provides national population projections, including state-level data. Their analysis indicates that Georgia will remain among the top ten most populous states through 2050, reflecting sustained growth.
Methodology
To craft this article, we gathered Georgia’s demographic data from reputable sources, including the U.S. Census Bureau, the Georgia Governor’s Office of Planning and Budget, and recent surveys.
We analyzed historical population trends and used demographic modeling methods like cohort-component projection to estimate future growth. Key indicators, such as birth and death rates, migration, and educational attainment, were included for a well-rounded view.
Data was compared with national averages to contextualize Georgia’s statistics within the broader U.S. landscape. Finally, findings were cross-verified with published government reports to ensure accuracy and reliability in our projections and insights.
References
- World Population Review – Georgia Population 2024
- U.S. Census Bureau – Georgia Profile Data
- Neilsberg – Georgia Population by Gender
- Neilsberg – Georgia Population by Race
- Centers for Disease Control and Prevention (CDC) – Georgia State Health Profile
- Georgia Department of Public Health – Maternal Mortality Data
- U.S. Census Bureau – State-to-State Migration Flows
- 11Alive News – Where People Are Moving From: Migration Patterns
- Bureau of Labor Statistics (BLS) – Georgia Economy at a Glance
- Redfin – Georgia Housing Market
- Income by Zipcode – Georgia Income Data
- Georgia Public Broadcasting – Georgia Population Projections
- Weldon Cooper Center for Public Service – National and State Population Projections
Related Posts:
- Map of the City of Atlanta, Georgia – Geography,…
- Map of Georgia - Cities, Geography, Counties & Stats (2025)
- Philadelphia Population 2025 - Current Figures and Analysis
- New Orleans Population 2025 - Current Data and…
- Wisconsin’s Population Data in 2025 - Key Insights…
- West Virginia Population 2025 - A Comparative Analysis


