Illinois population has seen notable changes over the past few years, and the latest data for 2025 offers insightful trends.
In 2025, Illinois’ population stands at approximately 12,516,863, continuing a slight decline from 12.55 million in 2023.
The population dynamics in Illinois between 2010 and 2022 highlight fluctuating growth rates, with the largest annual increase at 0.9% between 2019 and 2020, and a significant decline of 0.8% from 2021 to 2022 following the trend of the entire country.
Overview of Population in 2025

In 2025, the Illinois population stands at approximately 12,516,863. This marks another year of population decrease, continuing a trend observed over the past few years.
From 2023 to 2025, the state experienced a slight decline of 0.26%. In 2023, the population was about 12.55 million, according to Illinois Department of Public Health’s report.
Between 2021 and 2022, Illinois saw a more significant decline of 0.85%, indicating a sharper decrease during that period. This consistent reduction has been influenced by various factors including outmigration and lower birth rates.
Illinois is one of the few states experiencing a negative growth rate. In 2015, the Census estimated the population to be around 12,859,995, showcasing that the state’s population has been gradually declining over the years.
Examining historical data, Illinois’s population increased only in 4 out of the 12 years between 2010 and 2022. The highest annual increase was a 0.9% rise between 2019 and 2020, while the most substantial decline was between 2021 and 2022 at 0.8% as per Illinoispolicy.org.
Age Distribution
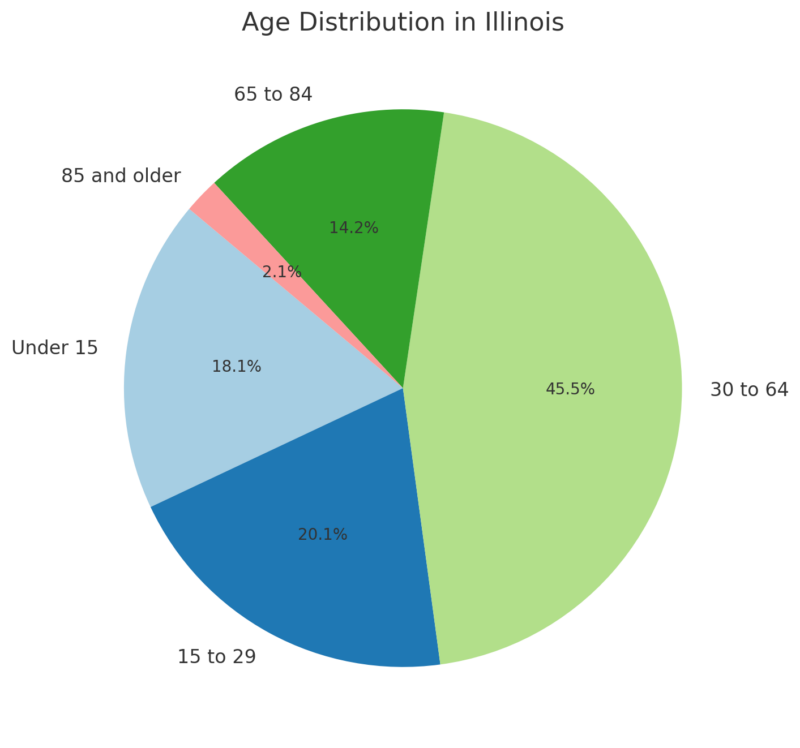
The median age in Illinois is 38.7 years according to Datausa.io.
Younger populations are robust, with 18.12% under 15 years old. The 15 to 29 age group comprises 20.13%, reflecting a significant youth presence. A dominant share, 45.51%, falls within the 30 to 64 range, often considered the primary workforce age.
Seniors aged 65 to 84 make up 14.18%, while those 85 and older account for 2.06%. This age structure highlights a balanced mix of working-age individuals, youth, and elder residents.
Religion
Gender Composition
Illinois demonstrates a near-equal gender distribution. As of recent estimates, approximately 50.9% of the population is female, while 49.1% is male.
This balance impacts various socio-economic factors, from labor markets to health services.
Gender parity underscores equitable representation in different sectors and fosters diverse consumer behaviors.
Racial and Ethnic Diversity
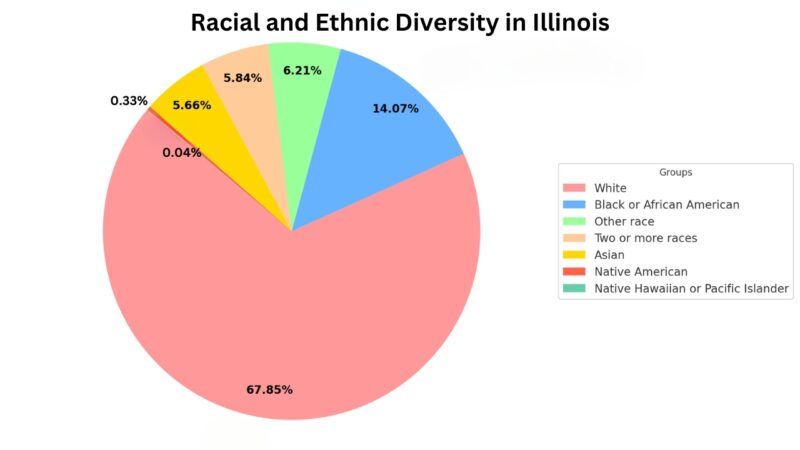
As of the latest updates, the racial composition of the Illinois population showcases a unique diversity. The White population holds a majority. Other significant groups include African Americans, Hispanics, and Asians.
African Americans constitute a substantial part of the population, while Hispanics and Asians present growing, dynamic communities. These demographics illustrate the state’s rich cultural tapestry, influencing everything from culinary trends to educational programs.
According to the most recent World Population Review, the racial composition of Illinois was:
- White: 67.85%
- Black or African American: 14.07%
- Other race: 6.21%
- Two or more races: 5.84%
- Asian: 5.66%
- Native American: 0.33%
- Native Hawaiian or Pacific Islander: 0.04%
Population by Counties
Rank
County
Population
1
Cook County
5,087,072
2
DuPage County
921,213
3
Lake County
708,760
4
Will County
700,728
5
Kane County
514,982
6
McHenry County
312,800
7
Winnebago County
280,922
8
Madison County
262,752
9
St. Clair County
251,018
10
Champaign County
205,644
11
Sangamon County
193,491
12
Peoria County
177,513
13
McLean County
170,441
14
Rock Island County
141,236
15
Kendall County
139,976
16
Tazewell County
129,541
17
LaSalle County
108,309
18
Kankakee County
105,940
19
Macon County
100,591
20
DeKalb County
100,288
21
Vermilion County
71,652
22
Williamson County
66,706
23
Adams County
64,441
24
Whiteside County
54,498
25
Grundy County
53,578
26
Boone County
53,202
27
Jackson County
52,141
28
Ogle County
51,265
29
Henry County
48,448
30
Knox County
48,411
31
Coles County
46,060
32
Macoupin County
44,018
33
Stephenson County
43,105
34
Woodford County
38,285
35
Franklin County
37,138
36
Clinton County
36,785
37
Marion County
36,673
38
Jefferson County
36,320
39
Livingston County
35,320
40
Monroe County
34,957
41
Effingham County
34,331
42
Lee County
33,654
43
Christian County
33,228
44
Bureau County
32,729
45
Fulton County
32,541
46
Morgan County
32,140
47
Randolph County
29,815
48
Montgomery County
27,663
49
Logan County
27,590
50
McDonough County
26,839
51
Iroquois County
26,136
52
Saline County
22,873
53
Jo Daviess County
21,756
54
Fayette County
21,164
55
Jersey County
21,091
56
Shelby County
20,568
57
Perry County
20,503
58
Douglas County
19,629
59
Crawford County
18,300
60
Hancock County
17,186
61
Piatt County
16,714
62
Union County
16,667
63
Bond County
16,450
64
Edgar County
16,334
65
Warren County
16,185
66
Wayne County
15,761
67
Carroll County
15,526
68
Richland County
15,488
69
Mercer County
15,487
70
De Witt County
15,365
71
Clark County
15,088
72
Lawrence County
14,813
73 TIE
Pike County
14,342
73 TIE
Moultrie County
14,342
75
Massac County
13,661
76
Washington County
13,536
77
White County
13,401
78
Johnson County
13,326
79
Ford County
13,250
80
Clay County
12,999
81
Cass County
12,596
82
Mason County
12,523
83
Menard County
11,954
84
Marshall County
11,683
85
Greene County
11,543
86
Wabash County
10,942
87
Cumberland County
10,261
88
Jasper County
9,144
89
Hamilton County
7,911
90
Schuyler County
6,733
91
Brown County
6,294
92
Henderson County
6,088
93
Edwards County
5,968
94
Putnam County
5,561
95
Stark County
5,218
96
Pulaski County
4,911
97
Scott County
4,710
98
Alexander County
4,695
99
Gallatin County
4,670
100
Calhoun County
4,317
101
Pope County
3,707
102
Hardin County
3,569
Illinois’s population varies significantly across its counties. Cook County, which includes Chicago, holds the largest portion of the state’s population according to Illinois- Demographics.com.
As of 2025, it is home to approximately 40% of Illinois residents. Other populous counties include DuPage, Lake, and Will, all part of the Chicago metropolitan area.
- Cook County: Largest population center with Chicago as its hub.
- DuPage, Lake, and Will Counties: Significant suburban populations in the Chicago metro area.
Smaller counties, particularly in the southern and western regions, have seen stagnant or declining populations. This trend emphasizes the concentration of residents in the northeastern part of the state.
Urban vs Rural Populations

About 75% of the state’s residents live in urban settings. This urban concentration affects economic, social, and infrastructural dynamics. Similarly, Phoenix, as a major urban center in Arizona, reflects a comparable trend in urban population growth, impacting the state’s overall demographic landscape.
- Urban Population (75%): Urban centers like Chicago contribute majorly to the state’s demographic makeup.
- Rural Population (25%): Rural areas experience slower growth, often facing challenges like economic stagnation and lack of amenities.
Smaller cities and towns in central and southern Illinois comprise the rural population, showcasing a stark contrast in densities and growth rates compared to urban counterparts. This demographic split influences policy-making and resource allocation across the state.
Population Growth Trends
In 2023, the population of Illinois was approximately 12.55 million, showing a decrease of 0.26% from the previous year. This decline continued from 2022, where Illinois had a population of 12.58 million, a drop from 12.69 million in 2021.
Population Changes
- 2023: 12.55 million (0.26% decrease)
- 2022: 12.58 million (0.85% decrease)
- 2021: 12.69 million
The state’s population trends have been marked by both growth and decline. Between 2010 and 2022, Illinois experienced population increases in four out of the twelve years. The largest annual increase was 0.9% from 2019 to 2020, while the largest decline occurred between 2021 and 2022 with a drop of 0.8% as per USAFacts.
Notable Trends
- Largest Increase: 0.9% (2019-2020)
- Largest Decline: 0.8% (2021-2022)
Labor Force Statistics
Illinois boasts the fifth-largest economy among U.S. states. According to the U.S. Bureau of Labor Statistics (BLS), notable metropolitan areas such as Bloomington-Normal and Cape Girardeau-Jackson play a crucial role in shaping the state’s labor market. Recent BLS findings indicate a slower job growth rate than initially reported, with an average monthly job gain of 173,500 from April 2023 to March 2024.
The state’s economy features a diverse mix of industries, including manufacturing, healthcare, and finance. This diversity contributes to strong employment figures despite a slightly contracting population. Businesses and policymakers are focused on enhancing job opportunities and workforce skills to ensure sustained economic stability.
Household Income Distribution
Household income distribution reveals much about economic equity in Illinois.
A recent report from Illinois Policy highlights the economic impact of population decline, indicating a $31.4 billion reduction in economic size. This shrinkage affects household income levels, with property taxes rising by an average of $756 over five years.
Income disparity remains a concern as urban areas like Chicago exhibit higher income levels compared to rural regions. By analyzing these trends, stakeholders strive to implement policies that promote income growth and equitable distribution. Efforts such as increasing job training programs and economic incentives for businesses aim to bridge these income gaps.
Migration Patterns
Illinois’s population has experienced notable migration trends over the past decade. According to an analysis of survey and revenue data, the state saw both inflows and outflows impacting its demographics.
Between 2010 and 2022, Illinois had a net loss of 460,000 residents moving to other states. This trend contributes to a complex demographic shift. Despite these losses, the population shows stability due to incoming migration. Immigrants, in particular, play a significant role.
The state is becoming less rural and more educated. This shift aligns with the increase in foreign-born residents and higher-paying jobs according to some studies.
For a clearer picture, consider the following data points:
- Net Migration Loss: -460,000 residents to other states
- Key Time Period: 2010-2022
- Characteristics: More educated, higher-paid, urban residents
A report by KDM Consulting highlights a historic trend. Illinois has faced net-negative domestic migration for nearly a century, with rare exceptions such as 1947. This information aligns with contemporary findings, reinforcing the long-term trends detailed.
Policy Implications
Economic Impact: A declining workforce can hamper economic growth. Policymakers may need to provide incentives to attract businesses and residents.
Government Funding: Reduced population affects state and federal funding allocations. This change could lead to tighter budgets for public services.
To address these issues, Illinois can consider:
- Tax Reforms: Adjusting tax policies to make the state more attractive for both businesses and individuals.
- Infrastructure Investment: Improving transportation, healthcare, and education to increase the state’s appeal.
- Housing Initiatives: Developing affordable housing projects to retain and attract residents.
Political Representation: Population changes influence the state’s political clout, and shifts could impact the number of congressional seats Illinois holds according to WSIU.org.
Workforce Development: Focusing on skill development programs can help prepare the existing population for emerging job markets.
Collaboration between government and private sectors is crucial for effective policy implementation. These policies can help stabilize and eventually grow Illinois’ population.
Future Projections

According to the Illinois Department of Public Health, the state’s population trends are projected by age and sex up to the year 2035.
Between 2020 and 2040, Illinois’ population is expected to decrease by 3.1%, translating to a loss of approximately 393,624 people, as indicated by a study from the Weldon Cooper Center for Public Service.
A detailed breakdown by the National Projections shows that shifts in age and sex demographics will be essential indicators.
These projections are benchmarked on the 2020 Census data to provide a comprehensive view of population dynamics.
Key Points
- Illinois’ population decline may shift it from the sixth to the eighth most populous state by 2040.
- Changes will impact various age and sex groups, with specific trends contingent on broader national patterns.
- Understanding these shifts will be critical for policy planning and resource allocation.
These insights highlight the importance of ongoing demographic monitoring and policy adjustments to address the evolving needs of Illinois residents.