
As of 2025, the most accurate answer is this: the United States performs several million cosmetic procedures per year, but only about 1.6 to 1.7 million of those are surgical plastic surgeries, while the vast majority are minimally invasive treatments such as Botox and dermal fillers.
Full, finalized national counts for 2025 have not yet been released by the American Society of Plastic Surgeons (ASPS), but based on published 2023–2024 data, early 2025 trend reports, and market growth rates, the total number of cosmetic procedures performed in the U.S. in 2025 is best estimated between 6.2 and 6.6 million, with traditional surgical procedures remaining relatively flat and non-surgical treatments continuing to dominate volume.
What Counts as Plastic Surgery in U.S. Statistics
One of the biggest sources of confusion in cosmetic surgery reporting is terminology. In official U.S. reporting, plastic surgery does not mean the same thing as cosmetic procedures.
Surgical operations and non-surgical treatments are tracked separately, and the difference matters when discussing how many people actually undergo surgery.
Plastic surgery statistics in the U.S. usually come from three sources: ASPS, ISAPS (International Society of Aesthetic Plastic Surgery), and market research firms. All three separate procedures into two major categories.
| Category | What It Includes | Why It Matters |
| Cosmetic surgical procedures | Liposuction, breast augmentation, tummy tuck, facelift, eyelid surgery | Involves anesthesia, operating rooms, and recovery |
| Minimally invasive procedures | Botox, fillers, laser treatments, skin tightening | Short appointments, repeated sessions, much higher volume |
When headlines say “millions of Americans get plastic surgery,” they are usually referring to combined totals, not surgery alone.
Latest Confirmed Baseline: 2024 U.S. Data
Before estimating 2025, it is important to anchor the discussion in the most recent finalized data.
According to ASPS and ISAPS reporting for 2024:
| Metric (U.S.) | Confirmed 2024 Figure |
| Cosmetic surgical procedures | ~1.58 million |
| Minimally invasive cosmetic procedures | 28+ million |
| Combined cosmetic procedures (counting unique surgical events) | ~6.1 million |
| Share of surgical procedures | ~26 percent |
| Shares that were non-surgical | ~74 percent |
The large difference between “28 million treatments” and “6.1 million procedures” exists because injectables are counted per session, while surgical statistics count completed operations.
Estimated Total Plastic Surgery and Cosmetic Procedures in 2025
No national body has released a finalized 2025 procedural census yet. However, growth rates between 2022 and 2024 were modest and consistent, allowing a reliable projection.
Industry reports and clinic-level data published in early 2025 indicate:
- Surgical procedure volume remained stable or grew slightly, typically 1–3 percent year over year
- Minimally invasive procedures grew faster, typically 4–6 percent
Using conservative assumptions, the estimated 2025 totals are as follows.
| Procedure Type | Estimated 2025 Volume (U.S.) | Change vs 2024 |
| Cosmetic surgical procedures | 1.60–1.65 million | Slight increase |
| Minimally invasive procedures | 29–30 million | Moderate increase |
| Combined cosmetic procedures | 6.2–6.6 million | Incremental growth |
These figures reflect procedure counts, not unique individuals. Many patients undergo multiple treatments per year, especially for injectables.
How Many People, Not Procedures, Were Involved in 2025
A more meaningful question is how many individual people underwent plastic surgery or cosmetic treatment in 2025. This number is lower than the total procedures because repeat visits are common.
Based on ASPS patient utilization studies:
- Surgical patients average 1.2–1.4 procedures per year
- Injectable patients average 2.5–3.5 treatments per year
Using those ratios:
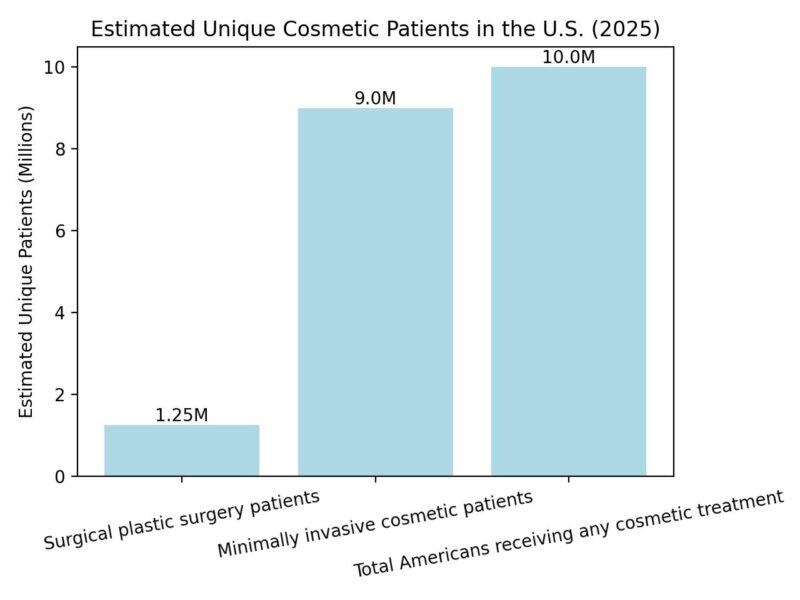
This means that roughly 3–4 percent of the U.S. adult population received some form of cosmetic procedure in 2025, while less than 0.5 percent underwent surgery.
The Role of Injectable Clinics in 2025 Procedure Volume
A significant reason non-surgical procedures dominate U.S. cosmetic statistics in 2025 is the rise of specialized injectable clinics that operate outside traditional hospital or surgical settings.
These clinics focus almost entirely on treatments such as Botox, dermal fillers, collagen stimulators, and preventative facial aging protocols, allowing them to serve far more patients per day than a surgical practice ever could.
Because injectables require no operating room, minimal recovery time, and repeat visits every few months, they account for a disproportionate share of total cosmetic procedure volume. Clinics like InjectCo reflect this structural shift in the industry, where cosmetic medicine increasingly resembles routine outpatient care rather than episodic surgery.
This model helps explain why millions of cosmetic procedures can be performed annually in the U.S., even though the number of board-certified plastic surgeons and operating rooms has remained relatively stable.
Most Common Surgical Procedures in 2025
Procedure rankings remained largely unchanged in 2025, continuing patterns seen since 2020.
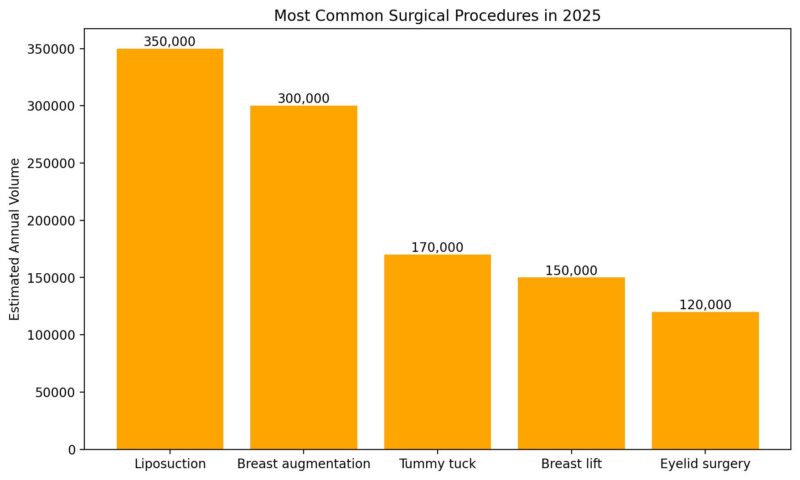
These five procedures account for more than half of all cosmetic surgeries performed in the U.S.
Why 2025 Did Not See a Surgery Boom
View this post on Instagram
Despite social media visibility and increased normalization of cosmetic work, 2025 did not produce a sharp increase in surgical volume. Several structural reasons explain this.
First, surgical procedures are constrained by operating room capacity, surgeon availability, and recovery time.
These limits prevent explosive growth. Second, higher interest rates and medical financing costs in 2024–2025 reduced discretionary spending on high-ticket elective surgery.
Third, many patients opted for staged or non-surgical alternatives instead of full surgery.
This explains why injectables grew faster than surgery, even as interest in aesthetic enhancement remained strong.
Gender and Age Distribution in 2025
Demographic patterns in 2025 were consistent with prior years.
| Group | Share of Cosmetic Surgery Patients |
| Women | ~86 percent |
| Men | ~14 percent |
| Ages 30–39 | Largest single group |
| Ages 40–54 | Highest surgical spending |
| Under 30 | Primarily injectables |
Men continued to grow as a segment, particularly in eyelid surgery, liposuction, and gynecomastia procedures, but overall volumes remained far lower than for women.
Economic Size of the U.S. Plastic Surgery Market in 2025
Procedure volume does not tell the whole story. Revenue continued to grow faster than case counts due to rising costs, bundled procedures, and higher average prices.
| Metric | 2025 Estimate |
| U.S. cosmetic surgery market value | ~$17–18 billion |
| Average surgical procedure cost | $6,000–$7,500 |
| Average injectable session cost | $600–$900 |
| Share paid out-of-pocket | ~92 percent |
Insurance coverage remains extremely limited for cosmetic procedures, meaning nearly all spending reflects discretionary consumer behavior.
Why Official 2025 Numbers Lag
ASPS and ISAPS release final annual reports 6–12 months after the end of a calendar year. The delay exists because:
- Data is voluntarily reported by surgeons
- Clinics must reconcile duplicates and revisions
- International comparisons require harmonization
For this reason, 2025 estimates rely on validated trends rather than speculation, and final confirmation will likely arrive in mid to late 2026.
Bottom Line
@alexisparcellsmd What are your Ins and Outs for 2025? #plasticsurgery #insandouts ♬ BIRDS OF A FEATHER – Billie Eilish
In 2025, plastic surgery in the United States remained high-volume but stable, not explosive. The best evidence shows:
- About 1.6 million plastic surgical surgeries
- Roughly 6.2–6.6 million total cosmetic procedures
- Around 9–11 million unique individuals are receiving some form of aesthetic treatment
- Continued dominance of non-surgical procedures over traditional surgery
The data shows normalization, not acceleration. Plastic surgery in 2025 was not a cultural surge, but a mature, steady medical market shaped by economics, technology, and repeat consumer behavior.