Washington state’s population continues to grow, reaching an estimated 8,035,700 people as of April 1, 2025, according to the Office of Financial Management.
This marks an increase of 84,550 residents over the past year.
While the state is still expanding, the growth rate has slowed compared to the average from the previous decade (84,550 in 2025 compared to an annual average of 98,200 between 2010 and 2020).
However, it matches the 1.1% growth rate seen last year.
Since April 2020, Washington’s population has grown by 329,400 people, which translates to a solid 4.3% increase for the current decade so far.
The main factor behind this growth is net migration, as more people move to Washington than leave.
Migration accounted for 82% of this year’s population growth, or about 69,100 people, although that’s slightly fewer than last year’s numbers (down by 3,300).
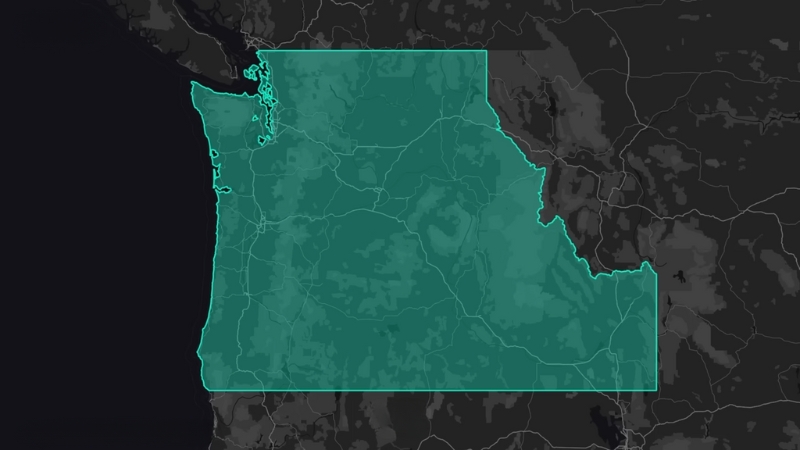
Washington, known for its diverse landscapes that range from coastal beaches to lush forests and mountainous terrains, borders Oregon to the south, Idaho to the east, and Canada to the north.
Key Takeaways
Population by Race
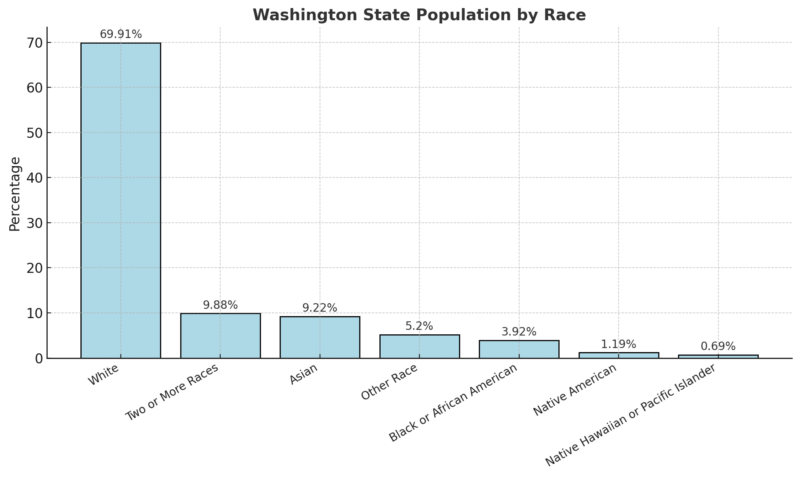
White residents remain the largest demographic group, accounting for nearly 70% of the population accoding to the World Population Review.
The second-largest group, individuals identifying as Two or More Races, represent about 10%, indicating a notable trend toward a more multiracial population.
Asians also make up a significant share of the population at 9.22%, reflecting Washington’s historical and current connections to Asian communities.
Smaller demographic groups, including Black or African American (3.92%), Native American (1.19%), and Native Hawaiian or Pacific Islander (0.69%), contribute to the state’s rich cultural diversity.
These figures underscore the importance of policies and community efforts that address the needs of a racially and culturally diverse population.
Population by Sex
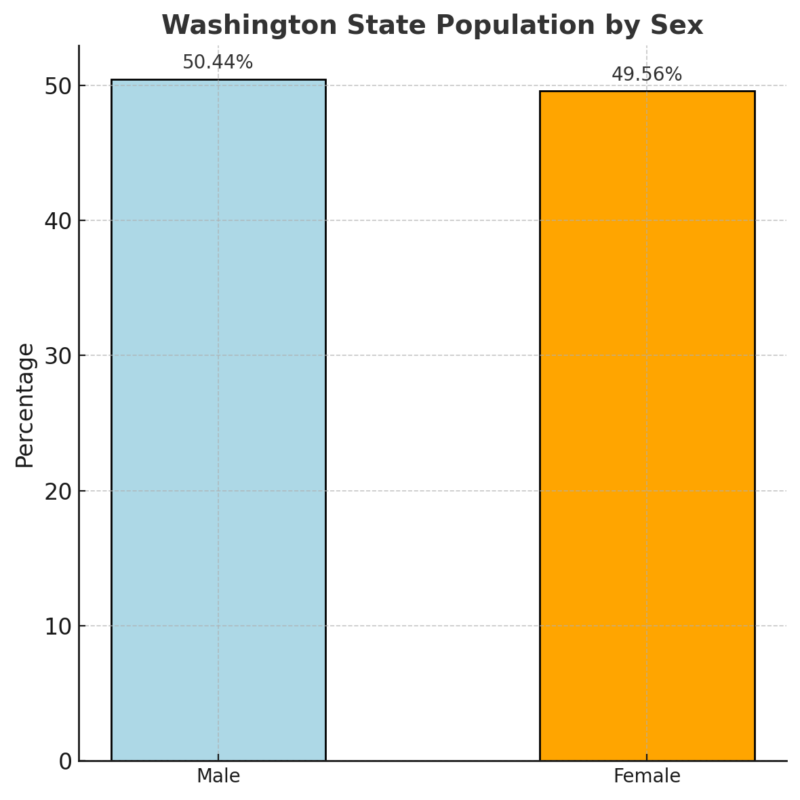
The state’s population is nearly evenly split between males and females, with a slight male majority (50.44%).
This balance suggests that demographic policies and public services can be broadly inclusive without significant gender-based disparity.
Median Age and Dependency
Category
Value
Median Age
38 years
Male Median Age
37.1 years
Female Median Age
39 years
Age Dependency Ratio
60.3%
Child Dependency Ratio
34.7%
Old Age Dependency Ratio
25.6%
Washington’s median age of 38 years is slightly above the national average, reflecting a mature but still active workforce.
The child dependency ratio (34.7%) and old age dependency ratio (25.6%) highlight a balanced demand for services catering to both youth and seniors.
With over 60% of the population dependent on the working-age population, economic and social policies must ensure robust support systems for both ends of the age spectrum.
Adult and Senior Population
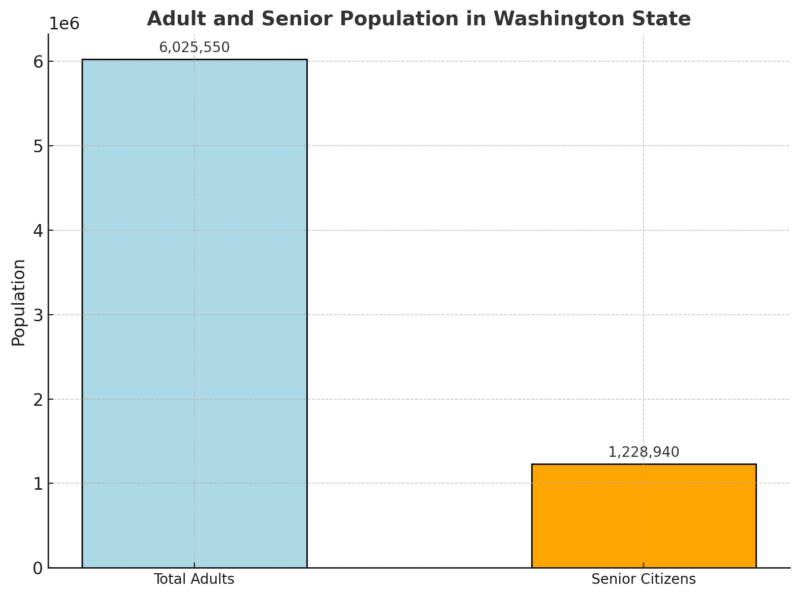
Out of the total population, over 6 million are adults, with more than 1.2 million seniors.
This aging demographic calls for increased healthcare, retirement planning, and senior-specific resources to accommodate the growing number of elderly residents.
Population Density
Category
Value
Total Area
71,299 square miles
Population Density
113 people/sq mi
With a population density of 113 people per square mile, Washington ranks as the 25th most densely populated state.
Despite its large population, much of the state remains rural or lightly populated, as the urban areas—like Seattle and the surrounding metropolitan region—house the majority of residents.
Urban and Metropolitan Areas
The Seattle-Tacoma-Bellevue metropolitan area is the state’s most populated region, with over 4 million residents.
This region, which includes cities such as Tacoma, Kent, Bellevue, and Everett, accounts for more than half of Washington’s population.
Seattle itself has approximately 770,000 residents and a population density of over 8,000 people per square mile.
Housing Market Evolution
Metric
Value
Change (YoY)
Median Sale Price
$649,600
+8.2%
Top Metro Growth
Redmond, WA
+40.8%
The median sale price of homes in Washington rose to $649,600, marking an 8.2% year-over-year increase according to Redfin – underscoring the state’s growing appeal and its role in a U.S. population exceeding 346 million.
This rise highlights a strong seller’s market, driven by sustained demand and limited affordability.
Redmond, WA, led the state with a staggering 40.8% increase in sales prices, reflecting the impact of high demand in tech-driven regions.
underscoring the state’s growing appeal and its role in a U.S. population exceeding 330 million
Housing Demand
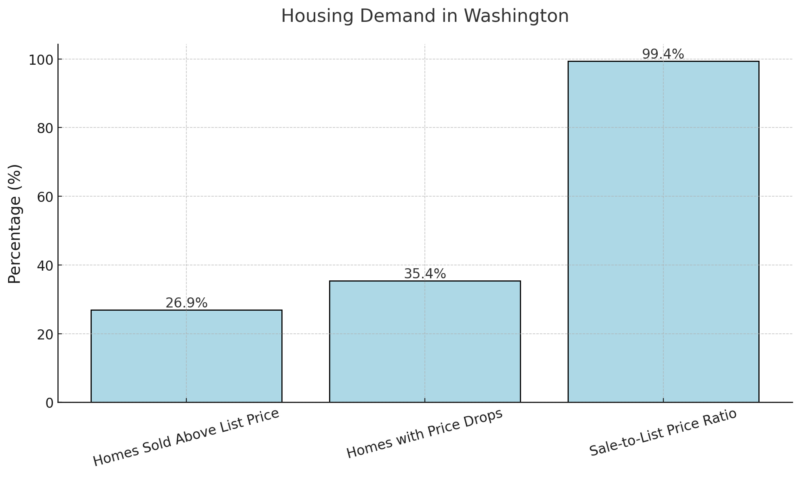
Despite the price growth, demand is slightly moderating, with 26.9% of homes selling above list price, a slight decrease compared to last year.
The sale-to-list price ratio remains robust at 99.4%, signaling competitive offers, though slightly fewer buyers are bidding above asking prices.
Housing Supply
Metric
Value
Change (YoY)
Homes for Sale
27,422
+21.5%
Newly Listed Homes
8,361
+20.0%
Months of Supply
2
No change
The number of homes for sale increased by 21.5% year-over-year to 27,422.
This boost in supply is helping to balance the market slightly, though inventory remains tight with just 2 months of supply.
Newly listed homes are also up by 20%, providing more options for buyers, yet the market remains competitive.
Top 10 Metros with the Fastest-Growing Sales Prices
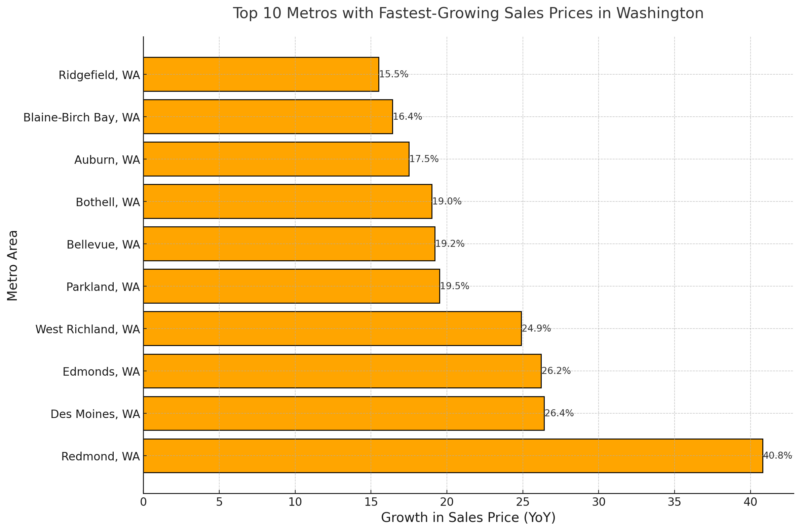
Tech hubs like Redmond and Bellevue dominate the list of cities with the fastest-growing home prices, driven by high-income job growth and limited housing inventory.
Suburban areas like Des Moines, Edmonds, and Parkland also see rapid price appreciation, reflecting a growing interest in suburban living.
Market Insights
- Price Growth: With an 8.2% year-over-year increase, Washington’s housing market remains expensive, but the higher inventory is providing some relief for buyers.
- Increased Supply: A 21.5% rise in available homes indicates that more sellers are entering the market, potentially helping to moderate price growth in the future.
- Slight Demand Decline: Indicators like homes sold above list price and fewer bidding wars suggest a marginal cooling of demand.
- Metro-Specific Growth: Regions like Redmond and Bellevue show how local economies, particularly tech-driven ones, impact housing dynamics.
Washington State Unemployment and Job Market Overview: October 2024
County unemployment rates and employment data for October 2024 are now available on ESD’s website.https://t.co/0TP28lc7YQ pic.twitter.com/NVZ5fhPFSZ
— Washington State ESD (@ESDwaWorks) November 22, 2024
In October 2024, Washington’s unemployment rate dipped slightly to 4.7%, despite the state losing an estimated 35,900 jobs (seasonally adjusted) according to Washington states governement.
This notable drop in employment numbers is primarily attributed to the now-resolved Boeing machinists’ strike, which led to a temporary reduction of 31,000 aerospace jobs.
Key Unemployment and Employment Trends
Metric
Value
Change
Unemployment Rate (October 2024)
4.7%
-0.1 pts (from Sept.)
Jobs Lost
35,900
Unusually High
Jobs Lost in Aerospace
31,000
Strike-Related Impact
Unemployment Rate (October 2023)
3.8%
+0.9 pts YoY
The unemployment rate has remained relatively stable, ranging between 4.7% and 4.9% since March 2024.
However, it is significantly higher than the 3.8% rate in October 2023, signaling a broader cooling of the job market compared to last year.
Sector Analysis: Job Losses and Gains
Industry
Jobs Lost/Gained
Aerospace
-31,000
Manufacturing
Declined
Leisure and Hospitality
Declined
Other Services
Declined
Government
Growth
Education and Health Services
Growth
Information
Growth
The largest job losses occurred in manufacturing, leisure and hospitality, and other services, reflecting short-term disruptions and a softening in consumer-driven sectors. Meanwhile, government, education and health services, and information saw modest employment growth, providing some balance to the overall numbers.
Unemployment Claims
Metric
Value
Change
People Receiving Benefits
57,057
+3,143 MoM
The number of unemployment benefit claims rose by 3,143 compared to the previous month, with increases primarily seen in manufacturing and construction. These figures reflect the ripple effects of job losses in key sectors.
Revised Data for September 2024

Washington’s preliminary September 2024 data, which initially showed a loss of 2,000 jobs, was revised to reflect a larger loss of 2,800 jobs.
The seasonally adjusted unemployment rate for September remained unchanged at 4.8%.
Analysis and Outlook
October’s employment numbers highlight the temporary impact of the Boeing machinists’ strike, which significantly skewed the data.
Despite this, the unemployment rate dipped slightly, suggesting underlying resilience in the broader job market.
Growth in sectors such as government and education indicates ongoing demand for essential services, though persistent job losses in manufacturing and leisure industries underscore vulnerabilities.
The unemployment rate remaining steady around 4.7% to 4.9% signals a relatively stable labor market, but the year-over-year increase from 3.8% to 4.7% reflects challenges in regaining pre-2024 economic momentum.
As aerospace and related industries stabilize post-strike, employment numbers are expected to improve, potentially easing pressure on the unemployment rate in the coming months.
Washington Counties Population 2025
County
Population
Growth Rate (%)
Area (sq mi)
Density (per sq mi)
King County
2,277,449
0.14%
817
1,076
Pierce County
930,913
0.79%
644
558
Snohomish County
849,070
2.31%
806
407
Spokane County
553,170
2.22%
681
314
Clark County
525,563
4.00%
242
837
Thurston County
299,367
1.14%
279
414
Kitsap County
277,503
0.61%
152
703
Yakima County
256,267
-0.18%
1,700
60
Whatcom County
233,240
2.55%
814
111
Benton County
217,609
4.91%
656
128
Skagit County
131,512
1.24%
668
76
Cowlitz County
113,664
2.39%
440
100
Grant County
103,776
4.36%
1,000
39
Franklin County
99,486
2.40%
479
80
Lewis County
86,951
5.33%
928
36
Island County
85,852
-1.32%
80
413
Chelan County
79,956
0.91%
1,100
27
Clallam County
77,548
0.23%
671
45
Grays Harbor County
77,539
2.22%
734
41
Mason County
68,607
3.90%
371
71
Walla Walla County
61,283
-2.14%
490
48
Stevens County
49,391
6.01%
956
20
Whitman County
48,445
1.33%
833
22
Kittitas County
45,894
2.90%
887
20
Douglas County
45,373
5.45%
702
25
Okanogan County
43,964
4.33%
2,000
8
Jefferson County
33,858
2.41%
696
19
Pacific County
24,305
3.45%
360
26
Klickitat County
23,875
4.65%
723
13
Asotin County
22,562
1.07%
245
35
Adams County
20,742
0.66%
743
11
San Juan County
18,460
3.56%
67
106
Pend Oreille County
14,584
8.01%
540
10
Skamania County
12,825
6.51%
640
8
Lincoln County
11,863
8.56%
892
5
Ferry County
7,526
4.56%
850
3
Wahkiakum County
4,842
8.86%
102
18
Columbia County
4,080
3.32%
335
5
Garfield County
2,369
3.27%
274
3
Washington state is home to 39 counties, with King County being the most populous as of 2019 according to WPR.
King County, which includes Seattle, has a population of 2,188,649, reflecting a growth of 12.97% since the 2010 census.
Following King County are Pierce County (876,764), Snohomish County (801,633), and Spokane County (506,152), which are the only counties with populations exceeding 500,000.
These counties have all seen significant growth, ranging from 7% to nearly 13% since 2010.
Least Populated Counties in Washington
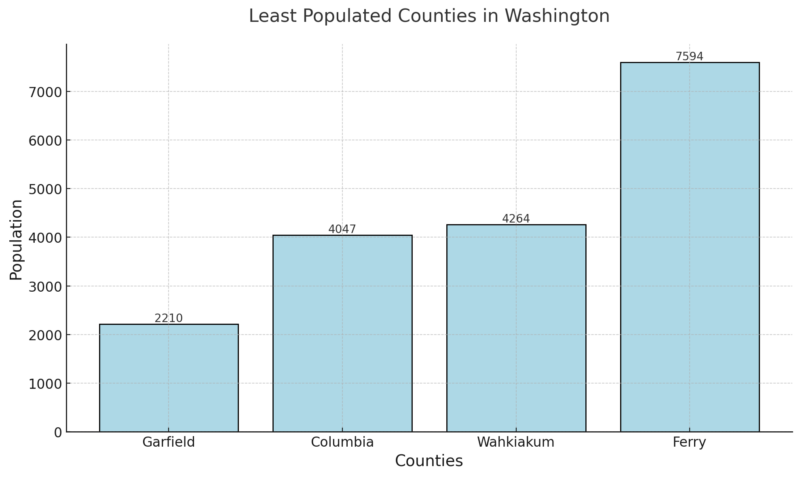
The county with the smallest population in Washington is Garfield County, with 2,210 residents, marking a 2.26% decline since the 2010 census.
Other sparsely populated counties include Columbia County (4,047), Wahkiakum County (4,264), and Ferry County (7,594).
These are the only counties with fewer than 10,000 residents, and three of them have experienced population declines since 2010.
Notably, Wahkiakum County’s population grew by 7.05%, bucking the trend among less populated counties.
Counties with the Fastest Growth
Franklin County leads Washington in population growth since the last census, increasing by 16.48% to a population of 92,125.
Other counties with growth rates exceeding 12% include King County (12.97%), Kittitas County (12.74%), Benton County (12.30%), and Snohomish County (12.05%).
Meanwhile, Garfield County recorded the most significant population decline, shrinking by 2.26%.
Educational Attainment
Category
Washington (%)
United States (%)
Washington (Count)
Difference from U.S. (%)
Post-Secondary Degree
43.3%
38.5%
2.08M
+12.6%
High School Diploma
47.2%
48.5%
2.27M
-2.6%
No High School Diploma
9.4%
13.0%
452K
-27.7%
- Washington has a higher percentage of residents with post-secondary degrees (43.3%) compared to the national average of 38.5%.
- A slightly lower proportion of residents hold only a high school diploma (47.2%) compared to the national average (48.5%).
- The state has significantly fewer residents without a high school diploma (9.4%) than the national average (13.0%), reflecting better access to secondary education.
Detailed Educational Attainment
Degree Type
Washington (%)
United States (%)
Washington (Count)
Difference from U.S. (%)
Doctorate
1.5%
1.34%
70.8K
+10.0%
Professional Degree
2.1%
2.00%
100K
+4.5%
Master’s Degree
8.7%
8.17%
419K
+6.8%
Bachelor’s Degree
21.3%
18.8%
1.02M
+13.1%
Associate’s Degree
9.8%
8.18%
470K
+19.6%
Some College, No Degree
24.3%
21.0%
1.17M
+16.1%
High School Diploma
22.9%
27.5%
1.10M
-16.7%
Some High School
5.5%
7.44%
263K
-26.3%
Less than High School
2.8%
4.15%
134K
-32.7%
Washington residents have higher levels of advanced education across the board, including doctorates, professional degrees, master’s degrees, and bachelor’s degrees.
Bachelor’s degrees (21.3%) and associate’s degrees (9.8%) are particularly prominent in the state compared to national averages.
A lower percentage of residents hold only high school diplomas or less than the national average, indicating a more educated population overall.
Healthcare Services
Health Insurance Coverage Type (2022)
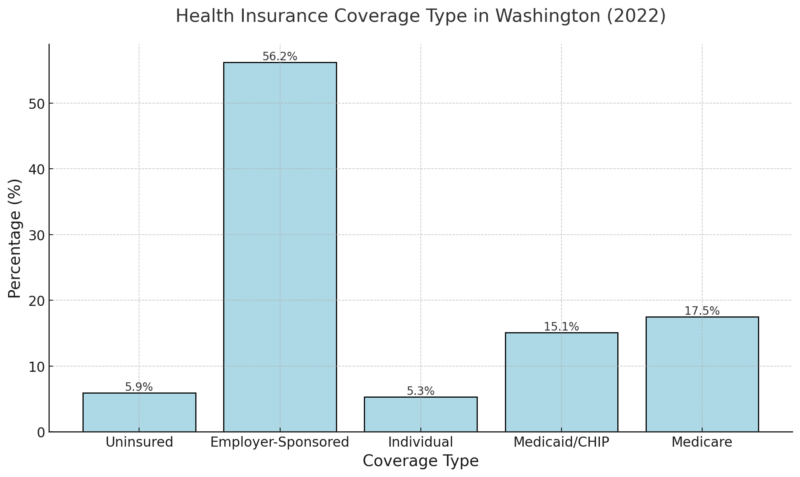
Employer-sponsored insurance remains the most common type of coverage in Washington, covering 56.20% of the population.
The uninsured rate of 5.90% reflects relatively broad insurance access, though some gaps remain.
SHADAC notes that public insurance programs like Medicaid/CHIP (15.10%) and Medicare (17.50%) cover a significant portion of the population, ensuring safety nets for vulnerable groups.
Cost of Care
Metric
Washington
United States
Medicaid Expenses as a Percent of State Budgets
25.30%
28.90%
Per Person State Public Health Funding
$89
N/A
Average Annual Employer-Sponsored Insurance Premium (Single)
$7,170
$7,590
Average Annual Employer-Sponsored Insurance Deductible (Single)
$1,949
$1,992
- Washington’s Medicaid expenses (25.30%) are slightly below the national average, suggesting a controlled allocation of resources.
- Public health funding per person is $89, indicating room for improvement in statewide public health investments.
- The average employer-sponsored insurance premium ($7,170) and deductible ($1,949)** are both lower than national averages, reflecting slightly better affordability for workers.
Health Care Access & Utilization
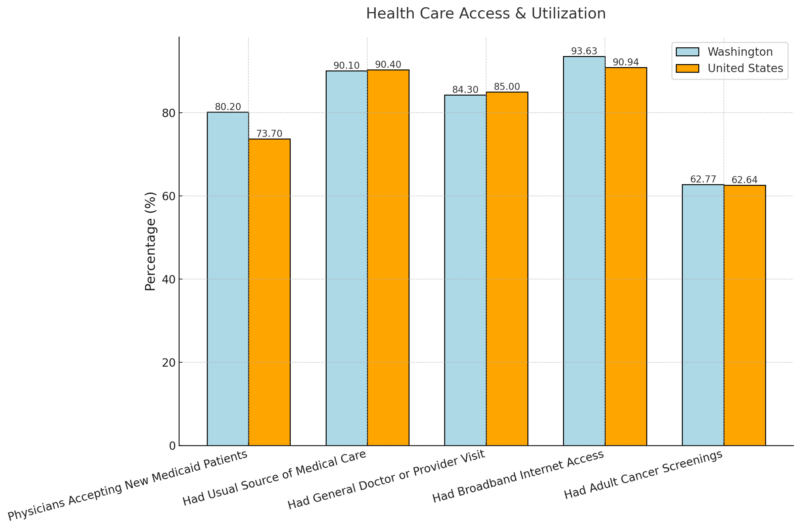
- 80.20% of physicians in Washington accept new Medicaid patients, significantly higher than the national average of 73.70%, enhancing access for low-income residents.
- Broadband internet access (93.63%) is well above the national rate, which facilitates telemedicine and online healthcare resources.
- Cancer screening rates and visits to general doctors are consistent with national averages.
Health Behaviors & Outcomes
Metric
Washington (%)
United States (%)
Adults with Fair or Poor Health Status
11.11%
13.48%
Chronic Disease Prevalence
23.44%
25.31%
Adult Smoking Rates
10.01%
12.88%
Opioid-Related Deaths per 100,000 People
28.1
32.4
Alcohol-Involved Deaths per 100,000 People
19.9
14.4
Washington residents report better health outcomes than the national average, with fewer adults experiencing fair or poor health (11.11% vs. 13.48%) and lower rates of chronic disease prevalence.
Smoking rates are also lower, at 10.01%, compared to 12.88% nationally.
While opioid-related deaths are below the national average, alcohol-involved deaths (19.9 per 100,000) exceed the national rate, indicating an area for targeted intervention.
Affordability of Care
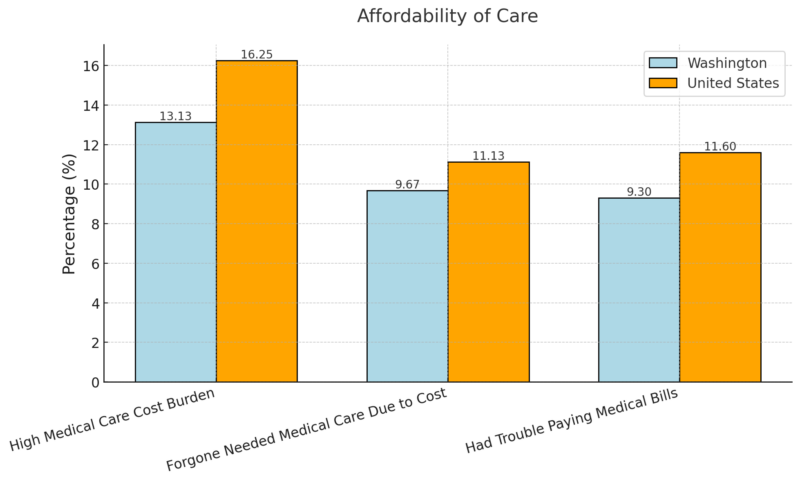
Out-of-pocket medical expenses are slightly higher in Washington ($1,800) compared to the national median, but fewer residents face high medical care cost burdens (13.13%) than the U.S. average.
Fewer Washingtonians forgo medical care (9.67%) or experience trouble paying bills (9.30%) due to costs, reflecting better overall affordability of care.
Methodology
This article synthesizes data from authoritative sources, including state reports, federal statistics, and third-party analyses, to provide a comprehensive overview.
We analyzed population, housing, employment, education, and health metrics to identify trends and key insights.
Data comparisons were made between Washington and national averages to contextualize findings.
Visual breakdowns and tables were used to highlight relevant figures for clarity.
All interpretations are grounded in verifiable statistics to ensure accuracy and reliability.
References
- Office of Financial Management – Washington State Tops 8 Million Residents in 2024
- World Population Review – Washington Population
- Redfin – Washington Housing Market
- Employment Security Department – October 2024 Monthly Employment Report
- SHADAC – Washington State Health Coverage
- World Population Review – Washington Counties Population
Related Posts:
- How Dallas' Population Boom Is Changing the…
- How Washington DC’s Population Has Evolved Over the…
- New Mexico Population 2025 - Key Insights and Stats
- North Carolina Population 2025 - Key Stats And Insights
- Indiana’s Population in 2025 Key Stats and Insights
- Missouri’s Population in 2025 - Key Stats and Insights


