Minnesota population dynamics as of 2024 reveal intriguing insights into the demographic changes within the state.
Situated as the 12th largest state by area, Minnesota ranks 21st in population among U.S. states.
As of 2024, the state’s population has grown to approximately 5,761,530, showcasing a steady increase from previous years according to World Population Review.
The key driver of Minnesota population growth includes net migration alongside natural birth rates, contributing to a 1.0% increase between 2021 and 2022.
This trend indicates a rise of over 59,000 residents, reflecting the state’s appeal to both domestic and international migrants. Meanwhile, projections suggest significant growth in the 65+ age group in the future.
Key Takeaways
Total Population and Growth

From 2010 to 2022, the state grew by an average of 0.6% annually. The largest increase during this period occurred between 2019 and 2020, with a 1.2% rise. Factors contributing to this growth include both natural changes (births minus deaths) and migration patterns.
In 2022, the most populous counties, such as Hennepin and Ramsey, remained significant in numbers. The growth rate has not been uniform across all areas, with urban sectors like Minneapolis drawing larger populations compared to rural counterparts. Understanding these variations is crucial for resource planning and policy formulation.
Projected Growth Rates
Looking toward the future, Minnesota’s population is expected to continue growing but at a slower rate. By 2075, the population will increase from 5.76 million in 2024 to 6.11 million as per Brainerd Dispatch. Net migration is forecasted to be crucial in supporting this growth as natural change turns negative by 2065, meaning deaths will surpass births.
The projection underscores the importance of immigration and other demographic factors in ensuring sustained growth. Efforts to attract and retain residents may become increasingly vital, particularly in regions experiencing slower growth rates.
Demographic Breakdown
Age
Metric
Value
Age
39
Median Age
About the same as the U.S.: 39
Age Group 70-79
8%, similar to U.S. rate of 8%
The median age of the population is 39, which is consistent with the national median age in the United States. The proportion of individuals aged 70-79 is also similar to the national rate at 8% according to a census reporter.
Population by Age Range
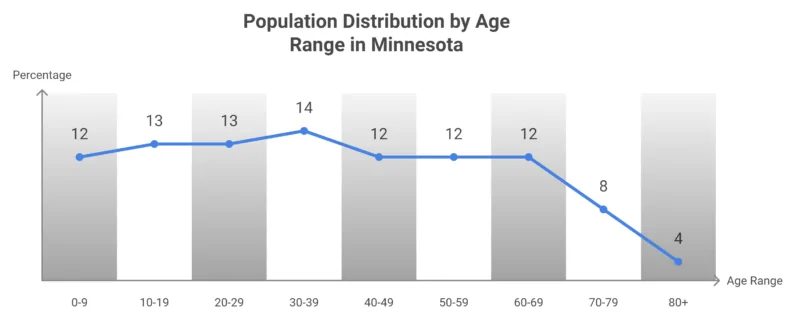
The population is distributed across age groups with relatively balanced percentages, except for a smaller proportion in the 80+ age category. Age ranges 30-39 represent the largest share at 14%, while the oldest group, 80+, makes up just 4% of the population.
Population by Age Category
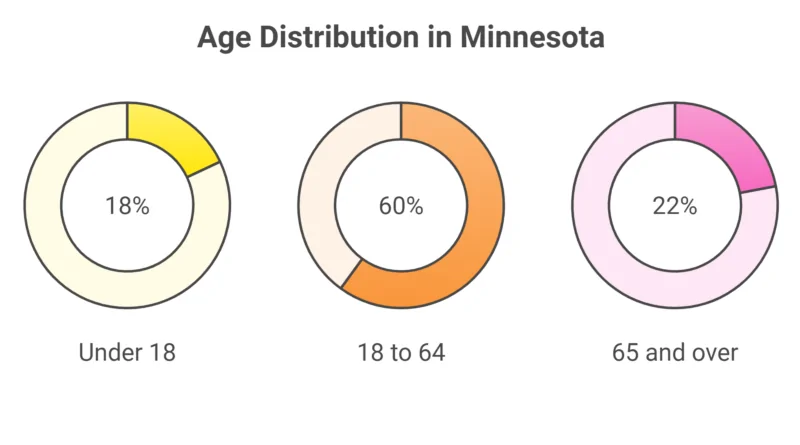
The majority of the population (60%) falls into the working-age group of 18 to 64 years old. Children (under 18) make up 18%, while seniors aged 65 and over account for 22%.
Sex Distribution
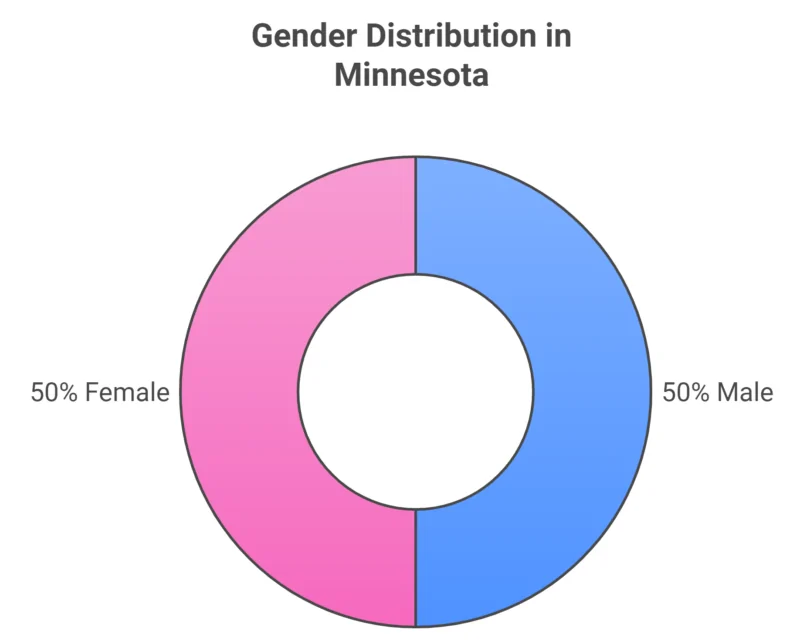
The population is evenly split by gender, with both males and females each comprising 50% of the total population.
Race & Ethnicity
Race & Ethnicity
Percentage
White
76%
Black
7%
Native
1%
Asian
5%
Islander
0%
Other
1%
Two or More Races
5%
Hispanic
6%
The majority of the population is White (76%), with smaller percentages for Black (7%), Asian (5%), and Hispanic (6%). Other racial groups, including Native, Islander, and those identifying as more than one race, make up a smaller share of the total population.
Note that “Hispanic” includes respondents of any race, whereas other categories represent non-Hispanic individuals.
Crime Report Overview
Crime Metric
2023 Data
Change from 2022 (%)
Violent Crime (Statewide)
Decreased
-6.9%
Violent Crime (Twin Cities Metro Area)
Decreased
-8.2%
Violent Crime (Greater Minnesota)
Decreased
-3.4%
Murders
181 (69.6% involving firearms)
Almost unchanged (-1 case)
Aggravated Assaults
9,986
-3.4%
Rapes
2,053 (72.6% occurred in homes)
-11.85%
Motor Vehicle Thefts
15,612
-6.8%
Carjackings
372
-37.8%
Larceny Incidents
72,701 (Lowest in 55 years)
Not specified
Bias Crimes
180 incidents
Increased
Use-of-Force Incidents (Firearm Discharge)
16
-2 incidents
Assaults on Peace Officers
961
+0.9%
- KTTC news report that In 2023, Minnesota saw a significant 6.9% drop in violent crime. In the Twin Cities Metro Area, violent crime decreased more sharply by 8.2%, while greater Minnesota saw a 3.4% decrease.
- The number of murders remained nearly constant, with 181 murders compared to 182 in 2022, and 69.6% involved firearms. Aggravated assaults also fell by 3.4%, while rapes saw a notable decline of 11.85%, most often occurring in homes.
- Motor vehicle theft decreased by 6.8%, with 15,612 vehicles stolen. Carjackings saw a larger drop of 37.8%, from 598 incidents in 2022 to 372 in 2023.
- Larceny incidents reached their lowest in 55 years at 72,7
Geographical Population Distribution

Minnesota’s population distribution varies significantly between urban and rural areas, with urban centers experiencing higher concentrations. County-level analysis reveals Hennepin and Ramsey as the most populated, reflecting dense settlement patterns.
Urban vs. Rural Residency
Minnesota features a prominent divide between urban and rural residency. Urban areas, such as Minneapolis—home to approximately 410,939 people—highlight this trend. Cities like Saint Paul and Rochester also show significant population concentrations.
Rural regions, in contrast, experience lower densities but cover larger areas. The average density across Minnesota stands at 66.6 people per square mile, illustrating a varied distribution that heavily favors urban locales. This distinction underscores the tendency for economic activities and services to cluster in cities, influencing residency patterns.
Population by County
Population distribution in Minnesota varies across counties, with Hennepin and Ramsey leading in numbers. Hennepin County alone boasts 1,258,713 residents, positioning it as a core population hub. Meanwhile, Ramsey follows closely, indicating its status as a key urban area.
Smaller counties exhibit more dispersed patterns, often tied to agricultural and resource-based economies. This disparity underscores regional economic roles in shaping demographic trends. The differences across counties reflect localized factors, including employment opportunities and access to amenities, which drive residency choices.
Rank
County
Population
1
Hennepin County
1,258,713
2
Ramsey County
536,075
3
Dakota County
447,440
4
Anoka County
372,441
5
Washington County
278,936
6
St. Louis County
200,514
7
Olmsted County
164,784
8
Stearns County
160,977
9
Scott County
155,814
10
Wright County
151,150
11
Carver County
111,057
12
Sherburne County
102,206
13
Blue Earth County
70,006
14
Crow Wing County
68,304
15
Rice County
67,948
16
Clay County
66,258
17
Otter Tail County
60,626
18
Chisago County
58,535
19
Winona County
49,721
20
Goodhue County
48,035
21
Beltrami County
46,718
22
Itasca County
45,365
23
Kandiyohi County
43,813
24
Isanti County
43,182
25
Benton County
41,600
26
Mower County
40,058
27
Douglas County
39,953
28
Steele County
37,421
29
Carlton County
36,825
30
McLeod County
36,785
31
Becker County
35,283
32
Morrison County
34,250
33
Nicollet County
34,242
34
Cass County
31,446
35
Freeborn County
30,515
36
Polk County
30,412
37
Pine County
30,197
38
Le Sueur County
29,255
39
Mille Lacs County
27,427
40
Todd County
25,667
41
Brown County
25,628
42
Lyon County
25,427
43
Meeker County
23,490
44
Hubbard County
22,132
45
Nobles County
21,727
46
Wabasha County
21,683
47
Fillmore County
21,522
48
Dodge County
21,088
49
Martin County
19,657
50
Waseca County
18,981
51
Houston County
18,582
52
Kanabec County
16,602
53
Aitkin County
16,102
54
Redwood County
15,288
55
Roseau County
15,252
56
Sibley County
15,084
57
Renville County
14,348
58
Wadena County
14,241
59
Faribault County
13,873
60
Pennington County
13,714
61
Chippewa County
12,172
62
Koochiching County
11,751
63
Pope County
11,400
64
Cottonwood County
11,319
65
Watonwan County
11,077
66
Lake County
10,855
67
Jackson County
9,919
68
Stevens County
9,728
69
Swift County
9,719
70
Rock County
9,551
71
Yellow Medicine County
9,467
72
Pipestone County
9,245
73
Marshall County
8,810
74
Clearwater County
8,644
75
Murray County
8,049
76
Lac qui Parle County
6,630
77
Norman County
6,329
78
Wilkin County
6,306
79
Grant County
6,139
80
Cook County
5,639
81
Lincoln County
5,521
82
Mahnomen County
5,280
83
Big Stone County
5,105
84
Kittson County
4,060
85
Red Lake County
3,911
86
Lake of the Woods County
3,778
87
Traverse County
3,136
This table lists Minnesota’s counties by population, from the most populous (Hennepin County) with over 1.25 million residents to the least populous (Traverse County) with around 3,136 residents. According to Demographics.com.
Households and Families
Five Largest Counties by Population in 2022
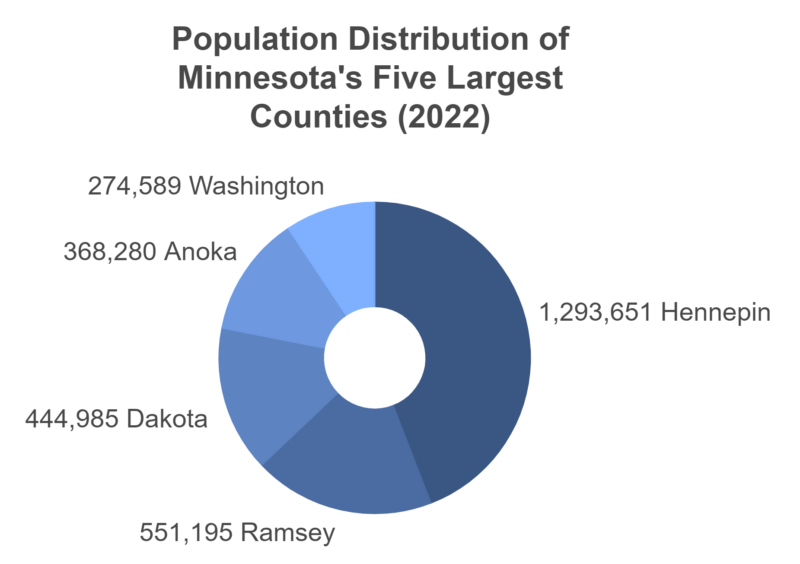
The largest county by population in 2022 was Hennepin County, with over 1.29 million residents. Ramsey and Dakota’s counties were the second and third largest, with populations exceeding 550,000 and 440,000 respectively. Anoka and Washington counties complete the top five according to mn.gov.
Fastest Growing Counties by Population (2021-2022)
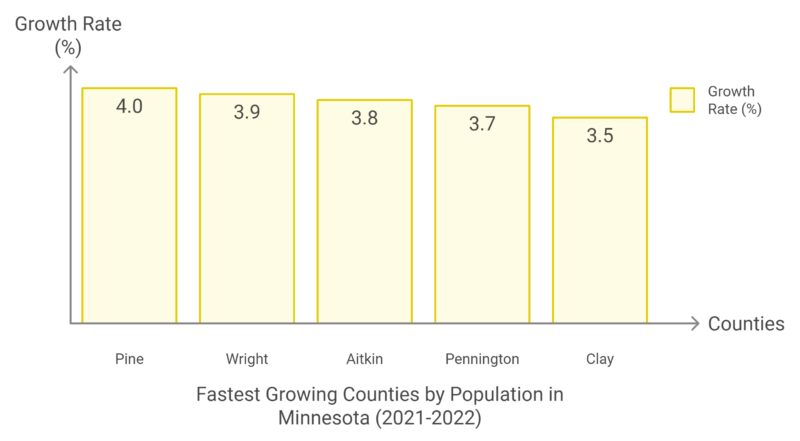
Pine County had the highest population growth rate between 2021 and 2022, growing by 4.0%. Other fast-growing counties include Wright, Aitkin, Pennington, and Clay, with growth rates ranging from 3.5% to 3.9%.
Counties with the Most Residents Added (2021-2022)
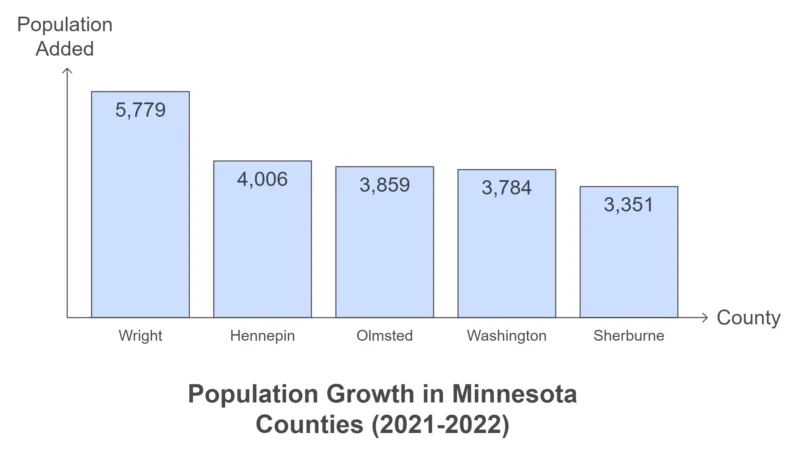
Wright County added the most residents between 2021 and 2022, with 5,779 new residents. Hennepin, Olmsted, Washington, and Sherburne counties also saw significant increases in population during this period.
Five Largest Cities in Minnesota by Population in 2022
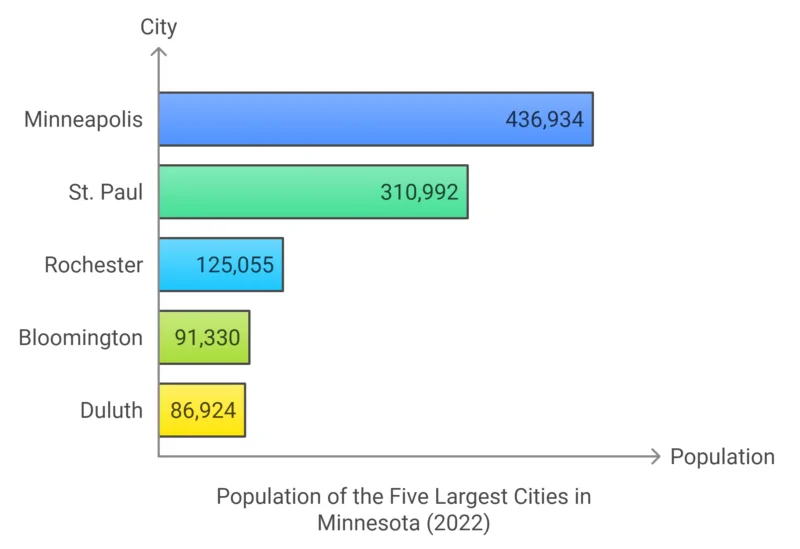
Minneapolis was the largest city in Minnesota in 2022, with a population of 436,934. St. Paul, the state’s capital, had a population of 310,992, followed by Rochester with 125,055 residents. Bloomington and Duluth complete the top five, with populations of 91,330 and 86,924 respectively.
Family dynamics in Minnesota illustrate a blend of traditional and modern arrangements. Social, economic, and cultural factors influence these structures, affecting interactions and responsibilities within the household. As observed in recent statistics, demographic changes impact family forms, including single-parent families and extended households.
There has been a shift towards diverse familial setups, influenced by rising mobility, changing marital trends, and evolving career paths. Economic factors such as housing costs and employment opportunities also play roles.
The state’s demographic center continues to monitor these dynamics to ensure that services and policies align with the needs of all family types, focusing on inclusivity and support for different household units.
Educational Attainment
Educational attainment in Minnesota highlights varying levels achieved across different demographic groups. This includes detailed statistics on the levels of education completed by the population and significant data concerning educational institutions within the state.
Levels of Education Completed
In Minnesota, the educational attainment rate for individuals aged 25 to 44 is 63%. This includes 6.7% certificate holders and 56.5% with associate or higher degrees. Disparities exist among different ethnic groups.
For instance, American Indian Minnesotans have a completion rate of 28.8%, while Hispanic and Black Minnesotans are at 35.5% and 40.5% respectively. Comparatively, high school completion rates across the U.S. have shown an increase for all racial groups from 2012 to 2022.
For the Black population, high school completion rose from 85% to 90.1%, and for the Hispanic population, it climbed from 65% to 75.2%. These statistics underscore the need for targeted educational support within underrepresented communities.
Educational Institutions Statistics
.@MnDeptEd staff joined @ISD15 High School in celebrating its first cohort of Bilingual Seals awardees. Congratulations to the students for their work to maintain, sustain and further develop their language skills. Learn more about Bilingual Seals at https://t.co/yEYARjuOjs pic.twitter.com/eFmhbh4bzl
— Minnesota Department of Education (@MnDeptEd) October 1, 2024
Minnesota boasts various educational institutions contributing to its high attainment rates. The role of these institutions is pivotal in enhancing access to higher education. Many initiatives focus on increasing graduation rates and ensuring diverse educational offerings.
The Minnesota Office of Higher Education collaborates with the state demographic center to generate reports and baselines essential for future planning. These collaborative efforts aim to create strategic planning pathways to address gaps in educational access and availability.
Emphasis is placed on increasing participation in post-secondary education, particularly for minority groups, to foster a more equitable education landscape. As educational attainment continues to evolve, these statistics provide an essential foundation for understanding educational progression in the state.
Economic Status

Minnesota’s economy reflects a diverse landscape shaped by employment, income levels, and poverty rates. The state’s economic health is evident in its relatively stable employment rates and rising income statistics, though challenges such as poverty remain.
Employment Rates – Labor Force Data (March-August 2024)
According to the U.S. Bureau of Labor Statistics, employment remains steady with some fluctuations due to economic conditions. While the demand for skilled workers continues, the aging population beginning to impact workforce availability poses challenges.
Increased investment in job training and education is crucial to maintaining this momentum and addressing gaps.
Civilian Labor Force
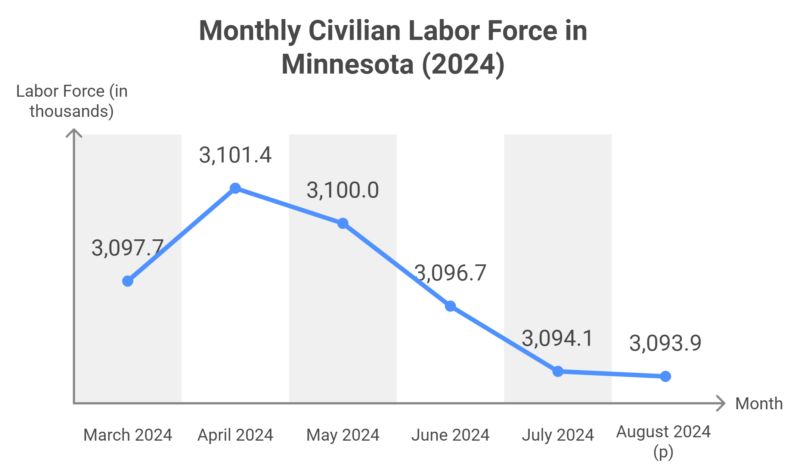
The civilian labor force in Minnesota slightly decreased from March 2024 to August 2024, with minor month-to-month changes.
Employment
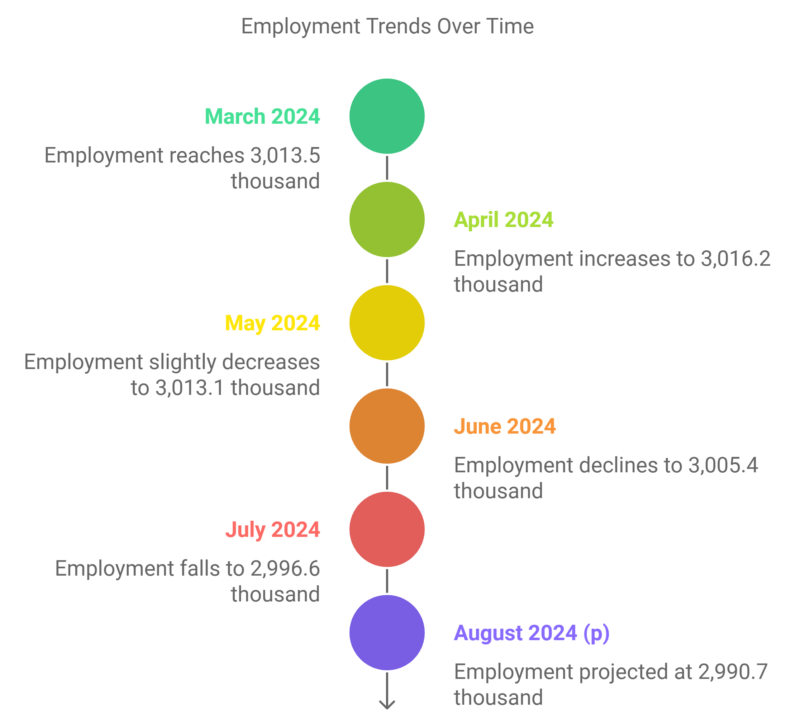
Employment has experienced a declining trend from March to August 2024, with a net loss of about 23,000 employed individuals.
Unemployment
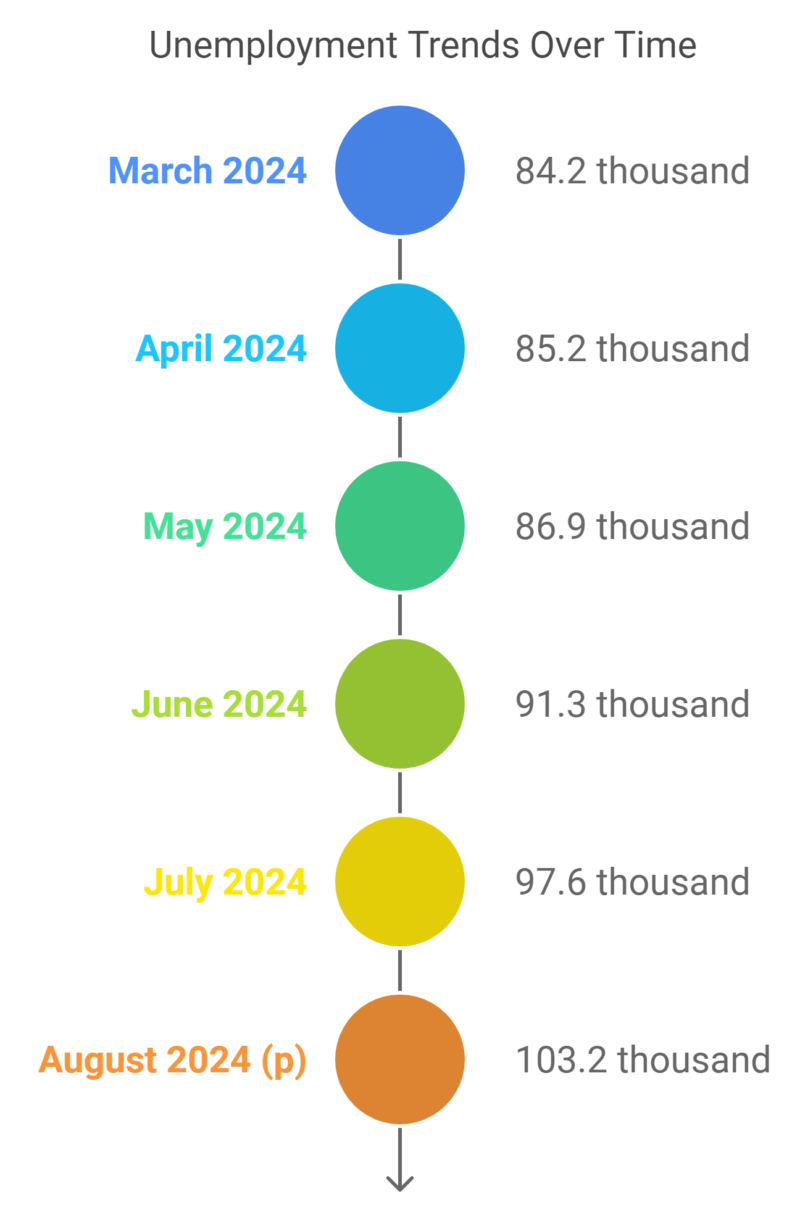
The unemployment count increased steadily from March to August 2024, reaching over 103,000 in August.
Unemployment Rate
Month
Rate (%)
March 2024
2.7
April 2024
2.7
May 2024
2.8
June 2024
2.9
July 2024
3.2
August 2024 (p)
3.3
The unemployment rate increased from 2.7% in March to 3.3% in August, indicating a gradual rise in the number of people unable to find work.
Nonfarm Wage and Salary Employment (March-August 2024)
Total Nonfarm Employment
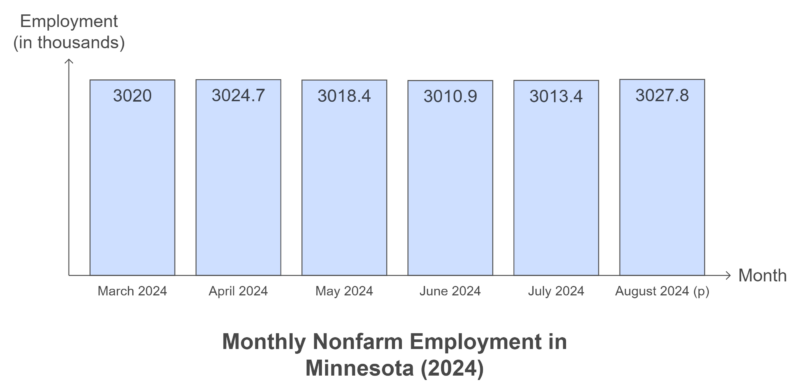
Total nonfarm employment remained fairly stable with minor fluctuations, showing a slight increase in August 2024 compared to earlier in the year.
12-Month Percentage Change (Total Nonfarm)
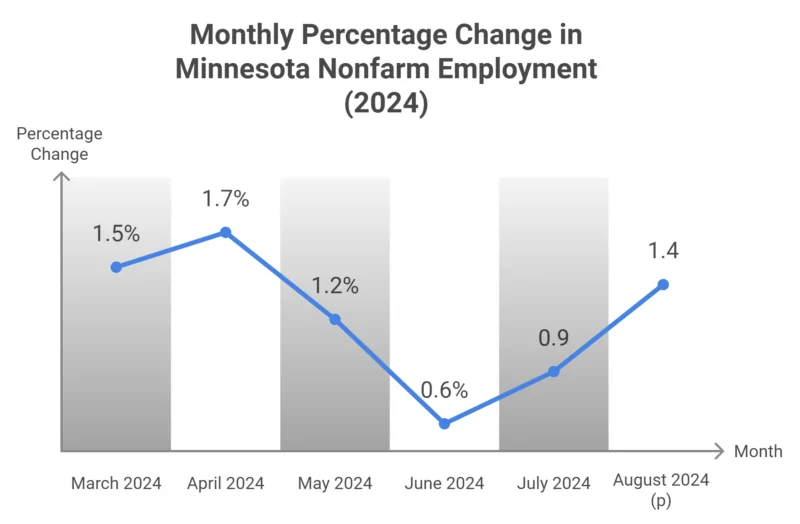
The 12-month change in total nonfarm employment varied throughout the year, reaching 1.4% in August.
Industry-Specific Data (March-August 2024)
Mining and Logging
Month
Employment (in thousands)
% Change (12-month)
March 2024
6.7
9.8
April 2024
6.6
1.5
May 2024
6.5
0.0
June 2024
6.6
0.0
July 2024
6.5
0.0
August 2024 (p)
6.4
-3.0
Employment in mining and logging decreased slightly from March to August, with a negative year-over-year change by August.
Construction
Month
Employment (in thousands)
% Change (12-month)
March 2024
133.9
-0.2
April 2024
135.2
1.0
May 2024
135.3
-0.5
June 2024
135.6
-0.9
July 2024
134.7
-1.1
August 2024 (p)
133.8
-1.5
The construction sector experienced fluctuating employment, with a slight decrease by August and a steady decline in year-over-year growth.
Manufacturing
Month
Employment (in thousands)
% Change (12-month)
March 2024
324.2
-0.8
April 2024
325.3
-0.4
May 2024
320.8
-1.6
June 2024
319.2
-2.3
July 2024
318.9
-2.0
August 2024 (p)
318.2
-2.3
Manufacturing employment showed a general decline from March through August, with the 12-month growth rate consistently negative.
Trade, Transportation, and Utilities
Month
Employment (in thousands)
% Change (12-month)
March 2024
536.2
0.9
April 2024
536.0
0.9
May 2024
534.0
0.5
June 2024
532.9
0.1
July 2024
532.6
0.2
August 2024 (p)
533.6
0.4
Employment in trade, transportation, and utilities remained relatively stable, with a slight improvement in the year-over-year change by August.
Information Sector
Month
Employment (in thousands)
% Change (12-month)
March 2024
42.7
-5.3
April 2024
42.3
-6.0
May 2024
42.5
-4.7
June 2024
42.3
-5.2
July 2024
41.6
-5.9
August 2024 (p)
42.0
-4.1
The information sector has seen declining employment figures with persistent negative 12-month changes, though there was a slight improvement by August.
Other Major Sectors

- Financial Activities: Employment fluctuated slightly, with a consistent negative year-over-year change.
- Professional & Business Services: Notable decline in employment across the months with significant negative year-over-year changes.
- Education & Health Services: Experienced continuous growth, both in absolute employment numbers and year-over-year change, reaching a 6.6% increase in August.
- Leisure & Hospitality: Employment saw a minor rise, with year-over-year changes generally positive, especially in August (2.4%).
- Other Services: Showed small increases in employment, with a steady 12-month improvement.
- Government: Employment remained steady with positive 12-month growth, peaking at 5.1% in August.
Income Statistics
Income levels in Minnesota have shown an upward trend in recent years, influenced by diverse economic drivers and industries. The median household income has exceeded national averages, highlighting the state’s economic vitality.
Reports from Minnesota’s State Demographic Center indicate increases in household incomes, notably among different cultural groups.
Median Household Income in Minnesota (in Current Dollars)
Source: Trading Economics (United States Federal Reserve’s Data)
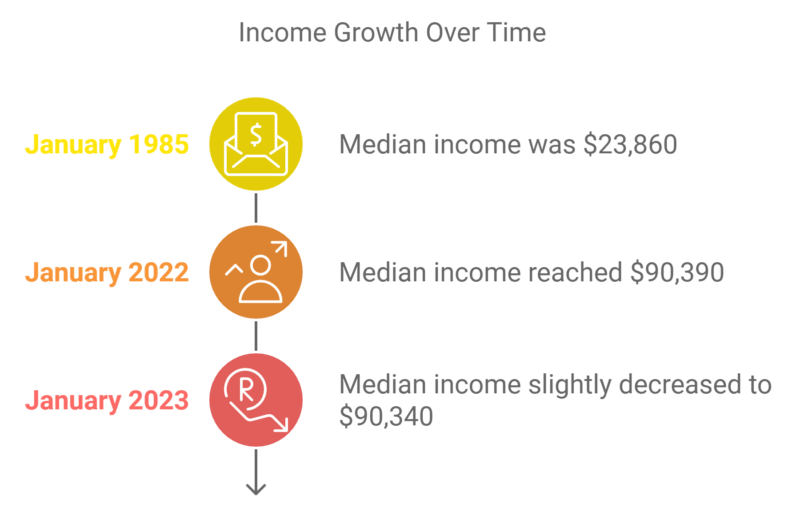
- The median household income in Minnesota was $90,340 in January 2023, slightly below the record high of $90,390 in January 2022.
- Over time, the median household income has increased significantly, rising from a historical low of $23,860 in January 1985 to the current levels in the past few years.
- This growth reflects economic changes over time, including inflation adjustments and changes in the economic landscape of the state.
The information provided is based on data from the United States Federal Reserve, with the latest update in October 2024. The median household income data can be explored further through historical charts, comparisons, and other indicators for additional context according to Trading Economics.
The Power of Poor and Low-Income Voters in Minnesota
Description
Data/Detail
Poor and Low-Income Eligible Voters
1.2 million, making up 27.3% of the electorate
Potential Impact
If these voters turned out at the same rate as higher-income voters, they could influence election outcomes nationwide.
There are 1.2 million poor and low-income eligible voters in Minnesota, representing over a quarter of the state’s electorate. Increasing voter turnout among this demographic could significantly impact elections across all levels of government as per poorpoeplecampaign.org.
Poverty
Description
Data
Population Living in Poverty (2018-2020)
1.7 million people, or 29.9% of the state population
Expanded Tax Credits in 2021
1.1 million children received Child Tax Credit; 288,000 workers received Earned Income Tax Credit
Pandemic Program Impact
The expiration of pandemic credits led to rising poverty
Minnesota Housing Market Overview
Metric
Value
Average Home Value
$336,954
1-Year Value Change
+1.1%
Days to Pending
19 days
For Sale Inventory
17,782 (August 31, 2024)
New Listings
6,915 (August 31, 2024)
Median Sale Price
$333,633 (July 31, 2024)
Median List Price
$354,967 (August 31, 2024)
Median Sale-to-List Ratio
1.000 (July 31, 2024)
Percent of Sales Over List Price
43.5% (July 31, 2024)
Percent of Sales Under List Price
35.8% (July 31, 2024)
- The average home value in Minnesota as of August 2024 is $336,954, which represents a 1.1% increase over the past year as per Zillow.com.
- Homes typically go pending in 19 days, indicating a relatively fast-moving market.
- The median list price was $354,967, whereas the median sale price was $333,633 as of July and August 2024.
- 43.5% of home sales were over the list price, indicating high demand, while 35.8% were below the list price.
Average Rent in Minnesota (October 2024)
Metric
Value
Average Rent
$1,291/month
Rent Increase (Last Year)
+1.1%
Average Price Increase
+$14
Rent Affordability Rank
20th least expensive in the U.S.
Available Rentals
33,648
A city with Lowest Rent
Walnut Grove, MN
Apartments.com notes that the average rent in Minnesota is $1,291 per month, which increased by 1.1% from the previous year. Minnesota ranks as the 20th least expensive state for renting, with 33,648 available rental units. Walnut Grove has the lowest rent in the state.
Average Rent by Apartment Type
Apartment Type
Average Rent ($/month)
Average Size (Sq Ft)
Studio
$1,093
474 Sq Ft
One Bedroom
$1,291
707 Sq Ft
Two Bedroom
$1,586
1,008 Sq Ft
Three Bedroom
$1,974
1,303 Sq Ft
The average rent varies depending on the size of the apartment. Studios rent for about $1,093 per month, while a one-bedroom apartment costs around $1,291 per month. The cost increases with size—two-bedroom apartments average $1,586, and three-bedroom units go for $1,974 per month.
Health and Wellbeing
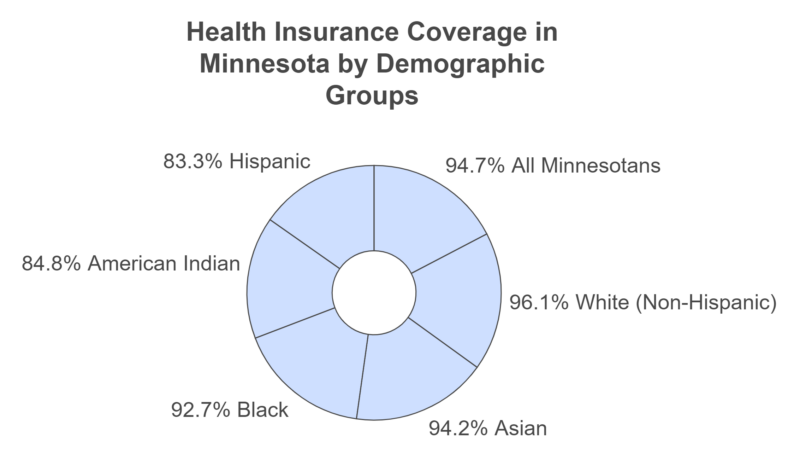
Minnesota has a high rate of health insurance coverage, with 94.7% of residents insured. However, disparities exist, with lower coverage rates among American Indian (84.8%) and Hispanic (83.3%) populations compared to White Minnesotans (96.1%). This gap impacts healthcare access and affordability for these communities. as per Family Wise Services.
Delayed Healthcare Due to Cost (2022)
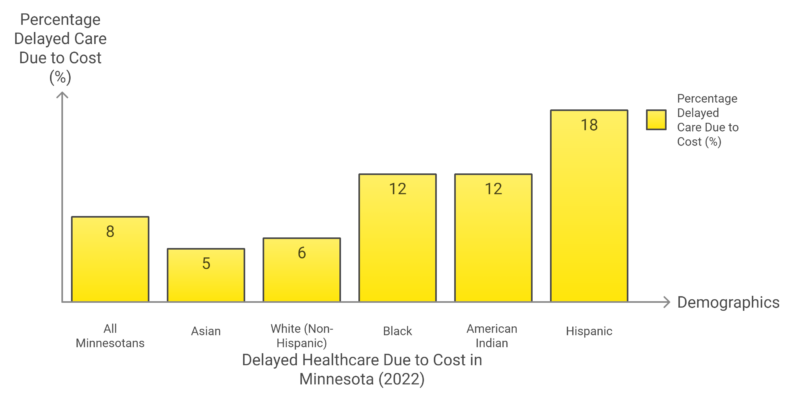
Cost is a significant barrier to healthcare, especially for Hispanics (18%), American Indians (12%), and Black Minnesotans (12%), who are more likely to delay seeing a doctor compared to the overall population (8%).
Legislative Changes in Healthcare (2023 Minnesota Legislative Session)
Policy Change
Impact
Continuous Coverage for Children
Medical Assistance ensures 12 months of coverage for nearly 600,000 kids
Foster Care Youth Coverage
Former foster youth from other states covered up to age 26
MinnesotaCare for Undocumented Immigrants
Undocumented immigrants eligible starting in 2025
Recent legislative actions aim to expand healthcare coverage, particularly benefiting children and vulnerable groups such as former foster youth and undocumented immigrants.
Mental Health Challenges in Minnesota
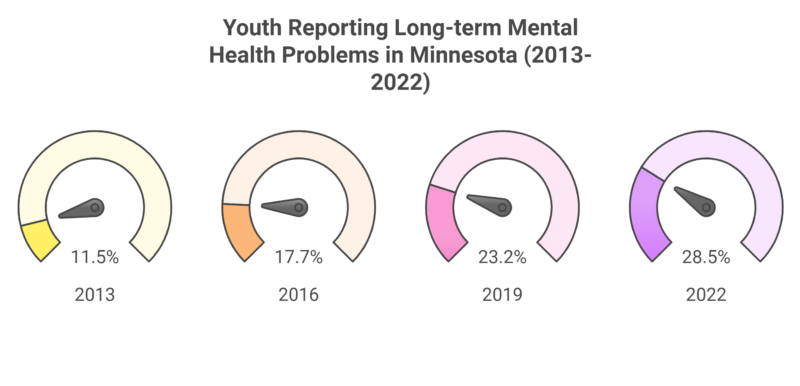
The percentage of youth experiencing long-term mental health problems in Minnesota has more than doubled over the past decade, reaching 28.5% in 2022. Access to mental health services is hindered by complex insurance processes, long waitlists, and insufficient reimbursement rates for providers, which limits service availability.
Childcare Affordability in Minnesota
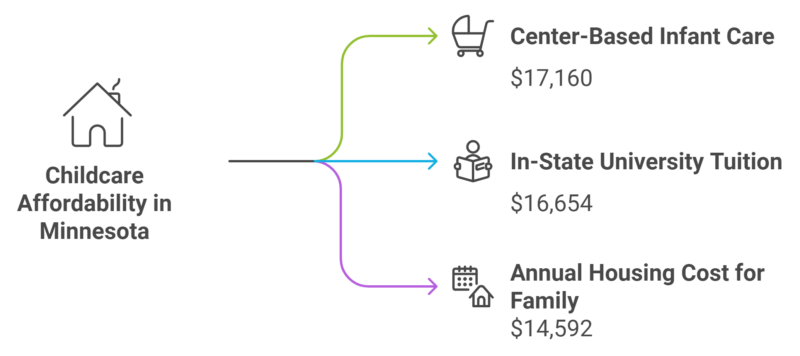
The annual cost of center-based infant care in Minnesota is $17,160, which is more expensive than in-state university tuition or the average cost of housing. There is also a shortage of nearly 100,000 childcare openings, and 94% of families cannot afford the ideal cost of care (less than 7% of income).
The Benefits Cliff in Minnesota
Issue
Description
Benefits Cliff
Earning a small raise can cause low-income families to lose eligibility for public assistance, preventing financial stability
Legislative Actions
25 states and D.C. have addressed this issue by extending recertification periods; Minnesota has not yet acted
The benefits cliff prevents low-income families from improving their financial situation, as minor income increases can lead to loss of assistance. Minnesota has yet to enact policies to mitigate this problem, unlike many other states.
Migration Patterns
Year/Period
Natural Growth (Births – Deaths)
Net Migration
Total Population Change
1957 (Peak of Natural Growth)
+57,400
-9,300
+48,100
2023
+13,800
+9,900
+23,700
1950-1960
High Positive Growth
Net Loss
Positive
1960-1970
High Positive Growth
Net Loss
Positive
1970-1980
High Positive Growth
Net Loss
Positive
1980-1990
High Positive Growth
Net Loss
Positive
1990-2000
Moderate Positive Growth
Net Gain
Positive
2000-2010
Moderate Positive Growth
Net Gain
Positive
2010-2020
Lower Positive Growth
Net Gain
Positive
Late 2040s (Projected)
Natural Decline
Net Gain
Positive (Migration-dependent)
Population growth in Minnesota has historically been influenced by natural growth (births minus deaths) and net migration (the difference between those moving in and out of the state). For much of the last 70 years, natural growth has been the major contributor to population growth.
In 1957, natural growth added 57,400 people to the state, while migration led to a net loss of 9,300 individuals. This pattern of natural growth exceeding migration losses continued up until the 1990s.
In the 1990s, international immigration began to accelerate, and net migration became a positive contributor to the state’s population growth. By 2023, 42% of Minnesota’s population growth was attributable to migration, adding 9,900 people, whereas natural growth added only 13,800.
As the population ages, Minnesota is expected to experience a natural decline by the late 2040s, meaning deaths will outnumber births, and the state’s growth will become solely reliant on migration.
View this post on Instagram
Population Growth Trends in Minnesota
Key Metrics
Trend/Observation
Natural Growth (Births-Deaths)
Historically dominant contributor until 1990s; currently declining
Net Migration
Negative up to 1990; positive post-1990, currently increasing in impact
2023 Population Growth
42% from migration; 58% from natural growth
Population Aging
The increasing elderly population leads to fewer births and more deaths
Future Projections
Natural decline by late 2040s, reliant on migration for growth
States Experiencing Natural Decline in 2023
19 U.S. states had more deaths than births; 8 states experienced a total population decline
In Minnesota, natural growth has historically been a significant contributor to population increase, outpacing migration consistently until the 1990s. Since the 1990s, net migration—aided by increased international immigration—began to have a greater positive effect on the state’s population growth.
As the population continues to age, natural growth is slowing. More Minnesotans are reaching ages beyond their childbearing years, leading to a reduction in the birth rate, while mortality rates are increasing due to a larger aging population. In 2023, 42% of the state’s population growth was driven by net migration, showing an increased reliance on new residents moving into the state as natural growth wanes.
Projections indicate that Minnesota will begin to experience a natural decline by the late 2040s, meaning the population will shrink unless migration offsets the deficit. This is consistent with broader national trends, where 19 U.S. states already experienced more deaths than births in 2023, and 8 of those saw an overall population decline.