Boston remains the largest city in Massachusetts and the economic center of New England. Boston has a projected population of 674,134 in 2026, following the latest official Census Bureau estimate of 672,973 residents in July 2025.
The 2026 figure comes from World Population Review. It is a projection rather than a completed federal count. The U.S. Census Bureau recorded 675,647 residents in the 2020 Census and now estimates that Boston remains 0.8% below its revised 2020 population base.
Boston lost residents during the first part of the decade, then recovered much of the decline. The city gained population in 2022, 2023 and 2024 before recording a small decrease in 2025. The projection for 2026 points to modest growth rather than another rapid expansion.
Population figures for Boston can differ sharply because the city, urban area, metropolitan area and combined statistical area use different boundaries. Boston proper has about 674,000 residents. The Census-defined metro contains roughly five million people. A narrower urban-agglomeration series places the total near 4.4 million.
Key Insights
- Projected Boston population in 2026: 674,134
- Latest official city estimate: 672,973 on July 1, 2025
- 2020 Census population: 675,647
- Change from the revised 2020 estimates base: -0.8%
- Land area: 48.34 square miles
- Population density: about 13,947 people per square mile
- Median household income: $97,344
- Poverty rate: 16.6%
- Foreign-born population: 27.8%
- Adults with a bachelor degree or higher: 54.9%
- Median listing price in May 2026: $889,000
Boston City and Greater Boston Are Not the Same in Terms of Population
The city of Boston covers 48.34 square miles of land. Cambridge, Somerville, Brookline, Quincy, Newton and other nearby communities belong to the same regional economy, but they are separate municipalities and are not included in Boston city population totals.
| Geography | Current Population Level | Area Covered |
|---|---|---|
| Boston city | 674,134 projected for 2026 | The municipal boundary of Boston |
| Boston urban agglomeration | About 4.4 million | The continuously developed urban area used by international datasets |
| Boston metropolitan area | Roughly 5 million | The regional labor market across eastern Massachusetts and parts of New Hampshire |
| Boston combined statistical area | More than 8 million | The broad commuting region extending farther through New England |
The 4.37 million figure frequently attached to Boston comes from an international urban-area series published by Macrotrends. It should not be presented as the current Census metropolitan population. A Boston Globe report on how Greater Boston compares with other U.S. metros also uses Census metro boundaries, which produce a larger total.
Boston Population Growth Since 2000
Boston had 589,141 residents in 2000 and 617,594 in 2010. The 2020 Census counted 675,647, giving the city its largest population since the middle of the 20th century.
The decade after 2010 added 58,053 residents. Housing construction, international immigration, college enrollment and growth in healthcare, technology and professional services all contributed. The Boston Planning Department examined that period in its report on Boston people and economy.
The pandemic disrupted the trend. Boston lost residents in 2020 and 2021 as students left campus, remote workers moved and international migration slowed. Recovery followed, but the 2025 estimate of 672,973 remained slightly below the official 2020 Census count.
| Year | Population | Status | Change From Previous Entry |
|---|---|---|---|
| 2000 | 589,141 | Census | — |
| 2010 | 617,594 | Census | +28,453 |
| 2020 | 675,647 | Census | +58,053 |
| 2023 | 667,453 | Annual estimate | Recovery after the early-decade decline |
| 2024 | 674,311 | Annual estimate | +6,858 |
| 2025 | 672,973 | Official annual estimate | -1,338 |
| 2026 | 674,134 | Projection | +1,161 |
Historical estimates sometimes differ because the Census Bureau revises its population base and methodology. A separate yearly series from Neilsberg illustrates those annual fluctuations. Census Vintage 2025 remains the preferred source for the latest official comparison.
This City Remains One of the Densest in U.S.
Boston had 13,976.7 residents per square mile at the 2020 Census. Applying the 2026 projection to the same land area produces a density near 13,946 people per square mile.
Density is calculated by dividing population by land area. The Census Bureau explains the limits of comparing places with different boundaries in its guide to population density. Boston looks compact because its municipal border excludes many close suburbs that would be inside the city limits in other parts of the country.
High density supports the MBTA, walkable commercial streets and short distances between major institutions. It also intensifies competition for apartments, road space, schools and public parks.
Who Lives in Boston in 2026?
The newest demographic percentages come from Census QuickFacts and the 2020-2024 American Community Survey. They describe the population before the 2026 projection, but they are the latest completed federal profile for age, sex, race, immigration, education and income.
Race and Ethnicity
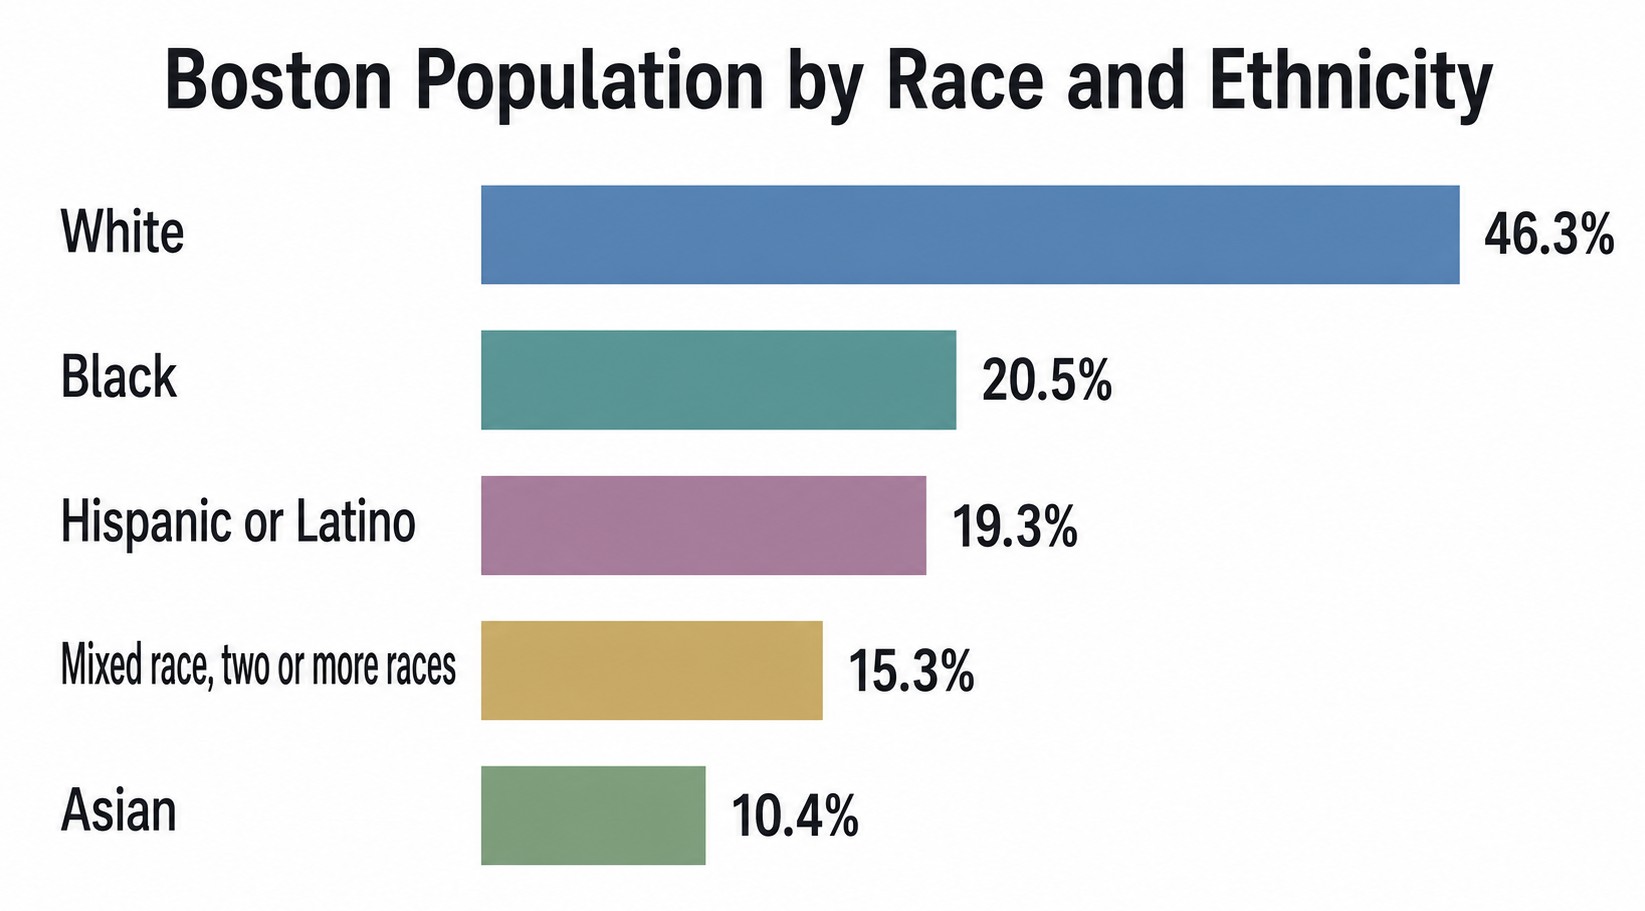
White residents account for 46.3% of the population, including Hispanic residents who identify as White. Black residents make up 20.5%, Asian residents 10.4%, and people reporting two or more races 15.3%. Hispanic or Latino residents account for 19.3% of Boston and may belong to any racial group.
| Race or Ethnicity | Share of Population |
|---|---|
| White alone | 46.3% |
| Black or African American alone | 20.5% |
| Two or more races | 15.3% |
| Asian alone | 10.4% |
| American Indian and Alaska Native alone | 0.3% |
| Native Hawaiian and Other Pacific Islander alone | 0.1% |
| Hispanic or Latino, any race | 19.3% |
| White alone, not Hispanic or Latino | 44.1% |
Immigration
Foreign-born residents make up 27.8% of Boston. Another 35.6% of residents age five or older speak a language other than English at home. Spanish is the most widely spoken language after English, followed by Haitian Creole and other French varieties, Chinese languages, Vietnamese and several African languages.
International migration has long offset domestic departures from Boston and the rest of Massachusetts. Earlier Census reporting covered the role of immigration when Suffolk and Middlesex counties recorded strong gains. The source is historical, but the basic pattern remains important. Boston depends on newcomers for workforce growth and population stability.
Boston Jewish Population
Boston has a long-established Jewish community, although estimates differ according to geographic boundaries and religious identification. The city itself contains tens of thousands of Jewish residents. The regional community extends through Brookline, Newton, Cambridge and other Greater Boston municipalities and is far larger than the city-only total.
Age, Sex and Household Structure
Boston has a median age of 33.3 years. Residents under 18 make up 15.1% of the population. People age 65 or older account for 13.0%. The remaining 71.9% are between 18 and 64.
The large student population pulls the median age downward. Boston institutions enrolled nearly 160,000 college and university students in the city, according to the Boston at a Glance report.
| Age Group | Share of Population |
|---|---|
| Under 18 | 15.1% |
| 18 to 64 | 71.9% |
| 65 and older | 13.0% |
Gender Distribution
Women account for 52.0% of Boston residents and men account for about 48.0%. The difference is small but consistent with the longer average life expectancy of women and the city age profile.
Households
Boston has 283,374 households and an average household size of 2.19 people. Only 35.7% of occupied homes are owner-occupied, leaving Boston with a much larger renter share than the national average.
Income Is High, but Poverty Remains Widespread
Boston has a median household income of $97,344 and per capita income of $61,698. The average household income is higher because a relatively small group of high earners pulls the mean upward. Median income gives a clearer picture of the household in the middle of the distribution.
The poverty rate is 16.6%. That means high wages in medicine, biotechnology, finance and software coexist with substantial hardship among service workers, students, single-parent households, older residents and people facing high housing costs.
| Income Measure | Latest Federal Figure |
|---|---|
| Median household income | $97,344 |
| Per capita income | $61,698 |
| Poverty rate | 16.6% |
| Residents under 65 without health insurance | 3.2% |
Data USA provides another view of Boston household income. Its figures may use a different survey year, so they should not be combined directly with the Census Vintage 2025 population estimate.
Education and Workforce
A post shared by Boston Public Schools (@bostonschools)
Boston remains one of the most highly educated large cities in the country. Among residents age 25 or older, 88.9% have completed high school and 54.9% hold a bachelor degree or higher.
The concentration of universities gives employers access to a large talent pool, but it does not guarantee that graduates remain in the region. High housing costs can push young workers elsewhere. The Massachusetts Department of Higher Education has examined the long-term gap between employer demand and college attainment.
Employment

The civilian labor-force participation rate is 69.9% among residents age 16 or older. Major employment centers include the Longwood Medical Area, downtown Boston, the Seaport, Back Bay and university campuses throughout the city.
The city Office of Workforce Development maintains current information on Boston labor-market conditions. Healthcare and social-assistance organizations reported more than $32.3 billion in revenue in the 2022 Economic Census, far above any other local service category listed in QuickFacts.
Job access is not equal. Boston requires certain contractors and city-supported projects to meet wage standards under the living wage and prevailing wage ordinance. The policy does not cover every private-sector worker, so housing and transport costs remain difficult for many lower-paid employees.
Housing and Real Estate in 2026
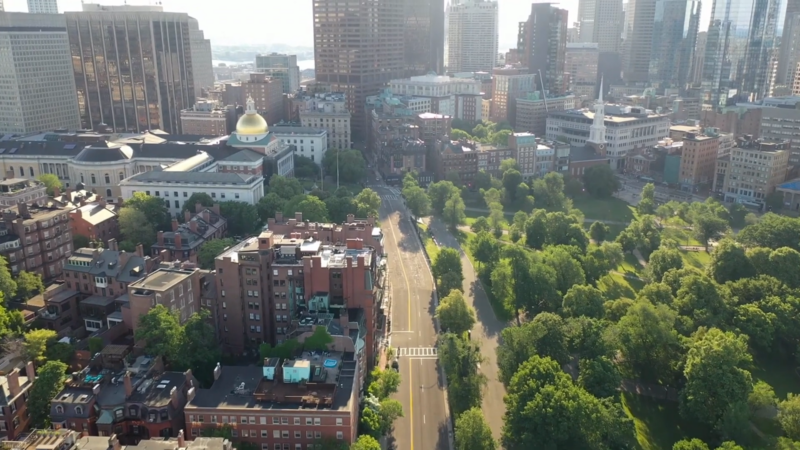
Housing is the clearest limit on Boston population growth. The Census Bureau reports a median owner-occupied home value of $731,700 and median gross rent of $2,147. Those figures cover the 2020-2024 survey period and include homes that were not recently sold or advertised.
Current market listings are more expensive. Realtor.com reported a median listing price of $889,000 in May 2026, down 2.31% from a year earlier. The median sale price was $830,000, and homes spent 29 days on the market.
| Housing Measure | May 2026 Figure | Annual Change |
|---|---|---|
| Median listing price | $889,000 | -2.31% |
| Median sale price | $830,000 | +3.88% |
| Median price per square foot | $873 | -2.24% |
| Active listings | 2,129 | +9.23% |
| Median days on market | 29 | No annual change |
| Median monthly rent | $3,400 | +3.03% |
Apartment trackers can produce different rent figures because they cover different property sets and dates. The current Apartments.com Boston rent report provides a second market view. Census median gross rent remains lower because it includes existing leases and subsidized units rather than only homes advertised to new tenants.
Neighborhood Prices Differ Sharply
| Neighborhood | Median Listing Price | Median Monthly Rent |
|---|---|---|
| Beacon Hill | $2,322,500 | $3,100 |
| Back Bay | $1,825,000 | $3,350 |
| Downtown Boston | $1,795,000 | $4,165 |
| Fenway and Kenmore | $1,295,000 | $3,549 |
| South Boston | $1,124,500 | $4,000 |
| Jamaica Plain | $847,000 | $3,500 |
| East Boston | $687,000 | $3,200 |
| Dorchester | $665,000 | $3,200 |
| Brighton | $552,500 | $2,995 |
Housing Supply and Zoning
A post shared by Planning Department (@bostonplans)
The Greater Boston Housing Report Card has documented the region’s shortage of homes and its effect on prices. The Boston Foundation housing report found that production has not kept pace with demand, especially for lower-income households.
Massachusetts requires many communities served by the MBTA to permit denser multifamily housing near transit. A Bipartisan Policy Center analysis of Boston housing supply describes zoning, land costs and construction expenses as major barriers.
Boston has pursued housing growth for decades. A 2013 proposal described plans for 30,000 new homes by 2020. The target belongs to an earlier administration and should be read as historical context, not as the current housing plan.
Boston Neighborhood Population Patterns
Dorchester contains the largest share of Boston residents, followed by Roxbury, Brighton, Jamaica Plain and East Boston. Neighborhood totals depend on the boundaries used by the Planning Department, Census tracts and local statistical services. Areas such as East Cambridge, East Somerville, Newton Corner and East Dedham belong to other municipalities and should not appear in a Boston city neighborhood ranking.
| Part of Boston | Population Pattern | Housing Pattern |
|---|---|---|
| Dorchester | The city largest residential area | Dense multifamily streets mixed with lower-density sections |
| Roxbury | Large population with deep Black and Latino roots | Rapid redevelopment near transit corridors |
| Brighton and Allston | Large student and young-adult population | High renter share and frequent household turnover |
| East Boston | Strong immigrant population growth | New waterfront construction alongside older triple-deckers |
| Jamaica Plain | Mixed age and household profile | High demand near the Orange Line and green space |
| South Boston | Fast household and housing change | High prices near the waterfront and Seaport |
| Hyde Park and West Roxbury | More families and older residents | Lower density and larger homes than central Boston |
Nearby Rhode Island belongs to the wider New England economy, but it is not part of Boston city. Cross-state commuting and migration can still influence housing and labor conditions in both places.
How Boston Could Grow in the Following Years?

Claims that Boston would reach 780,000 or 790,000 residents by 2020 did not happen. The 2020 Census count was 675,647. A later claim that the city would reach 760,000 by 2030 also now looks too high unless Boston records an extraordinary increase during the second half of the decade.
The city would need to add nearly 86,000 residents from the 2025 estimate to reach 760,000 by 2030. That equals more than 17,000 new residents per year. Boston has not sustained that pace in recent Census estimates.
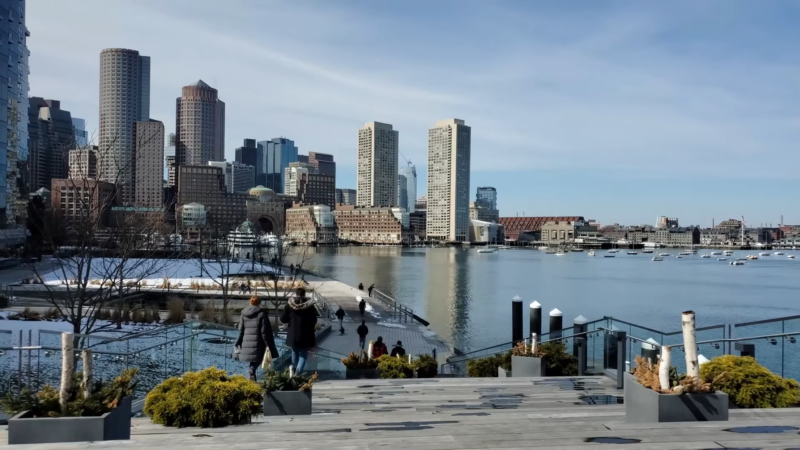
Growth will depend on several practical conditions:
- How many homes Boston permits and completes
- How many students remain after graduation
- The strength of international immigration
- Employment growth in healthcare, education, biotechnology and technology
- The number of residents leaving for lower-cost suburbs or other states
- The ability of the MBTA and city infrastructure to support added households
The Fairmount Indigo planning initiative identifies one corridor where housing, transportation and neighborhood investment can support additional residents.
Long-range projections near 800,000 by 2050 are possible rather than guaranteed. Earlier work on Boston and Massachusetts population predictions discusses that longer horizon. The city Planning Department also publishes material on larger demographic trends.

Methodology
The 2026 population figure is a World Population Review projection based on recent estimates. The official baseline is the Census Bureau Vintage 2025 estimate of 672,973 residents. Census QuickFacts and the 2020-2024 American Community Survey provide the demographic, income, education, housing and commuting figures.
Housing-market figures come from Realtor.com and were current in May 2026. Census housing figures cover a multiyear survey period, so they measure a different group of homes and should not match current advertised prices.
City, urban-area, metropolitan-area and combined-area totals were kept separate. Historical reports remain linked for continuity, but expired targets are identified as historical plans rather than current projections.