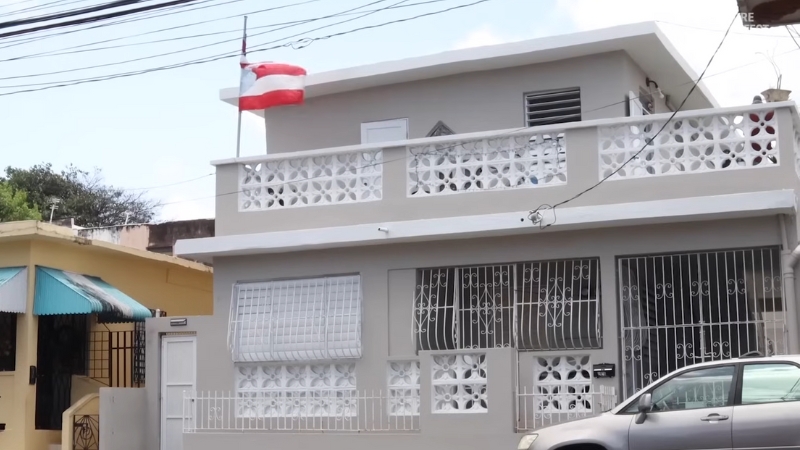
Puerto Rico population in 2025 presents an intriguing demographic narrative.
Despite the complexities associated with births, deaths, and migration, the population is experiencing a subtle decline, with estimates indicating a decrease since the beginning of the year and it stands around at 3,191,270 people.
Current estimates vary slightly, but they emphasize a notable trend.
Key Takeaways
- Puerto Rico’s population is projected to drop from 3.2 million in 2025 to 2.5 million by 2050, driven by low fertility and negative migration.
- The median age will rise from 45.8 to 54.7 years, increasing pressure on healthcare and social services.
- 470,000 residents left between 2010 and 2020, with continued negative net migration despite government efforts.
- The high school dropout rate is 33%, and only 51% of graduates pursue higher education, much lower than on the mainland.
- High unemployment and limited job prospects drive migration, with government incentives struggling to reverse the trend.
- Population decline and aging demand changes in urban planning, housing, and healthcare, alongside efforts for job creation and energy initiatives.
Current Population Statistics
As of 2025, Puerto Rico’s population is approximately 3,191,270 people. The population density remains significant given the island’s size, yet it continues to face a slight decline.
Modern demographic characteristics feature a mix of descents, predominantly influenced by European, African, and Indigenous ancestries.
Recent census figures highlight a reduction in the younger population, with an increasing proportion of elderly citizens, influencing economic and social structures.
The island’s strategic geographic location in the Caribbean shapes its demographics, as migration patterns continue to impact its overall composition.
Factors Influencing Population Change
Puerto Rico population has experienced significant changes due to various influences. These include migration patterns, birth and death rates, economic conditions, and the impact of natural disasters.
Migration Patterns

Migration plays a significant role in Puerto Rico population changes, primarily through large outflows to the U.S. mainland. This trend has accelerated over the past few decades due to economic challenges, especially since 2006 when the island entered a long-term recession.
The island’s population peaked at around 3.8 million in 2004, but by 2020, it had dropped to approximately 3.3 million, reflecting a population decline of about 12% according to Census.gov.
The net outmigration rate remains negative, meaning more people leave the island than move in. Liberty Street Economics notes that for example, from 2010 to 2020, Puerto Rico lost about 470,000 residents, largely due to economic stagnation, lack of job opportunities, and the aftermath of natural disasters like Hurricane Maria in 2017.
The hurricane particularly spurred an increase in outmigration, as many Puerto Ricans moved to the U.S. mainland in search of better living conditions.
A closer look at the data shows that the demographic composition of those leaving tends to skew younger and less educated. About one-third of those who migrated from Puerto Rico between 2011 and 2013 were aged 16 to 30, and many had lower educational attainment compared to the general population.
Despite efforts to incentivize return migration, including government programs to attract professionals back to the island, the impact has been minimal, and return migration has not been enough to offset the outflows. Net migration is estimated to have fluctuated with events like the COVID-19 pandemic slowing the movement of people, but the overall trend remains a loss of residents.
Birth and Death Rates
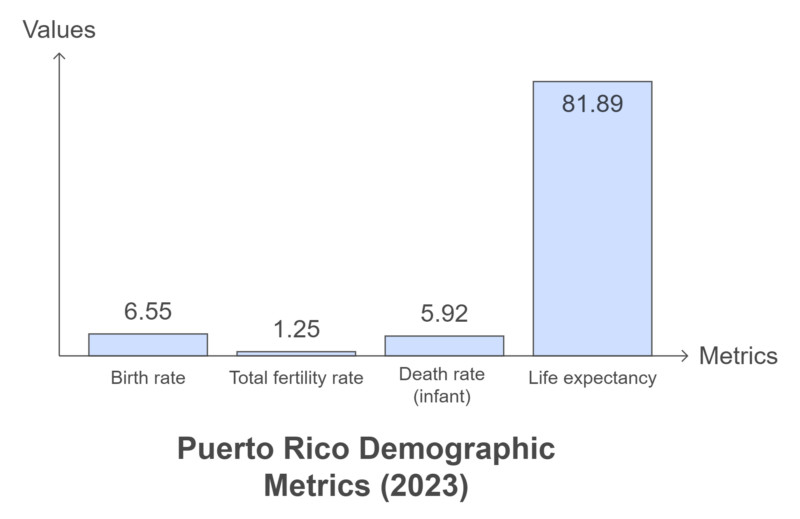
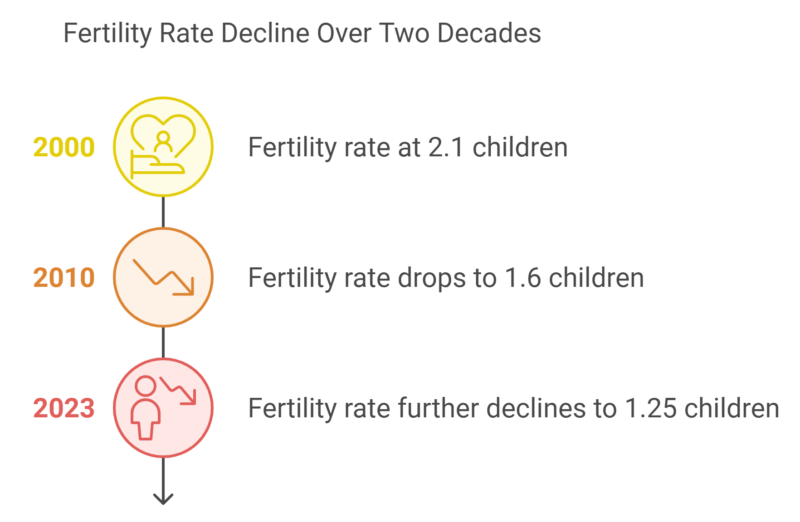
Puerto Rico has experienced significant changes in its birth and death rates over the past several years. The birth rate has steadily decreased, reaching 6.55 births per 1,000 people in 2023, down from 6.72 in 2022.
This decline is driven by lower fertility rates, with women in Puerto Rico having an average of 1.25 children in 2023, compared to higher historical averages. Economic challenges and shifting cultural attitudes towards family planning are key factors behind this decline, as per a fact sheet from the government.
On the other hand, death rates have remained relatively stable due to improved healthcare. Life expectancy in Puerto Rico was estimated at 81.89 years in 2023, with women living longer than men.
However, the aging population has added pressure to healthcare services, as a significant portion of the population is now over 65. With fewer births and stable death rates, the island faces a natural population decline, compounding the effects of migration.
Economic Conditions
| Indicator | Value (2023) | Previous (2022) | Unit |
|---|---|---|---|
| GDP | 117.90 | 113.57 | USD Billion |
| GDP Annual Growth Rate | 0.70% | 3.80% | Percent |
| GDP (Constant Prices) | 69,333.60 | 68,884.10 | USD Million |
| GDP per Capita | 30,122.84 | 29,819.89 | USD |
| GDP per Capita (PPP) | 42,994.79 | 34,297.93 | USD |
| Gross Fixed Capital Formation | 13,225.20 | 12,867.10 | USD Million |
Trading Economics notes that In 2023, Puerto Rico’s GDP was valued at $117.90 billion USD, representing 0.11% of the global economy. This figure is slightly higher than the previous year’s $113.57 billion, showing a GDP growth rate of 0.7%, although this is a notable slowdown from the 3.8% growth rate recorded in 2022. This decline in growth could reflect broader economic challenges, such as inflation, migration, or the aftermath of natural disasters that have impacted economic activity on the island.
The GDP per capita in Puerto Rico reached $30,122.84 USD in 2023, showing a small increase from $29,819.89 in the previous year. However, when adjusted for purchasing power parity (PPP), the GDP per capita rises significantly to $42,994.79 USD, indicating a relatively higher standard of living when accounting for price differences between economies.
Gross Fixed Capital Formation, which measures investment in physical assets like buildings and infrastructure, rose to $13,225.20 million USD, up from $12,867.10 million USD. This increase reflects ongoing investment efforts to bolster infrastructure and long-term economic growth, which are crucial for sustaining future development.
Economic Incentives
Puerto Rico’s economic incentives are a critical part of its strategy to boost economic growth, retain residents, and attract businesses. Below are several key statistics and tables that outline the various tax and economic initiatives the island offers:
1. Corporate Tax Incentives (Act 60)
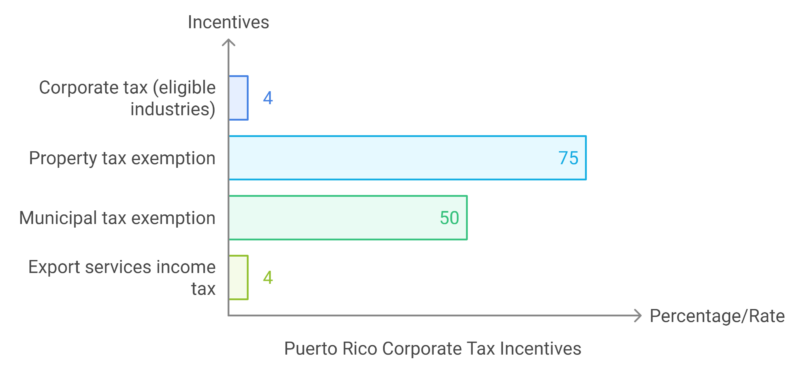
Puerto Rico’s Incentives Code, established in 2019 (Act 60), consolidates decades of tax incentives into one system aimed at promoting key industries like manufacturing, tourism, and technology. Some important benefits include:
- Corporate tax rate: As low as 4% for eligible businesses in industries like manufacturing and export services.
- Exemptions: 75% exemption on property taxes and 50% exemption on municipal taxes for eligible businesses.
- Export services: Companies engaged in exporting services can enjoy a 4% fixed income tax rate, and 100% tax exemption on distributions from earnings derived from export activities according to Worldwide Tax Summaries Online.
2. Housing and Affordable Living Programs
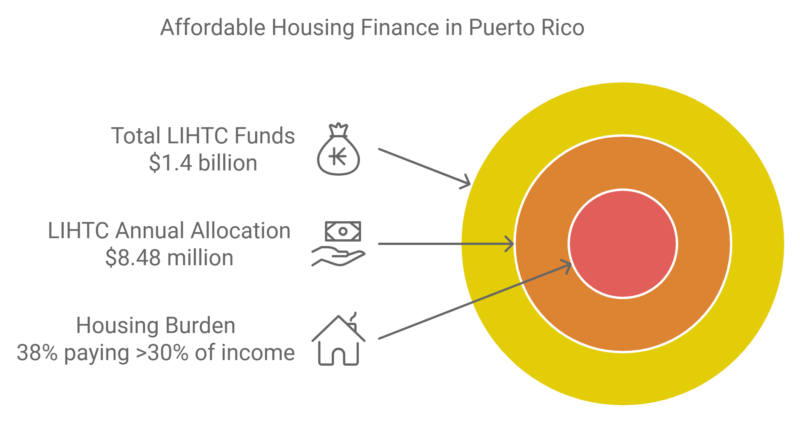
Housing affordability is another area where Puerto Rico has focused its economic incentives. Projects funded by the Low-Income Housing Tax Credit (LIHTC) aim to reduce the housing cost burden. In 2023, over $1.4 billion was allocated to affordable housing projects.
- Housing Affordability: 38% of Puerto Rican households with a mortgage on housing.
- Tax Credits: An annual allocation of $8.48 million in LIHTC for 2022-2024 helps fund housing projects for low-income residents.
3. Job Creation and Workforce Development
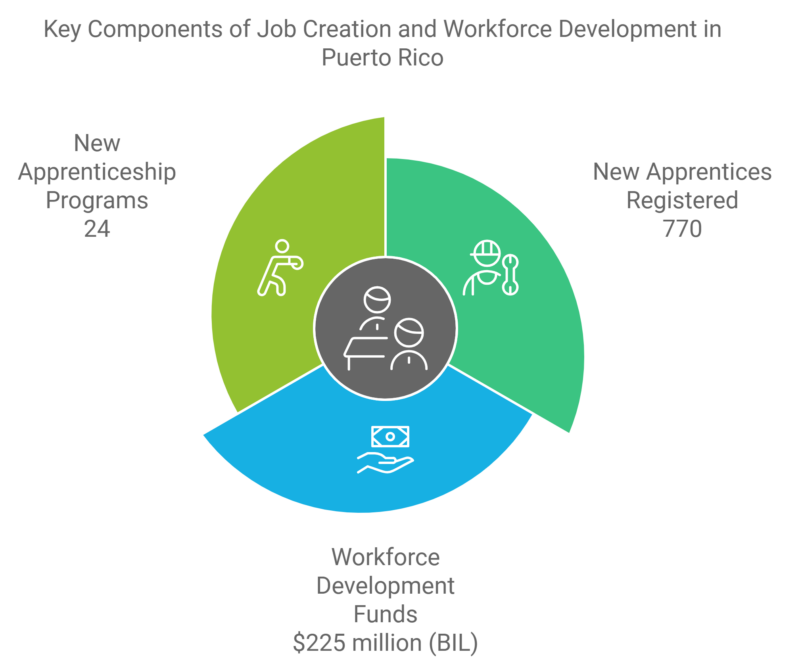
Puerto Rico’s government also focuses on job creation through the Good Jobs Challenge and other initiatives. By 2023, approximately 770 new apprentices were registered under 24 different apprenticeship programs, focusing on industries like aerospace and construction.
- Workforce Development Funds: Up to $225 million from the Bipartisan Infrastructure Law (BIL) is dedicated to workforce training programs.
- Apprenticeship Programs: A total of 24 new programs were introduced, providing practical training in high-demand fields.
These efforts are aimed at reducing unemployment and equipping the local workforce with the skills needed to fill gaps in critical sectors.
4. Renewable Energy Incentives
As part of Puerto Rico’s plan to modernize its infrastructure and reduce energy costs, the government has invested in renewable energy projects. By the end of 2023, over $440 million was committed to installing solar energy systems in low-income homes through the Puerto Rico Energy Resilience Fund (PR-ERF).
- Renewable Energy Projects: Solar energy and battery storage systems were prioritized for installation in residential areas.
- Energy Efficiency Programs: Small businesses and farmers received federal support to install renewable energy systems.
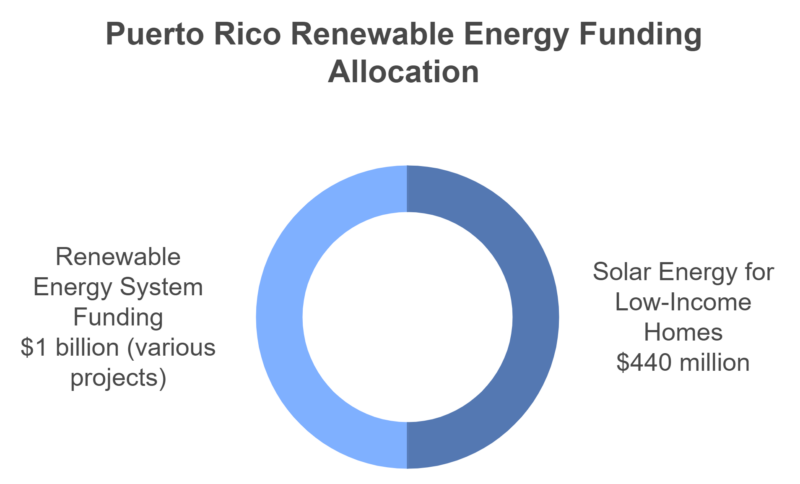
These energy initiatives aim to lower the cost of living and create sustainable growth, reducing the island’s dependence on fossil fuels.
Social and Cultural Dynamics
Puerto Rico’s social and cultural landscape is intricately shaped by family planning trends and the experiences of its diaspora communities. These elements play crucial roles in defining population demographics, societal norms, and cultural identity.
Family Planning Trends
Over the years, Puerto Rico has witnessed a shift toward smaller family sizes, driven by increased access to contraception and changing societal norms around family planning. This shift mirrors global trends where economic factors play a key role in influencing family decisions. Some key statistics include:
- Contraceptive Use: Modern contraception methods are widely adopted, with over 75% of Puerto Rican women of reproductive age using some form of birth control. Access to contraception and family planning services has been heavily promoted by government campaigns according to Census.gov.
- Fertility Rate: Puerto Rico’s fertility rate has dropped significantly to 1.25 children per woman in 2023, one of the lowest rates in the region. This decline is part of a broader trend toward delaying childbirth and having fewer children, often driven by economic uncertainty and changing career priorities among younger generations.
Diaspora Communities
Puerto Rico’s diaspora, especially in the United States, has had a substantial influence on both the island’s economy and its cultural landscape. Approximately 5.8 million Puerto Ricans live abroad, with most residing in the U.S. mainland, particularly in New York, Florida, and Pennsylvania.
These diaspora communities maintain deep connections to the island through remittances, cultural traditions, and social ties, which shape Puerto Rico’s cultural and economic environment.
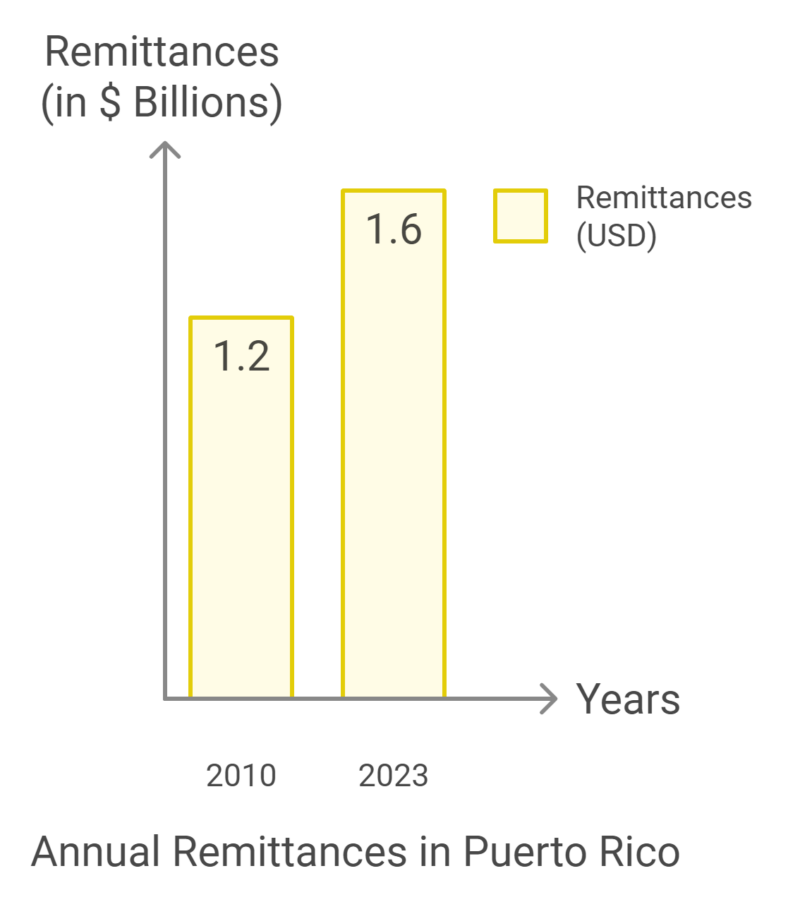
- Remittances: Remittances sent from diaspora members contribute significantly to the local economy, with an estimated $1.6 billion sent annually from Puerto Ricans abroad. These funds help families meet daily needs and invest in housing and education, ultimately strengthening local communities.
- Cultural Influence: Festivals, music, and traditions from the Puerto Rican diaspora heavily influence cultural expression on the island. Celebrations like the Puerto Rican Day Parade in New York help preserve cultural identity abroad, while return visits from diaspora members help revitalize local traditions and family ties. This cultural interchange enriches Puerto Rico’s social fabric, blending influences from both the mainland and the island.
- Impact on Migration: The continuous movement between Puerto Rico and the U.S. mainland affects demographic trends on the island. Economic downturns, natural disasters like Hurricane Maria, and political developments drive migration patterns, with many Puerto Ricans leaving the island in search of better opportunities.
Population Pyramid
| Indicator | Value |
|---|---|
| Median Age | 43.1 years |
| – Male | 41.2 years |
| – Female | 44.8 years |
| Total Population | 3,311,270 |
| – Male | 1,571,860 (47.47%) |
| – Female | 1,739,410 (52.53%) |
| Adult Population | 2,714,000 |
| – Senior Population (65+) | 703,925 |
| Age Dependency Ratios | |
| – Overall Age Dependency Ratio | 64.7 |
| – Old Age Dependency Ratio (65+) | 35.0 |
| – Child Dependency Ratio (0-14) | 29.7 |
The population pyramid data highlights the gender distribution and age structure in Puerto Rico in 2024. There are 1,739,410 females (52.53% of the total population) and 1,571,860 males (47.47%). The median age for the overall population is 43.1 years, reflecting the aging trend, with females having a higher median age (44.8 years) than males (41.2 years).
The overall age dependency ratio is 64.7, meaning that for every 100 working-age adults (ages 15-64), there are about 65 dependents, both children (under 15) and seniors (65+). The old-age dependency ratio is 35.0, indicating that for every 100 working-age adults, there are 35 seniors. The child dependency ratio is 29.7, showing a lower proportion of children compared to seniors.
Cities and Their Population
Implications of Demographic Changes
Demographic shifts in Puerto Rico have significant effects on various sectors, including healthcare, education, infrastructure, and the labor market. Understanding these impacts helps adapt systems and strategies to meet the evolving needs of the population.
Impact on Healthcare Systems
- Infant Mortality: Between 2000 and 2020, Puerto Rico saw a significant decline in infant mortality rates, from 10.2 to 7.2 deaths per 1000 live births, reflecting a 29.4% decrease. This improvement indicates enhanced healthcare services for infants and improved maternal care as per Health In The Americas.
- Low-weight Births: The percentage of low-weight births (infants born weighing less than 2500 grams) marginally decreased from 10.6% to 10.2% between 2000 and 2020. This slight decrease suggests gradual improvements in maternal nutrition and prenatal care.
- Maternal Mortality: In contrast, the maternal mortality ratio saw a significant rise, increasing by 57% from 21.9 deaths per 100,000 live births in 2000 to 34.3 in 2020. This increase raises concerns about access to quality maternal healthcare and the growing risks associated with childbirth.
- Fertility Trends: By 2024, the fertility rate is projected to be just 0.9 children per woman, highlighting a significant decline in birth rates. The adolescent fertility rate also decreased dramatically, falling by 81.9% from 73.3 live births per 1000 women aged 15 to 19 in 2000 to 13.3 in 2024. These changes are likely due to increased access to contraception and shifts in social norms around family planning.
- Healthcare Access: By 2020, 99.8% of births were attended by skilled birth personnel, indicating nearly universal access to professional care during childbirth. Additionally, antenatal care coverage improved, with 99.2% of pregnant women receiving four or more consultations by 2018, compared to 95% in 2000. These statistics reflect progress in maternal healthcare delivery and access to essential health services.
- Communicable Diseases: In 2022, Puerto Rico reported 1 new case of tuberculosis per 100,000 population and an HIV infection rate of 11 per 100,000. No cases of human rabies were reported. This shows that while some communicable diseases remain present, they are under control with low incidence rates.
Educational System Adjustments
Poverty is rising in one of the world’s oldest colonies: In Puerto Rico, 41.7% of people, including 57.6% of children, live in poverty.
This is nearly 4 times the US rate.
And Puerto Rican workers are getting poorer even while unemployment falls.https://t.co/ytZ3cY4AMB
— Ben Norton (@BenjaminNorton) April 23, 2024
One of the most significant challenges facing Puerto Rican education is the high percentage of children living in poverty. About 57,6% of children in Puerto Rico live below the poverty line, compared to 17% in the mainland United States. This disparity is even more pronounced in rural areas.
In addition, many students lack access to modern educational resources, with 25% of Puerto Rican children lacking internet access and 50% without a home computer in 2017. Even those with these resources often face unreliable electricity due to damages to the island’s power grid from natural disasters like hurricanes.
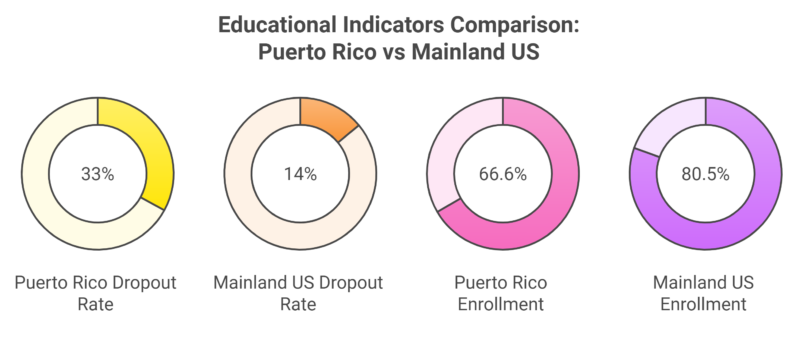
The high school dropout rate is also a concern. As of the most recent data, one-third of Puerto Rican high school students drop out, which is more than twice the dropout rate in the mainland United States. In 2015, the secondary education net enrollment rate in Puerto Rico was 66.6%, compared to 80.5% in the mainland US, indicating a gap in school attendance.
Higher Education and Inequality
Despite the challenges in secondary education, some students do pursue higher education. However, only 51% of high school graduates in Puerto Rico go on to attend university, compared to 67% of suburban Americans and 63% of rural and urban Americans.
Many of the students who do pursue higher education come from privileged backgrounds, further exacerbating income inequality on the island. Puerto Rico ranks as the third-highest in income inequality globally, following South Africa and Zambia.
Another barrier for Puerto Rican students is the difficulty in transitioning to higher education in the mainland United States. The island’s high school graduation tests do not align with those in the mainland US, requiring students to take a Spanish language test that few mainland universities recognize.
As a result, only 694 high school graduates from Puerto Rico attended college in the mainland US or abroad in 2016, representing just 2% of the graduating class.
| Indicator | Puerto Rico | Mainland US |
|---|---|---|
| High school graduates attending university | 51% | 67% (suburban), 63% (rural/urban) |
| Income inequality ranking (global) | 3rd highest | N/A |
University of Puerto Rico
View this post on Instagram
On the positive side, the University of Puerto Rico is more affordable than most mainland US institutions. In-state tuition at the University of Puerto Rico is $4,366 per year, compared to an average of $25,707 at public institutions in the mainland US for in-state students.
Out-of-state tuition is $8,712 in Puerto Rico, much lower than the $44,014 average for out-of-state students on the mainland. Despite the affordability, only half of the students who enroll in Puerto Rican universities complete their degrees within six years, compared to 58% on the mainland.
| Tuition | Puerto Rico | Mainland US (in-state) | Mainland US (out-of-state) |
|---|---|---|---|
| In-state tuition (University of Puerto Rico) | $4,366 | $25,707 | $44,014 |
| Out-of-state tuition (University of Puerto Rico) | $8,712 | N/A | N/A |
Infrastructure and Housing
Demographic changes affect infrastructure and housing needs significantly. Urban planning must address the increasing demand for accessible housing, particularly for older adults. Incorporating features like mobility aids and community centers can enhance living conditions for an aging population.
Transportation systems may require adjustments to cater to areas with growing populations, ensuring efficient public transit. Upgrading utilities to accommodate varying population densities and investing in sustainable resources can support long-term community development. These changes are crucial for fostering a robust infrastructure that meets evolving demographic demands.
Labor Market Trends
| Month | Civilian Labor Force (thousands) | Employment (thousands) | Unemployment (thousands) | Unemployment Rate (%) |
|---|---|---|---|---|
| March 2024 | 1,215.0 | 1,144.6 | 70.5 | 5.8 |
| April 2024 | 1,211.1 | 1,140.2 | 70.8 | 5.8 |
| May 2024 | 1,206.8 | 1,136.4 | 70.3 | 5.8 |
| June 2024 | 1,203.3 | 1,133.4 | 69.9 | 5.8 |
| July 2024 | 1,201.8 | 1,132.3 | 69.4 | 5.8 |
| August 2024 | 1,201.9 | 1,133.9 | 68.0 | 5.7 |
Over this period, the civilian labor force gradually decreased from 1,215,000 in March to 1,201,900 in August, indicating a slight contraction in the workforce. Employment figures also show a gradual decline, with 1,144,600 employed in March dropping to 1,133,900 by August according to BLS.
The unemployment rate remained relatively stable at 5.8% from March through July, only slightly decreasing to 5.7% in August. Despite this slight improvement, the figures suggest a consistent labor market without significant changes in employment conditions.
The steady unemployment rate reflects ongoing challenges in Puerto Rico’s labor market, which continues to face structural issues, including population decline, migration, and economic uncertainties. The small changes in unemployment and labor force participation could indicate a stagnant labor market with limited job creation during this period.
Racial Composition of Puerto Rico’s Population
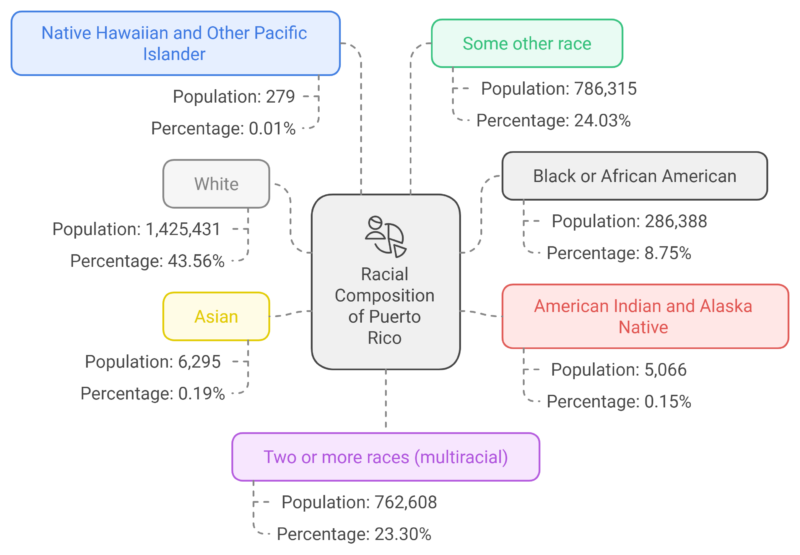
The table highlights the racial diversity of Puerto Rico’s population. White individuals make up the largest racial group, representing 43.56% of the population. “Some other race” and multiracial individuals also represent significant portions of the population, accounting for 24.03% and 23.30%, respectively.
Notably, the Black or African American population constitutes 8.75%, while smaller racial groups like Asian, American Indian and Alaska Native, and Native Hawaiian and Other Pacific Islander represent less than 1% of the total population according to Neilsberg’s article.
The high percentage of individuals identifying as multiracial and some other race reflects Puerto Rico’s complex racial and cultural heritage, influenced by indigenous, African, European, and other ancestry. This diversity plays a critical role in shaping the island’s social and cultural dynamics.
Projections and Future Trends
| Year | Population | Yearly % Change | Yearly Change | Migrants (Net) | Median Age | Fertility Rate | Density (P/Km²) | Urban Population % | World Population | Puerto Rico Global Rank |
|---|---|---|---|---|---|---|---|---|---|---|
| 2025 | 3,235,289 | -0.25% | -8,103 | 5,495 | 45.8 | 0.94 | 365 | N.A. | 8,231,613,070 | 135 |
| 2030 | 3,140,742 | -0.59% | -18,909 | -7,330 | 47.7 | 0.97 | 354 | N.A. | 8,569,124,911 | 137 |
| 2035 | 3,006,448 | -0.87% | -26,859 | -6,032 | 49.5 | 1.02 | 339 | N.A. | 8,885,210,181 | 139 |
| 2040 | 2,853,785 | -1.04% | -30,533 | -6,983 | 51.1 | 1.06 | 322 | N.A. | 9,177,190,203 | 141 |
| 2045 | 2,684,943 | -1.21% | -33,768 | -5,843 | 52.8 | 1.09 | 303 | N.A. | 9,439,639,668 | 143 |
| 2050 | 2,503,994 | -1.39% | -36,190 | N.A. | 54.7 | 1.13 | 282 | N.A. | 9,664,378,587 | 143 |
Puerto Rico’s population is projected to steadily decline from 3.2 million in 2025 to approximately 2.5 million by 2050. This represents a continuous downward trend, with the yearly percentage change growing more negative over time, reaching -1.39% by 2050.
The main drivers of this decline include a consistently low fertility rate, which is forecasted to remain around 1.13 children per woman by 2050, and negative net migration, with the island expected to lose thousands of residents each year as per Worldometers.
The median age is projected to rise significantly, from 45.8 years in 2025 to 54.7 years by 2050, reflecting an aging population. As birth rates remain low and migration continues, the demographic shift toward an older population will place increased pressure on social services, healthcare, and the economy.
The population density will also decrease over time, from 365 people per km² in 2025 to 282 people per km² in 2050. This reduction in population density aligns with the overall population decline and may impact urban planning and infrastructure needs on the island. Puerto Rico’s share of the world population will shrink to 0.03%, as the global population continues to grow while the island’s population decreases.
Methodology
The information for this post was gathered from reliable sources, including:
- World Population Review for demographic data.
- World Bank for GDP and economic indicators.
- U.S. Census Bureau for migration and education statistics.
- Liberty Street Economics for migration patterns and disaster impacts.
- Trading Economics for employment and capital formation data.
The data was compiled into tables to highlight key trends, with figures cross-checked for consistency across sources.
The focus was on ensuring accuracy through official and academic reports, providing a comprehensive view of Puerto Rico’s demographic and economic shifts.
References:
-
- Census.gov – Net Outmigration from Puerto Rico Slows During Pandemic
- Liberty Street Economics – Population Loss: Puerto Rico’s Troubling Out-Migration
- Census.gov – Estimating Puerto Rico Population After Hurricane Maria
- Health In The Americas – Puerto Rico Country Profile
- Trading Economics – Puerto Rico GDP
- Worldwide Tax Summaries Online – Puerto Rico Corporate Tax Incentives (Act 60)
- BLS – Puerto Rico Civilian Labor Force Data
- Neilsberg – Puerto Rico Population by Race
- Worldometers – Puerto Rico Population
- Ben Norton – Rising Poverty in Puerto Rico