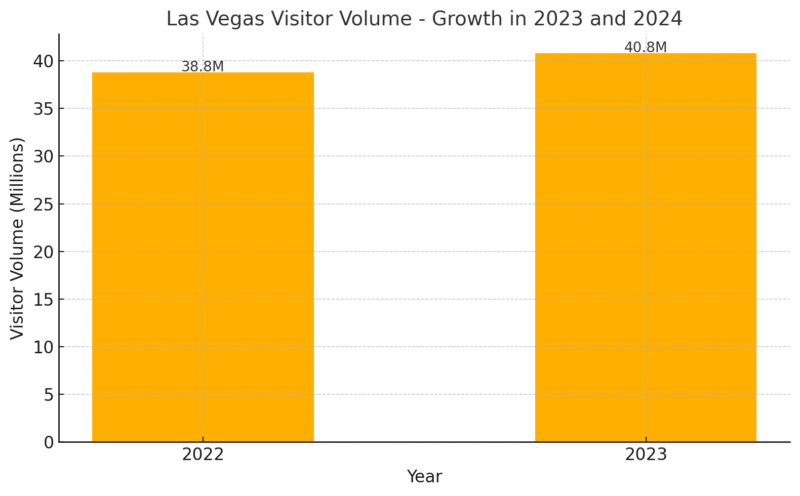
For a city that welcomed over 40 million visitors in 2023, Las Vegas has shown no signs of slowing down in 2024 according to Travel Weekly.
By September, visitor volumes had already reached 31.4 million, marking a 2.9% increase year-over-year, a testament to the city’s enduring appeal.
With thriving convention attendance, significant gaming revenue growth, and the introduction of new entertainment offerings, Las Vegas with population of 665,640 continues to evolve as a dynamic and resilient destination.
Key Takeaways
Visitor Volume – Growth in 2023 and 2024
In 2023, Las Vegas attracted approximately 40.8 million visitors, marking a 5.2% increase over the previous year.
This growth reflects a strong recovery and return to pre-pandemic tourism levels, bolstered by a variety of factors, including increased entertainment offerings, major conventions, and rising international tourism.
From January to September 2024, Las Vegas welcomed approximately 31.4 million visitors, marking a 2.9% year-over-year increase compared to the same period in 2023 according to LCVA report.
This consistent growth demonstrates the city’s ongoing recovery and appeal as a travel destination.
Month
Visitor Volume
YoY Change (%)
January
3,383,500
+3.3%
February
3,374,300
+9.5%
March
3,671,500
+0.4%
April
3,513,500
+3.8%
May
3,657,200
+4.6%
June
3,490,600
+1.8%
July
3,512,500
-0.4%
August
3,399,900
+2.4%
September
3,389,100
+1.6%
YTD 2024
31,392,100
+2.9%
Convention Attendance
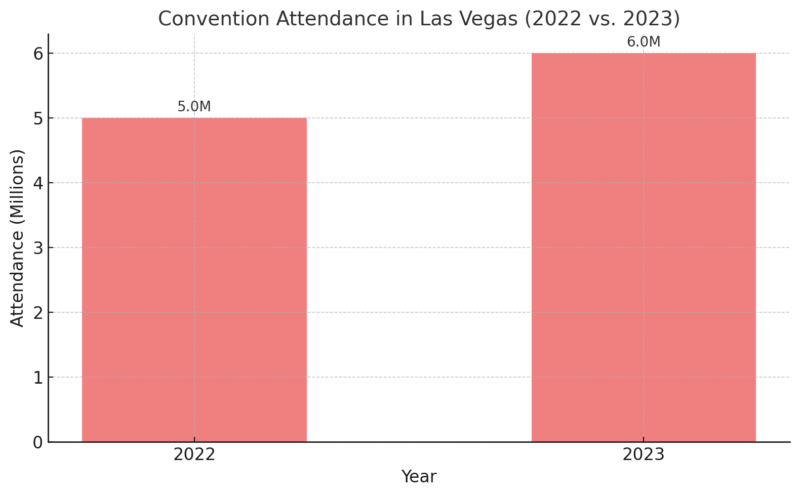
Convention attendance in Las Vegas hit 6 million, representing a 19.9% increase over last year as per Las Vegas Sun notes.
As Las Vegas is home to world-class convention centers and hosts many large-scale events, it remains one of the top choices for business events and conventions globally.
This surge in convention attendance is significant because convention-goers typically spend more on average than leisure travelers, benefiting the city’s economy.
Accommodation – High Occupancy and Revenue
MGM Resorts Revenue Down as Las Vegas Room Rates Reach Record Levels in Q3 https://t.co/rfXaLuAlk1
— VegasTweetsInfo (@VegasTweetsInfo) November 3, 2024
Las Vegas has one of the largest inventories of hotel rooms in the world, with 154,662 rooms available.
The occupancy rate for these hotels averaged 83.5% throughout the year, a reflection of consistent demand, especially during weekends and major events.
The Average Daily Room Rate (ADR) was $191.29, illustrating the high value that visitors place on staying in premium accommodations according to reports.
Additionally, 46.3 million room nights were occupied during the year, demonstrating the impressive capacity of Las Vegas to accommodate massive visitor numbers.
Metric
2023 Total
Total Hotel Rooms
154,662
Occupancy Rate
83.5%
Average Daily Room Rate (ADR)
$191.29
Room Nights Occupied
46.3 million
Air and Road Travel

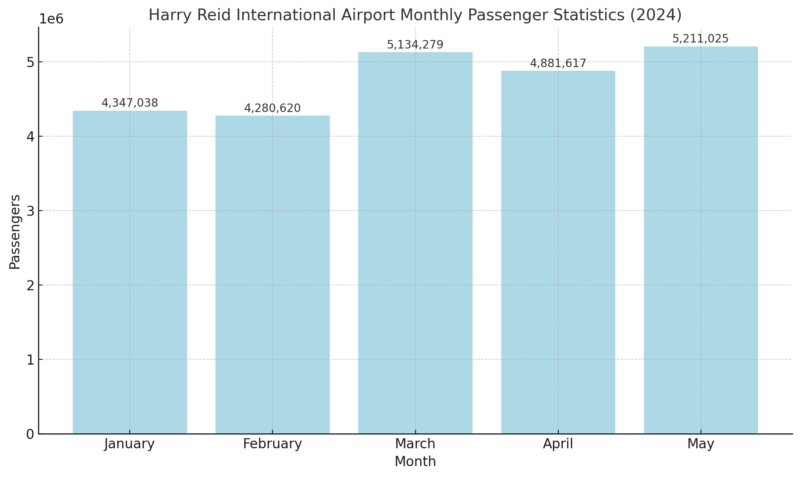
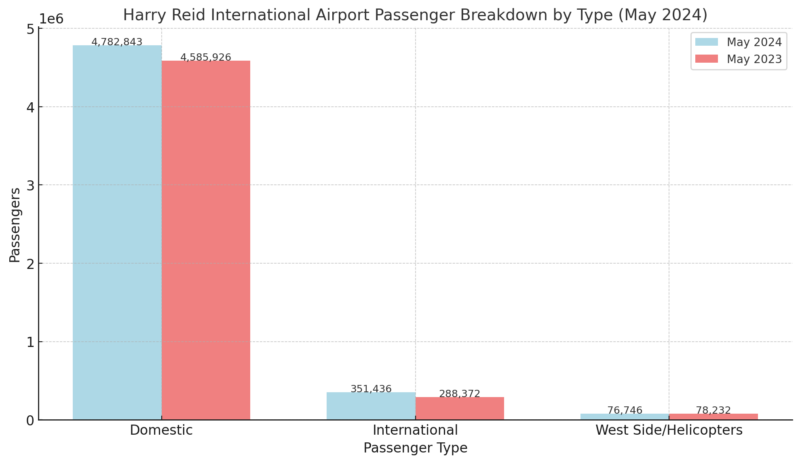
As of May 2024, Harry Reid International Airport has experienced significant passenger traffic, reflecting its status as a major aviation hub.
Monthly Passenger Statistics for 2024
Year-to-Date (YTD) Totals
- Total Passengers (January to May 2024): 23,821,461
- Year-over-Year Change: 2.4% increase compared to the same period in 2023 according to their report
Passenger Breakdown by Type (May 2024)
Road Travel
The Nevada Department of Transportation (NDOT) reported the following average daily traffic counts for major highways leading into Las Vegas:
Location
Average Daily Traffic
Year-over-Year Change
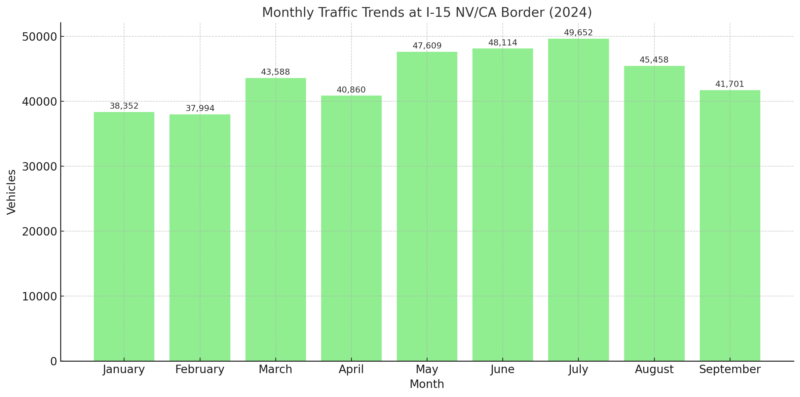
I-15 at NV/CA Border
43,703 vehicles
-0.7%
All Major Highways Combined*
129,988 vehicles
+0.5%
These figures indicate a slight decrease in traffic at the Nevada border on I-15, while overall highway traffic into Las Vegas saw a modest increase.
Monthly Traffic Trends
Monthly data for 2024 shows fluctuations in traffic volumes:
Economic Impact
In 2023, the total economic impact of tourism in Southern Nevada reached $85.2 billion, with direct visitor spending accounting for $51.5 billion according to Statista
Industry Sector
Estimated Revenue (in billions USD)
Tourism and Hospitality
$60.0
Gaming and Casinos
$15.8
Conventions and Events
$10.5
Retail and Shopping
$8.0
Entertainment and Shows
$5.5
Real Estate and Construction
$4.0
Healthcare and Services
$3.5
Technology and Startups
$2.0
Manufacturing and Logistics
$1.5
Education and Research
$1.0
Total Combined Revenue
$111.8
Las Vegas’s economy in 2024 showcases resilience and diversity, with an estimated combined revenue of $111.8 billion driven by its strengths in tourism, hospitality, and emerging industries.
The tourism and hospitality sector remains central, contributing $60 billion, while gaming and casinos generated $15.8 billion, with the Strip alone accounting for $9.1 billion—a 6% year-over-year increase.
The conventions and events sector brought in $10.5 billion, reflecting Las Vegas’s appeal as both a leisure and business destination.
Retail achieved $8 billion in revenue, while entertainment, including concerts and shows, contributed $5.5 billion, reinforcing the city’s cultural allure.
Real estate and construction generated $4 billion, healthcare services added $3.5 billion, and technology startups contributed $2 billion, highlighting the city’s diversification and growth across sectors.
Gaming Revenue
In the 2024 fiscal year, statewide GGR increased by approximately 1.7% compared to 2023, reaching a record $15.76 billion.
The Las Vegas Strip contributed significantly to this growth, with GGR hitting an all-time high of nearly $9.1 billion, marking a 6% rise over the previous fiscal year according to Gaming Control Board.
The gaming industry remains central to Las Vegas’s identity and economy.
Here’s the breakdown of gaming revenue across major areas:
Area
2023 Gaming Revenue
Year-over-Year Change
Clark County (Total)
$10.003 billion
+1.4%
Las Vegas Strip
$6.451 billion
-0.2%
Downtown Las Vegas
$683 million
+4.3%
Boulder Strip
$720 million
-0.9%
These figures reflect both in-person gaming activities and the strategic focus on high-revenue-generating areas such as the Strip.
Downtown Las Vegas, with its unique attractions, has seen a higher percentage increase in revenue.
While traditional casinos dominate the Las Vegas gambling scene, the rise of online gambling has introduced new dynamics.
However, Nevada’s regulatory framework imposes restrictions on online casino operations, limiting their impact compared to physical establishments.
Nonetheless, the global growth of online gambling presents potential opportunities and challenges for the local industry, as noted by insights from casinos.com.
Methodology
To craft this article, we analyzed data from reliable sources, including the Las Vegas Convention and Visitors Authority (LVCVA), Gaming Control Board reports, and transportation statistics from the Nevada Department of Transportation.
We utilized year-over-year comparisons to highlight trends in visitor volume, convention attendance, and economic impact.
Official metrics on hotel occupancy, airport traffic, and gaming revenue were cross-referenced for accuracy and consistency. Insights on online gambling dynamics were supplemented by industry analyses
References
- Las Vegas tourism numbers for 2023 – Travel Weekly
- Las Vegas conventions and tourism continue to rebound – Las Vegas Sun
- Monthly Visitor Statistics and Reports – LVCVA Research
- Gaming Revenue Information – Gaming Control Board


