
The US economy is not spread evenly across the map. The latest full year state GDP data shows a country where a few giant state economies carry an enormous share of national output, and where smaller states can still look rich once population is taken into account.
In 2025, US current dollar GDP reached about $30.762 trillion, according to the latest BEA state GDP data. California remained the clear leader at $4.251 trillion. Texas ranked second at $2.904 trillion. New York ranked third at $2.468 trillion.
The top three states produced 31.3% of all US economic output. Add Florida and Illinois, and the top five produced 41.1%. That concentration is the first thing to know before reading any state ranking. America has 50 state economies, but national growth depends heavily on a few places.
See where your state ranks, what drives its economy, and how it compares with the rest of the country in the latest GDP data below.
US States Ranked by GDP in 2026
| Rank | State or district | GDP | US share | GDP per resident | What stands out |
| 1 | California | $4.251 trillion | 13.82% | $108,012 | Largest state economy by a wide margin |
| 2 | Texas | $2.904 trillion | 9.44% | $91,594 | Energy, population growth and business investment |
| 3 | New York | $2.468 trillion | 8.02% | $123,369 | Highest GDP per resident among states |
| 4 | Florida | $1.835 trillion | 5.96% | $78,195 | Fastest large state climber |
| 5 | Illinois | $1.202 trillion | 3.91% | $94,503 | Midwest business and transport hub |
| 6 | Pennsylvania | $1.056 trillion | 3.43% | $80,895 | Large, older, diversified economy |
| 7 | Ohio | $966.780 billion | 3.14% | $81,239 | Manufacturing scale remains important |
| 8 | Georgia | $924.829 billion | 3.01% | $81,823 | Atlanta, logistics and manufacturing growth |
| 9 | Washington | $894.990 billion | 2.91% | $111,860 | Tech lifts output per resident |
| 10 | North Carolina | $893.763 billion | 2.91% | $79,815 | Fast growing business and research state |
| 11 | New Jersey | $887.175 billion | 2.88% | $92,915 | High income and dense corporate economy |
| 12 | Massachusetts | $820.105 billion | 2.67% | $114,635 | Research, health care, education and biotech |
| 13 | Virginia | $798.448 billion | 2.60% | $89,914 | Federal contracting and professional services |
| 14 | Michigan | $730.068 billion | 2.37% | $72,085 | Auto industry still shapes the state |
| 15 | Arizona | $598.189 billion | 1.94% | $78,463 | Migration, chips, housing and services |
| 16 | Tennessee | $589.818 billion | 1.92% | $80,630 | Autos, logistics, health care and Nashville growth |
| 17 | Colorado | $584.324 billion | 1.90% | $97,184 | High output economy with tech and energy links |
| 18 | Maryland | $568.140 billion | 1.85% | $90,680 | Government, defense, health and research |
| 19 | Indiana | $545.234 billion | 1.77% | $78,188 | Strong manufacturing base |
| 20 | Minnesota | $531.465 billion | 1.73% | $91,154 | Corporate headquarters and health care |
| 21 | Wisconsin | $473.037 billion | 1.54% | $79,199 | Manufacturing and food production |
| 22 | Missouri | $468.470 billion | 1.52% | $74,710 | Central location and mixed industry base |
| 23 | South Carolina | $378.831 billion | 1.23% | $68,009 | Small by size, fast by growth |
| 24 | Connecticut | $376.455 billion | 1.22% | $102,062 | Finance and high household income |
| 25 | Oregon | $342.850 billion | 1.11% | $80,225 | Tech, trade and advanced manufacturing |
| 26 | Alabama | $341.154 billion | 1.11% | $65,694 | Autos, aerospace and lower cost production |
| 27 | Louisiana | $340.080 billion | 1.11% | $73,639 | Energy, ports and petrochemicals |
| 28 | Utah | $315.973 billion | 1.03% | $89,286 | Young population and tech led growth |
| 29 | Kentucky | $306.897 billion | 1.00% | $66,617 | Manufacturing, logistics and health care |
| 30 | Nevada | $281.454 billion | 0.91% | $85,752 | Tourism, logistics and population growth |
| 31 | Iowa | $277.110 billion | 0.90% | $85,570 | Agriculture and manufacturing |
| 32 | Oklahoma | $274.421 billion | 0.89% | $66,554 | Energy and government activity |
| 33 | Kansas | $241.378 billion | 0.78% | $81,075 | Aviation, agriculture and manufacturing |
| 34 | Arkansas | $198.422 billion | 0.65% | $63,703 | Retail headquarters and food production |
| 35 | Nebraska | $198.073 billion | 0.64% | $98,153 | Small state with high output per resident |
| 36 | District of Columbia | $192.618 billion | 0.63% | $277,689 | Federal and professional services concentration |
| 37 | Mississippi | $165.069 billion | 0.54% | $55,877 | Lowest GDP per resident among states |
| 38 | New Mexico | $152.779 billion | 0.50% | $71,879 | Energy, federal labs and public spending |
| 39 | Idaho | $135.553 billion | 0.44% | $66,784 | Population growth, food and manufacturing |
| 40 | New Hampshire | $125.523 billion | 0.41% | $88,688 | Small state with high income economy |
| 41 | Hawaii | $124.608 billion | 0.41% | $86,967 | Tourism and defense exposure |
| 42 | Delaware | $117.218 billion | 0.38% | $110,588 | Corporate, finance and legal services |
| 43 | West Virginia | $109.277 billion | 0.36% | $61,873 | Energy history and weak productivity |
| 44 | Maine | $102.844 billion | 0.33% | $72,688 | Small, older, slower growth economy |
| 45 | Rhode Island | $83.956 billion | 0.27% | $75,329 | Small urban service economy |
| 46 | Montana | $82.358 billion | 0.27% | $71,947 | Population growth and natural resources |
| 47 | North Dakota | $81.883 billion | 0.27% | $102,436 | Small population and high energy output |
| 48 | South Dakota | $80.650 billion | 0.26% | $86,248 | Low unemployment and agriculture exposure |
| 49 | Alaska | $75.012 billion | 0.24% | $101,742 | Small total economy, high resource output |
| 50 | Wyoming | $52.622 billion | 0.17% | $89,379 | Low population and energy dependence |
| 51 | Vermont | $48.350 billion | 0.16% | $75,001 | Smallest state economy by total GDP |
| United States | $30.762 trillion | 100% | $90,004 | National benchmark |
California, Texas and New York Still Define the Top of The Map
View this post on Instagram
California is the only state with GDP over $4 trillion. Its economy is larger than the economies of most countries, and it produced 13.8% of US GDP in 2025.
It comes from technology, entertainment, ports, professional services, universities, agriculture, finance, construction and a consumer market of almost 40 million people.
But the scale is not only related to Silicon Valley. The state has several economic engines running at once.
Los Angeles is well known for media, trade, fashion, tourism and logistics. The Bay Area is successful in industries like software, venture capital and AI.
San Diego adds biotech and defense. The Central Valley is leader in food production.
Such combination of industries is the main reason why California can lose people to cheaper states and still remain the largest economy in the country.
Texas is the only serious challenger by total size. Its $2.904 trillion economy is still $1.347 trillion smaller than California’s, but Texas has a wider growth formula than it had a generation ago.
Oil and gas still take large portion of economy of this state. So do refineries, ports, trucking, housing, semiconductors, corporate offices, defense, data centers and population growth.
New York remains third, and its economy is different. It is not growing like Florida or Texas, but it produces enormous value from finance, law, media, real estate, insurance, consulting, universities and corporate headquarters.
New York’s GDP per resident reached $123,369 in 2025, the highest among states.
Florida is the state changing the ranking fastest below the top three. Its $1.835 trillion economy is now larger than every Midwestern state except Illinois, and larger than the combined economies of Massachusetts, Connecticut, New Hampshire, Maine, Rhode Island and Vermont.
Florida’s growth is tied to population movement, construction, health care, finance, tourism, logistics, retirees with income and a large service economy. We already shared a story about the popularity of Florida for domestic migration.
The Smallest Economies Are Not Always the Weakest

Vermont had the smallest economy in the ranking at $48.350 billion. Wyoming followed at $52.622 billion, and Alaska came next at $75.012 billion. Their combined output was about $176 billion, less than Arkansas alone.
That sounds dramatic, but total GDP is not a living standard. Wyoming and Alaska both had GDP per resident above the national figure. A small number of people can generate high output when energy, mining or federal spending is involved.
Vermont tells a different story. Its economy is small because the state is small, older and slower growing. It does not have the large metro markets of the coasts, the migration boom of the South, or the resource base of Alaska and Wyoming. Its GDP per resident was below the national figure, but not near the bottom.
The real weak spots appear when total GDP and GDP per resident are both low. Mississippi, West Virginia and Arkansas sit near the bottom in output per resident. That points to a thinner base of high wage work, lower business density and fewer large productivity clusters.
GDP per Resident Shows Where Output Is Most Valuable
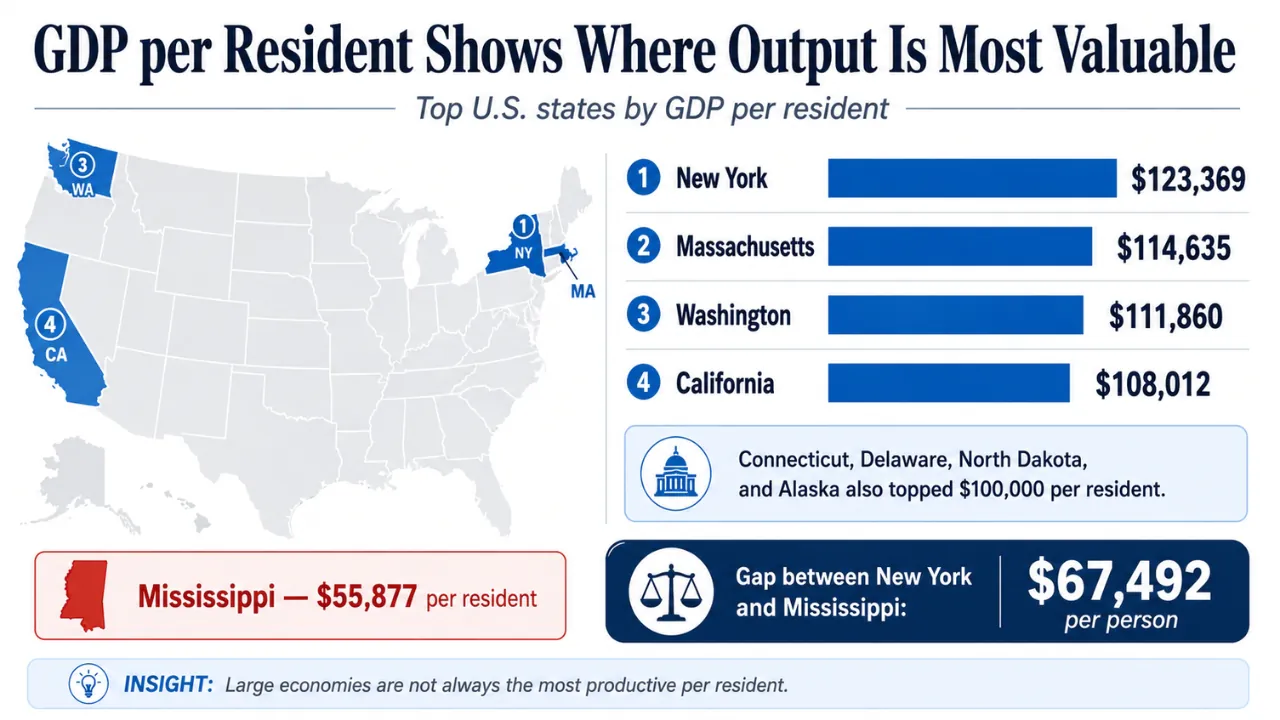
New York ranked first among states by GDP per resident at $123,369. Massachusetts ranked second at $114,635. Washington ranked third at $111,860. California ranked fourth at $108,012. Connecticut, Delaware, North Dakota and Alaska also crossed $100,000.
Those numbers explain why the biggest state is not always the most productive state. Florida has a much larger economy than Massachusetts, but Massachusetts produces far more per resident.
Texas has a much larger economy than Washington, but Washington produces more per resident because its technology and cloud software base creates large output with a smaller population.
Washington is a useful example. Its total GDP ranked ninth, but its GDP per resident ranked third among states. That is the power of a high value technology cluster. The same tech economy also creates hard questions about jobs, pay and layoffs, which we covered in our report on Microsoft executive pay and tech layoffs.
Mississippi sat at the other end at $55,877 per resident. The gap between New York and Mississippi was more than $67,000 per person. That is not a small cost of living difference. It is a different level of output per resident.
Personal Income Tells a Second Story
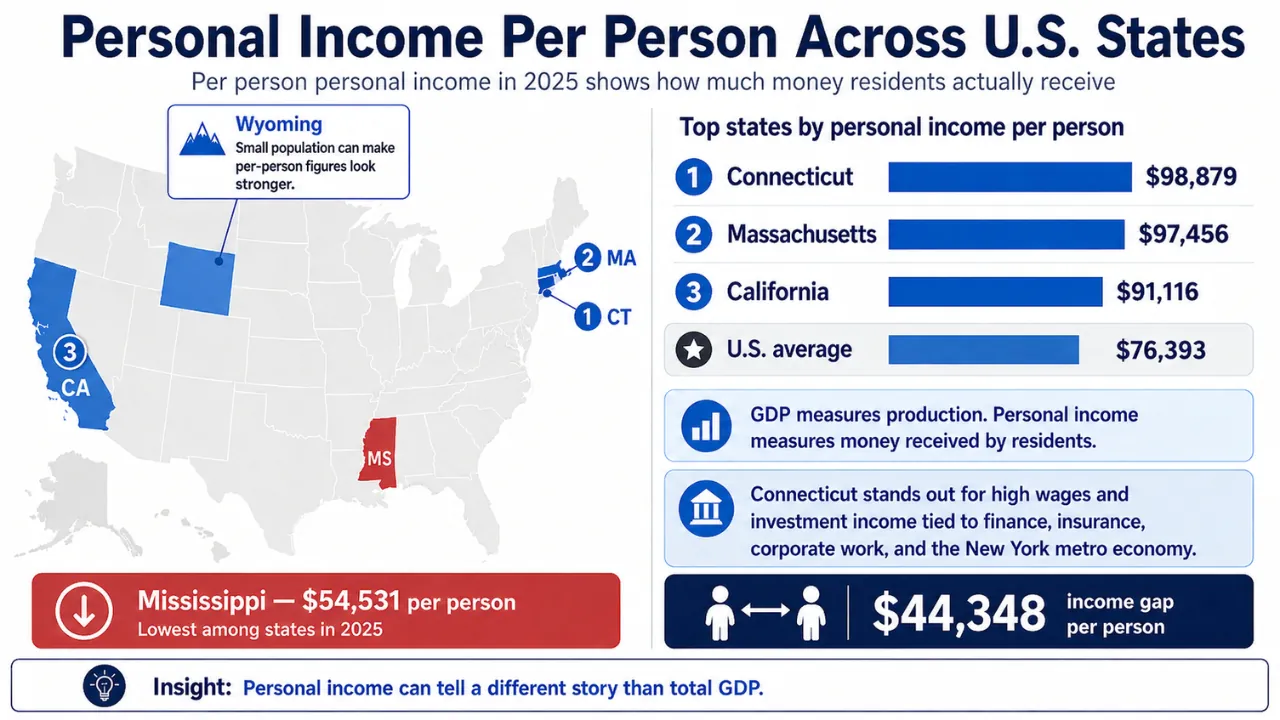
GDP measures production inside a state. Personal income measures money received by residents. The two often move together, but not always.
In 2025, US per person personal income reached $76,393. Connecticut led the states at $98,879. Massachusetts followed at $97,456. California reached $91,116. Mississippi ranked last at $54,531, according to state personal income data from BEA through FRED.
Connecticut is the clear example of income strength. It does not rank near the top by total GDP, but it ranks near the top by personal income because many residents earn high wages or receive investment income tied to finance, insurance, corporate work and the New York metro economy.
Wyoming is the perfect example of how population size can change the whole picture. Its total economy is one of the smallest in the country, but because the state has so few residents, the numbers look much stronger when measured per person.
Mississippi is the warning sign in the ranking. The state sits near the bottom for output per person, and residents also receive less income than in any other state. That means the problem is not just the size of the economy. It is also the amount of money people actually take home.
Labor Markets Do Not Follow the GDP Ranking
A large economy does not guarantee a tight labor market. California ranked first by GDP, but its unemployment rate was 5.3% in May 2026. Washington ranked ninth by GDP and third by GDP per resident, but its jobless rate was 5.2%. Nevada and Oregon were also at 5.2%.
At the other end, South Dakota had the lowest unemployment rate in the country at 2.1%. North Dakota was next at 2.4%, and Hawaii followed at 2.5%.
The national rate was 4.3%, according to the BLS state unemployment ranking for May 2026.
However, high GDP can mean high productivity, but not easy access to jobs. A high output state may still have expensive housing, skills gaps, uneven hiring or industries that generate large profits without hiring huge numbers of workers.
Low unemployment can also hide problems. A small state can have a tight labor market because its population is small or aging. That does not automatically mean wages are high or the economy is growing fast.
The Sun Belt Is Gaining More Economic Power

The biggest long term movement in the ranking is the rise of the South and interior West. Texas, Florida, Georgia, North Carolina, Arizona, Tennessee, South Carolina and Utah are not identical economies. They share one advantage. People and companies keep moving into them.
Population growth feeds GDP in simple ways. New residents need homes, doctors, restaurants, cars, schools, insurance, warehouses, electricians and local services. That creates work before a state even reaches the more advanced stage of high wage innovation.
Florida is the strongest case. It already ranks fourth by GDP, and its economic model is no longer just tourism. Construction, health care, finance, real estate, logistics and household spending are now major drivers.
North Carolina and Georgia are next tier states with national weight. North Carolina has banking, research, universities, pharma, manufacturing and fast growing metros. Georgia has Atlanta, the airport, ports, film, logistics, manufacturing and corporate services.
South Carolina is smaller, but its 2025 performance was one of the clearest growth signals in the table. Manufacturing, ports, autos, aerospace and in migration are giving the state more weight than its size would suggest.
Consumer Spending Grew Fastest in Florida and Slowest in Mississippi

The latest full state consumer spending release covers 2024, but it still helps explain the 2025 GDP map.
Personal consumption expenditures increased in every state and the District of Columbia. Florida had the fastest growth at 7.0%. Mississippi had the slowest at 4.3%. National growth was 5.6%, based on BEA state consumer spending data.
Florida’s spending growth is the demand side of its GDP story. More people means more grocery spending, rent, home repairs, medical visits, insurance, restaurants and local services. That spending creates a loop. Businesses follow the people, and people follow the jobs and lifestyle.
Mississippi’s weaker spending growth fits the income picture. A state with lower household income has less consumer firepower. That limits the speed at which local services can lift total output.
Consumer spending also separates Florida from some resource states. Oil and gas can add output quickly, but household spending makes growth feel broader on Main Street.
Some Small States Rank Higher when GDP Is Measured per Person

Energy states often have high GDP per resident because a small workforce can produce valuable output. North Dakota, Alaska and Wyoming all show that pattern. They rank near the bottom by total GDP, but much higher by output per resident.
The tradeoff is volatility. Energy prices, drilling cycles, federal land rules, global demand and pipeline constraints can move a state economy quickly. North Dakota is the clearest warning.
It had very high GDP per resident in 2025, but real GDP growth was weak for the year. A resource boom can lift a state fast, and a slower commodity cycle can cool it just as fast.
Texas avoids some of that risk because it is not only an energy state. Energy is still central, but Texas also has housing, semiconductors, ports, logistics, data centers, finance, corporate relocation and health care. That mix makes it more resilient than smaller energy dependent states.
New Mexico is another state to watch. Its GDP is not large compared with Texas, but energy output and federal lab activity give it more strategic importance than its ranking suggests.
Innovation Hubs Still Have the Highest Ceiling

States known for companies and institutions related to technology and research still have the highest ceiling.
California, Washington and Massachusetts rank near the top because software, AI, biotech, cloud computing, universities, venture capital, patents and professional services create large output without requiring the same land footprint as older heavy industry.
However, the model has a weakness. High productivity pushes up wages, land values and housing costs. A state can create enormous wealth and still push ordinary workers out of its best job markets.
That is why Texas, Florida, Arizona and North Carolina keep gaining attention. They do not yet match California or Massachusetts in output per resident, but they offer more room, lower costs and faster population growth.
In the first quarter of 2026, real GDP increased in 46 states and the District of Columbia. Washington led the country with 4.5% annualized growth, and BEA said information was the leading contributor to that increase.
South Dakota had the weakest state result at minus 1.6%, with agriculture, forestry, fishing and hunting driving the decline in first quarter 2026 state GDP.
Changes We Are Seeing in 2026
The national economy grew at a 2.1% annual rate in the first quarter of 2026. BEA said investment, exports, government spending and consumer spending contributed to the increase.
Information, federal government, professional and technical services, and durable goods manufacturing were among the leading industry contributors.
| Q1 2026 | What happened | Note |
| US real GDP | Up 2.1% annualized in Q1 2026 | National growth improved after a weak Q4 2025 |
| State growth spread | 46 states and DC grew | Growth was broad, not limited to one region |
| Washington | Fastest state growth at 4.5% | Information services gave the state a lift |
| South Dakota | Weakest state result at minus 1.6% | Agriculture weighed on output |
| Private demand | Final sales to private domestic purchasers rose 1.7% | Growth was positive, but not booming underneath |
New Business Applications Point to Future Growth
GDP is a rear view number. Business formation gives a look at what may be coming next.
U.S. Business Applications, May 2026: Trends Remain Solid – Total business applications increased by 3.7% to 523,971. High-propensity business applications declined slightly by 0.3% to 146,555.https://t.co/q8gR6syMOn
— SBE Council (@SBECouncil) June 19, 2026
In May 2026, the US recorded 523,971 business applications, up 3.7% from April. High propensity applications, the kind more likely to become employers, totaled 146,555. The South had 235,550 total applications, more than any other region, and 62,662 high propensity applications, according to the Census Bureau business formation report for May 2026.
That is another reason the South keeps gaining economic weight. It is not only adding people. It is generating a large pipeline of new firms. Many applications will never become employers, but enough do to matter over time.
The business formation data also explains why state GDP rankings change slowly but not permanently. A state with a big economy can hold its rank for years. A state with strong population growth, business formation and income growth can climb one tier at a time.
Manufacturing Is Shifting, Not Disappearing
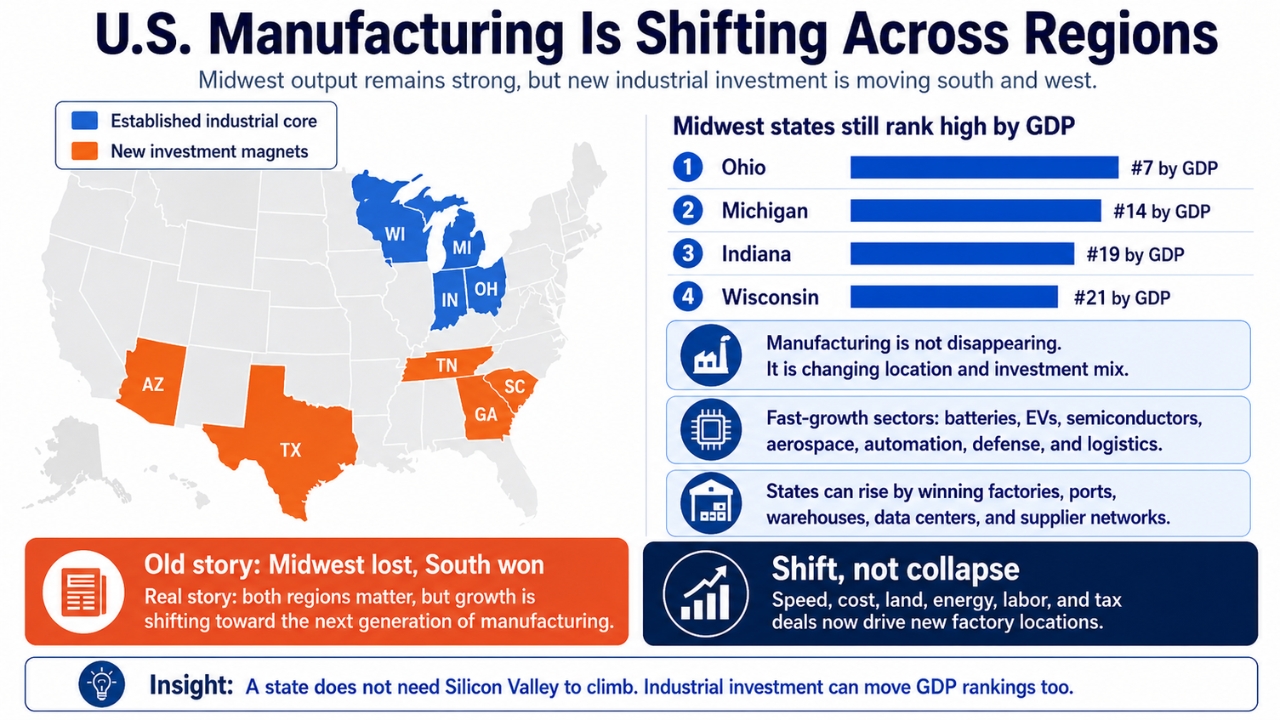
The old story says the Midwest lost manufacturing and the South gained it. The real story is more complicated. Michigan, Ohio, Indiana and Wisconsin still produce large industrial output. The difference is speed, cost and investment mix.
Ohio ranked seventh by GDP in 2025. Michigan ranked 14th. Indiana ranked 19th. Wisconsin ranked 21st. Those are serious economies, not leftovers from the past.
The pressure comes from the next generation of manufacturing. Batteries, electric vehicles, semiconductors, aerospace, automation, defense and logistics are being placed where land, energy, labor and tax deals work for companies. That is why South Carolina, Georgia, Tennessee, Arizona and Texas keep drawing attention.
A state does not need to beat California in technology to climb the GDP ranking. It can move up by winning factories, ports, warehouses, data centers and suppliers.
GDP Also Connects to Federal Taxes and Spending

Large GDP states often carry a large federal tax load because they have more high income households and more profitable companies. California, New York, New Jersey, Massachusetts and Connecticut are important in that story. We talked more about that side of the economy in our breakdown of which states contribute the most to federal revenue.
The link between state GDP and federal finances is not perfect. Texas and Florida have huge economies, but their tax profile differs from New York or California because income levels, corporate structure, household wealth and population mix differ.
That is why GDP should not be read as a simple “who pays” ranking. It is an output ranking. Tax contribution depends on income, capital gains, payrolls, corporate profits and federal tax law.
What the Ranking Says About Ordinary People
A state can rank high by GDP and still feel hard for regular households. California, New York, Washington and Massachusetts have strong output, but housing costs can eat into the advantage of high wages.
A lower cost state can feel better for many households even with lower GDP per resident. That is part of the appeal of Texas, Florida, Tennessee, Georgia and the Carolinas. More people can buy homes, start businesses or move for work without needing coastal level wages.
Income data adds another layer. We separately examined middle class income by state, which is often a better way to understand what daily life feels like than GDP alone.
GDP tells how much value a state produces, but not how affordable the state is, can you live a normal life with your paycheck, or how secure workers feel.
Final Verdict
@topcomparison01 GDP of Every U.S. State (2000-2026) #usa #economy #usstates #statistics #financetok ♬ original sound – topcomparison01
California still has the largest state economy in the country. Texas is second, and the gap between the two remains large. New York is third by total GDP, but it still produces more per resident than any state.
Florida is the state that has changed the most among the largest economies. Its growth is no longer only about tourism. Population growth, construction, health care, finance, real estate and local spending have pushed it closer to the top tier.
Washington and Massachusetts show the strength of technology, research, universities and professional services. They are not as large as Texas or Florida, but they produce far more per resident.
South Carolina shows how a smaller state can move up when manufacturing, ports, population growth and business investment work together. It does not need to be one of the biggest states to matter in the GDP data.
The ranking also shows why total GDP is only one part of the story. A large economy is not always easy for workers. A small economy is not always weak. A fast growing state is not always rich. A rich state is not always affordable.
The latest 2026 data points to the same basic divide. States with growing populations, new business activity, housing construction, strong industries and rising local demand have more room to climb. States that rely too much on one industry, one expensive metro area or one short term boom have less room for mistakes.
That is why the GDP ranking is useful. It shows where economic power sits now, and it helps explain which states have enough momentum to keep gaining ground.