Located in the southeastern United States, South Carolina is a relatively small state by area but has a high population density compared to its size.
With a current population of 5,464,160 in 2024 and a growth rate of 1.06%, it ranks 18th in the nation for population growth according to the World Population Review.
According to the 2010 Census, the state had 4,625,364 residents, marking a 15% increase from 2000.
South Carolina shares its borders with North Carolina to the north and Georgia to the south and west, with the Atlantic Ocean forming its eastern boundary.
Key Takeaways
Area and Density
View this post on Instagram
A post shared by Partnership | Progress (@florenceco_economicdevelopment)
South Carolina, with an area of 32,020 square miles, ranks as the 40th largest U.S. state but is the 19th most densely populated, averaging 153.9 people per square mile.
Its largest cities, Columbia (133,803 residents) and Charleston (132,609 residents), are followed by North Charleston (108,304 residents).
While city-proper populations may appear small due to state laws on unincorporated areas, metropolitan areas like Greenville-Spartanburg-Anderson account for 1.4 million people.
The most populous counties, Greenville (506,837 residents) and Richland (411,592 residents), continue to experience steady growth.
Age Distribution
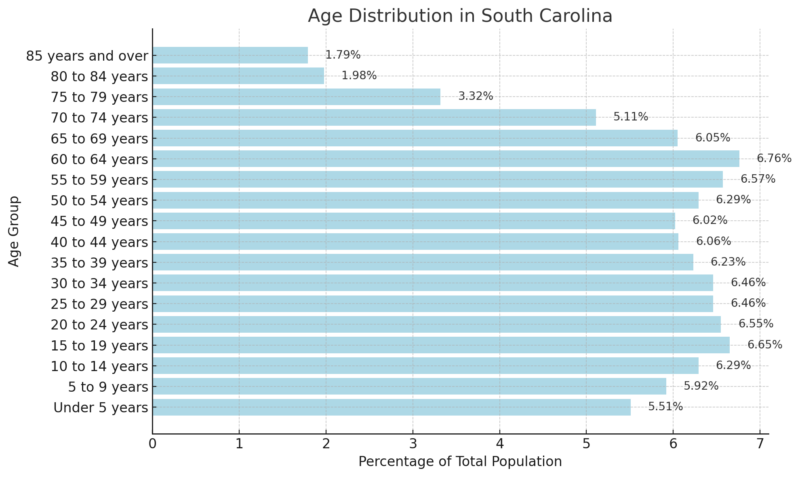
According to the 2018-2022 ACS 5-Year Estimates, South Carolina’s median age is 40.0.
The population distribution shows that 17.72% are under 15 years old, 19.66% are aged 15 to 29, 44.39% fall within the 30 to 64 age group, 16.46% are between 65 and 84, and 1.79% are 85 or older.
Population Pyramid Key Stats
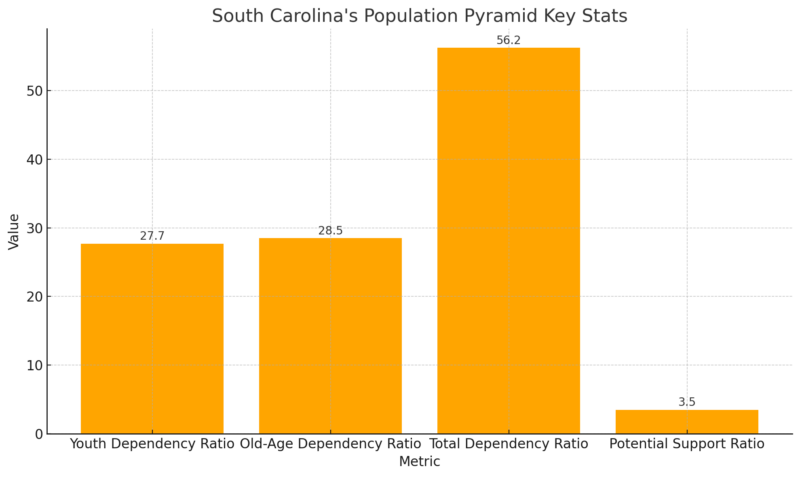
The population pyramid of South Carolina reflects a balanced dependency structure, with a youth dependency ratio of 27.7 and an old-age dependency ratio of 28.5, indicating that both younger and older age groups rely significantly on the working-age population.
The total dependency ratio of 56.2 means there are approximately 56 dependents (youth and elderly combined) for every 100 working-age individuals, which is typical for a developed state.
The potential support ratio of 3.5 suggests that for every elderly individual, there are about 3.5 working-age people available to support them, highlighting a manageable but aging demographic trend.
Ethnic and Racial Diversity
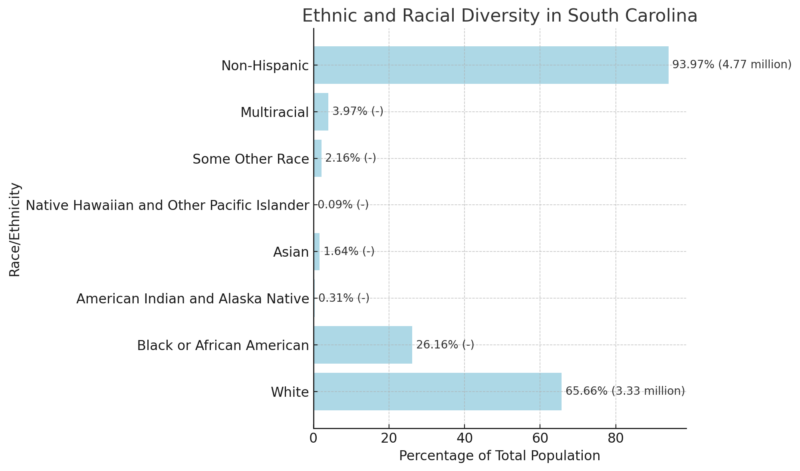
South Carolina’s population is predominantly White, making up 65.66% of the state’s total population, or 3.33 million people as per Neilsberg’s article.
The second-largest racial group is Black or African American at 26.16%, followed by smaller percentages of other racial groups.
Ethnically, 6.03% of the population, or 306,230 individuals, identify as Hispanic or Latino, while the majority (93.97%) are Non-Hispanic.
The state’s increasing racial and ethnic diversity reflects broader national trends in demographic change.
South Carolina County Population Statistics (2024)
County
Population
Growth Rate (%)
Area (sq. miles)
Population Density (per sq. mile)
Greenville County
568,227
7.77%
303
723
Charleston County
429,384
4.75%
354
468
Richland County
428,750
3.15%
292
566
Horry County
411,809
16.41%
437
363
Spartanburg County
367,448
11.56%
312
455
Lexington County
313,951
6.41%
270
449
York County
302,439
6.48%
263
444
Berkeley County
265,482
14.66%
426
240
Anderson County
216,500
6.03%
276
303
Beaufort County
201,811
7.45%
222
350
Aiken County
180,032
6.42%
413
168
Dorchester County
173,616
7.14%
219
306
Florence County
137,688
0.64%
309
172
Pickens County
137,520
4.43%
192
277
Lancaster County
111,706
15.65%
212
203
Sumter County
104,394
-1.03%
257
157
Orangeburg County
82,539
-1.69%
427
75
Oconee County
82,282
4.44%
242
131
Kershaw County
71,960
9.71%
281
99
Laurens County
69,795
3.20%
275
98
Greenwood County
69,697
0.44%
176
153
Georgetown County
66,793
5.17%
314
82
Darlington County
62,396
-0.72%
217
111
Cherokee County
57,307
1.93%
152
146
Chesterfield County
44,321
2.46%
308
55
Newberry County
39,335
4.25%
243
62
Colleton County
39,168
1.64%
408
37
Jasper County
35,102
20.42%
253
54
Chester County
32,459
0.54%
224
56
Clarendon County
31,081
0.78%
234
51
Williamsburg County
29,669
-4.03%
361
32
Marion County
28,545
-1.86%
189
58
Edgefield County
28,255
10.07%
193
56
Dillon County
27,649
-2.22%
156
68
Union County
26,519
-2.44%
198
52
Marlboro County
25,402
-4.11%
185
53
Abbeville County
24,530
1.09%
190
50
Barnwell County
20,423
-0.79%
212
37
Fairfield County
20,394
-2.36%
265
30
Saluda County
19,262
2.31%
175
43
Hampton County
18,108
-2.20%
216
32
Lee County
15,773
-4.63%
158
38
Calhoun County
14,175
0.43%
147
37
Bamberg County
12,998
-1.98%
152
33
McCormick County
10,141
6.55%
139
28
Allendale County
7,320
-7.74%
157
18
WPR notes that South Carolina is home to 46 counties, with Greenville County being the most populous, boasting 506,837 residents as of 2019, a growth of 11.95% since the last census.
Other highly populated counties include Richland (411,592), Charleston (401,438), Horry (333,268), and Spartanburg (306,854), all of which have grown by at least 6%. Horry County stands out with the fastest growth rate, increasing by 23.23%.
On the other hand, Allendale County is the least populated, with 9,002 residents, reflecting a 13.02% population decline since 2010. Other small counties, such as McCormick, Bamberg, and Calhoun, all have fewer than 15,000 residents and have also experienced population declines.
Rapid growth has been most notable in Horry County (23.23%), Berkeley County (21.77%), and Lancaster County (20.24%), with several others, including York, Beaufort, Charleston, Jasper, and Dorchester, seeing growth rates above 12%. This highlights the dynamic shifts in South Carolina’s population.
Employment Statistics
Metric
May 2024
June 2024
July 2024
August 2024
September 2024
October 2024 (p)
Civilian Labor Force
2,490.1
2,499.9
2,512.9
2,522.5
2,527.3
2,531.3
Employment
2,406.5
2,410.2
2,415.2
2,414.6
2,413.3
2,413.2
Unemployment
83.6
89.7
97.8
107.9
114.0
118.1
Unemployment Rate (%)
3.4
3.6
3.9
4.3
4.5
4.7
From May 2024 to October 2024, South Carolina’s civilian labor force grew steadily from 2,490.1k to 2,531.3k. However, employment levels remained relatively flat, ranging between 2,406.5k and 2,413.2k according to BLS.
Unemployment saw a significant rise during this period, increasing from 83.6k in May to 118.1k in October, driving the unemployment rate from 3.4% to 4.7%. This suggests a growing labor force but a potential slow
Job Openings and Labor Turnover for South Carolina (Seasonally Adjusted, in Thousands)
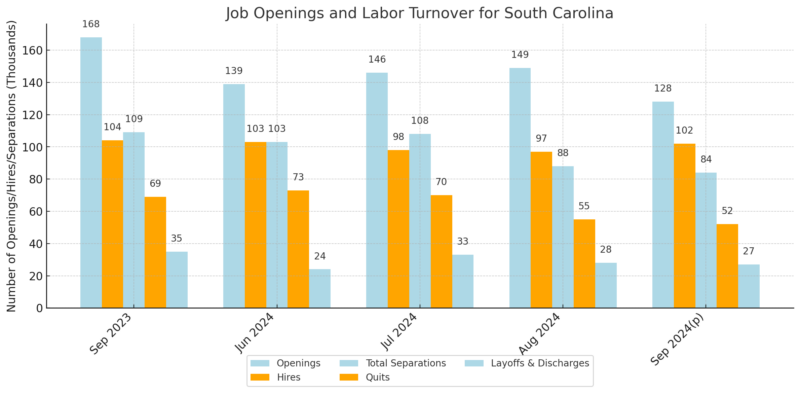
The table shows job market dynamics in South Carolina from September 2023 to September 2024. Job openings decreased significantly from August to September 2024 by 21, while hires increased by 5 according to government sources. Total separations, including quits and layoffs, declined during the same period, reflecting a tightening labor market.
Job Openings and Labor Turnover Rates for the United States (Seasonally Adjusted)
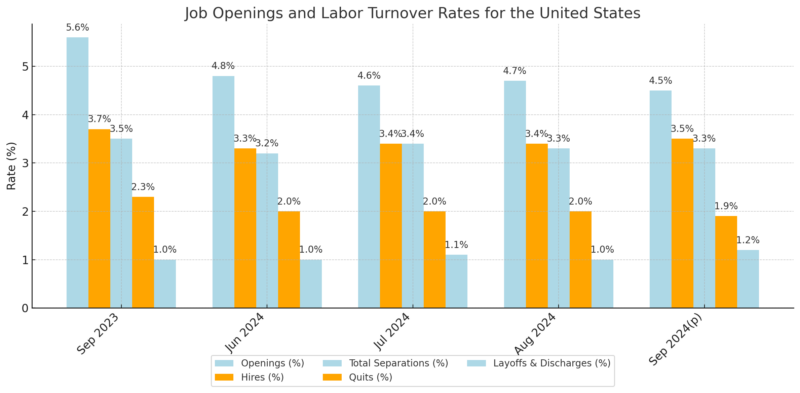
Nationally, job openings and quits rates continued to decline from August to September 2024, reflecting cooling labor market conditions. However, the hires rate showed a slight increase of 0.1 percentage points, while layoffs and discharges rose by 0.2 percentage points, hinting at shifting employment dynamics.
Median Household Income
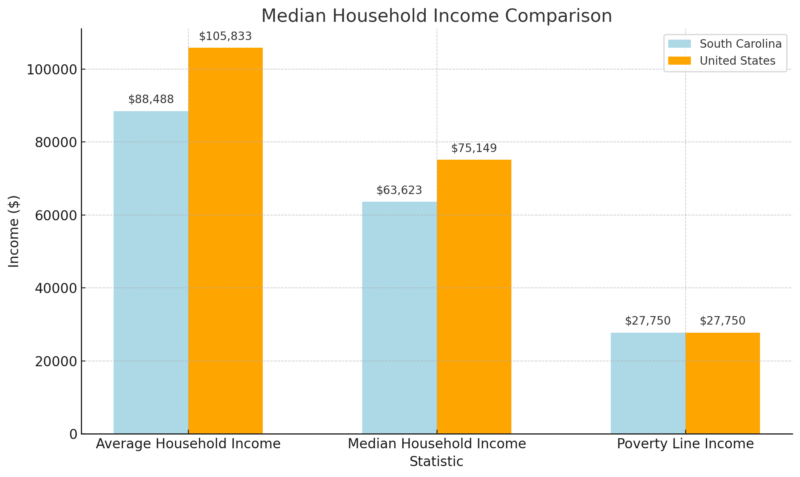
South Carolina’s average household income of $88,488 and median household income of $63,623 fall below the national averages by 16% and 15%, respectively. Despite these differences, the poverty line remains consistent across the state and nation as noted by Income By Zip Code.
These income disparities reflect broader economic conditions, including cost-of-living variations and employment patterns in South Carolina.
Richest Zip Codes in South Carolina (2024)
Rank
Zip Code
Population
Mean Income
Median Household Income
1
29482
2,317
$291,546
$171,838
2
29451
4,378
$273,719
$164,000
3
29915
569
$184,115
$146,349
4
29401
8,895
$174,986
$80,886
5
29492
19,266
$171,485
$104,289
6
29466
43,233
$165,857
$121,840
7
29685
2,038
$159,396
$99,861
8
29928
14,680
$156,741
$95,070
9
29455
25,449
$154,979
$111,300
10
29708
42,028
$154,721
$125,677
The wealthiest zip code in South Carolina is 29482, with an average household income of $291,546.
Most of the richest zip codes are clustered around coastal and metropolitan areas, such as Charleston and Hilton Head.
These areas benefit from high property values, affluent residents, and robust economic activity, including tourism and professional services.
Smaller zip codes with high average incomes often have fewer residents, which may skew income averages upward.
South Carolina Salary Data
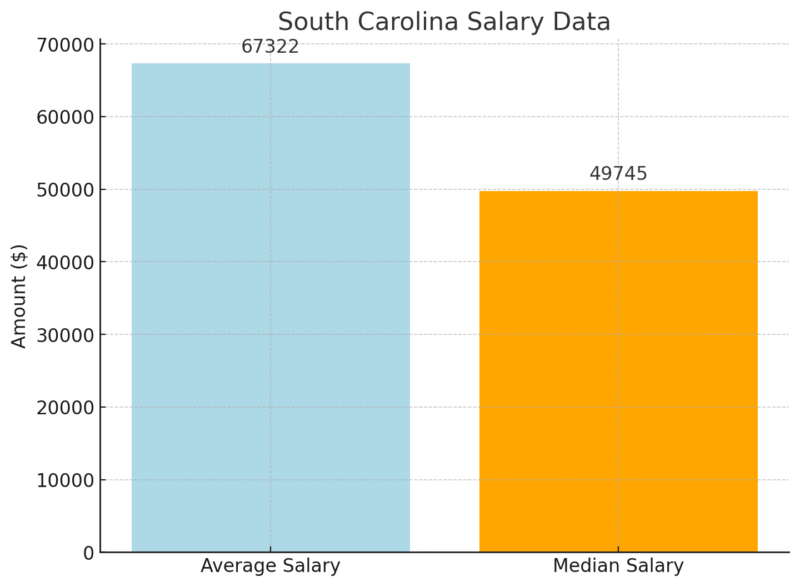
The average salary in South Carolina is $67,322, while the median salary is $49,745.
The gap between the average and median indicates income inequality, with high-earning individuals raising the average.
These figures include earnings from self-employed workers, reflecting a broader income landscape compared to traditional wage datasets.
South Carolina Individual Incomes
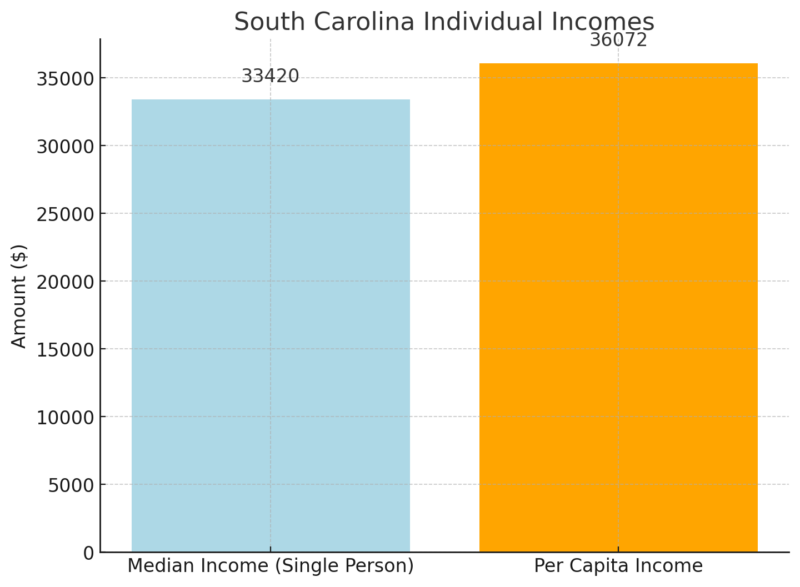
For individuals living alone, the median income is $33,420, while the per capita income is slightly higher at $36,072.
The lower per capita figure is due to the inclusion of non-working populations, such as children and retirees.
This data highlights the financial challenges faced by single households in maintaining economic stability in the state.
Educational Attainment
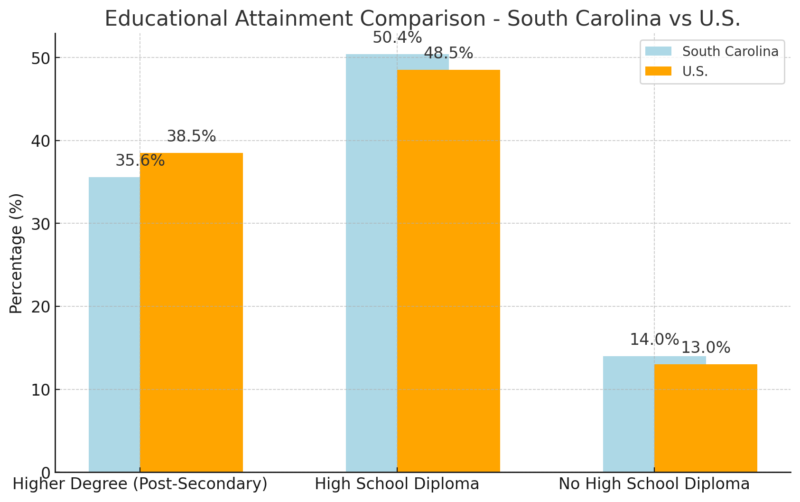
South Carolina has a lower percentage of residents (35.6%) with a post-secondary degree compared to the national average of 38.5%, a gap of 7.5%. This indicates room for improvement in higher education attainment to match national levels as noted by Statistical Atlas.
A slightly higher proportion of South Carolinians (50.4%) have completed high school compared to the U.S. average of 48.5%. This shows the state excels in ensuring basic education access.
The percentage of individuals without a high school diploma in South Carolina (14.0%) exceeds the national average (13.0%) by 7.1%. This highlights a challenge in reducing dropout rates and increasing overall educational attainment.
Migration Patterns
Statistic
Value
Immigrant Share of Population
5.2%
Number of Immigrant Residents
275,500
Immigrant Spending Power
$8.6 billion
Immigrant Taxes Paid
$2.8 billion
Data Year
2022
Immigrants comprise 5.2% of South Carolina’s population, contributing significantly to the state’s economy.
With $8.6 billion in spending power and $2.8 billion in taxes paid, they play a critical role in supporting local communities as noted by American Immigration Council.
This includes $1.1 billion in contributions to Social Security and $283.3 million to Medicare.
Demographics
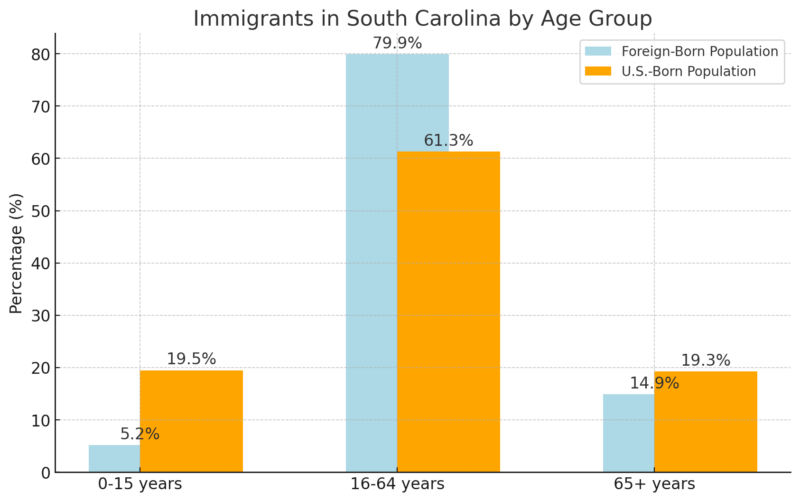
Immigrants in South Carolina are predominantly working-age, with 79.9% falling between 16 and 64 years, compared to 61.3% of U.S.-born residents. This demographic supports the labor force and tax base. Additionally, 82.1% of immigrants are proficient in English, aiding integration into the workforce and community.
Additional Statistics
Value
U.S.-Born Residents with Immigrant Parents
2.8%
Immigrant Women
50.9%
Immigrant Men
49.1%
Immigrant Children
17,200
English Proficiency
82.1% of Foreign-Born
Top Countries of Origin
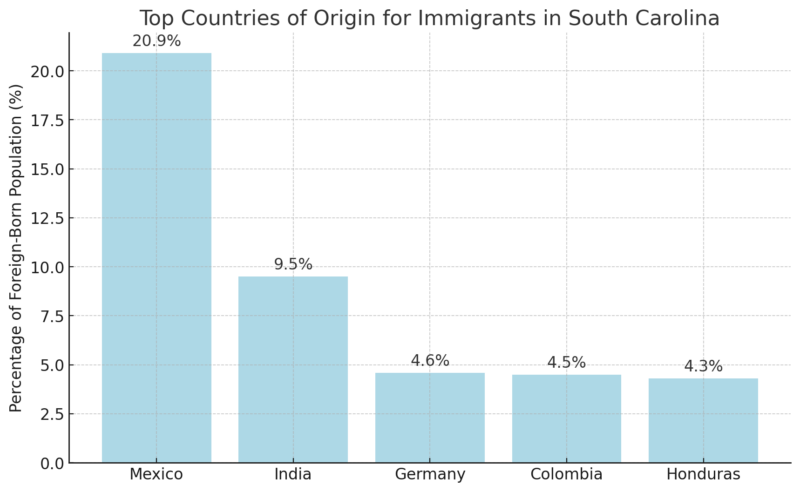
Immigrants in South Carolina come from diverse backgrounds, with the largest share originating from Mexico (20.9%). This diversity contributes to the state’s cultural and economic richness.
Entrepreneurship
Statistic
Value
Share of Entrepreneurs
11.6%
Number of Immigrant Entrepreneurs
28,700
Business Income of Immigrant Entrepreneurs
$791.4 million
Immigrants account for 11.6% of entrepreneurs in South Carolina, generating $791.4 million in business income. Their entrepreneurial efforts drive job creation and economic growth, highlighting their integral role in the state’s economy.
Workforce
Statistic
Value
Share of Workers in Labor Force
6.8%
Number of Immigrant Workers
176,700
Construction Workforce Share
14.4%
STEM Workforce Share
12.0%
Immigrants make up 6.8% of South Carolina’s labor force, filling critical roles in construction (14.4%) and STEM fields (12.0%). Their contributions address labor shortages and support state industries.
Migrant workers boost South Carolina economy, add to population in rural places https://t.co/AOCDt78FVV
— The Post and Courier (@postandcourier) April 9, 2024
Housing Market
Metric
Value
Year-over-Year Growth
Median Sale Price
$382,600
+6.9%
Number of Homes Sold
5,349
-0.24%
Median Days on Market
73 days
+13 days
The median sale price of homes in South Carolina has increased by 6.9% year-over-year to $382,600, indicating steady price appreciation. However, the number of homes sold dropped slightly by 0.24%, and homes are staying on the market 13 days longer compared to last year, signaling a cooling in buyer activity or increased inventory availability.
Housing Supply
Metric
Value
Year-over-Year Growth
Number of Homes for Sale
29,993
+12.4%
Newly Listed Homes
5,885
-5.4%
Months of Supply
4 months
No change
South Carolina’s housing supply has grown significantly, with 29,993 homes on the market, a 12.4% increase from last year. However, newly listed homes have declined by 5.4%, which may impact the long-term housing inventory if this trend persists as noted by Redfin.
The 4 months of supply suggest a balanced market but leaning slightly in favor of buyers due to increased inventory.
Housing Demand
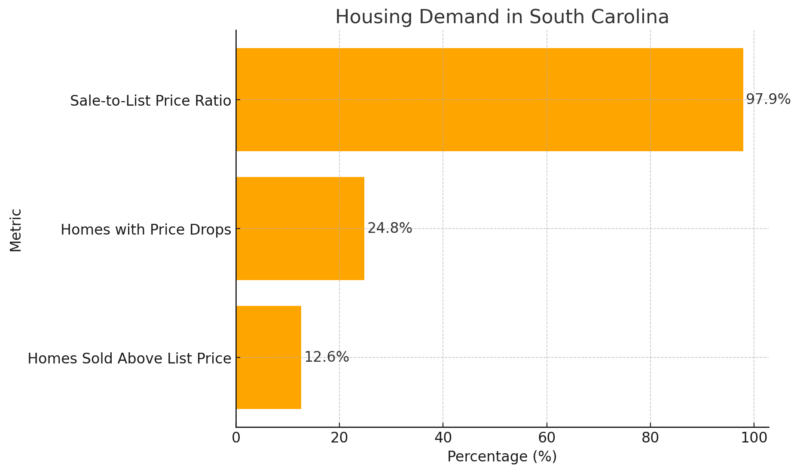
The demand for homes in South Carolina is softening slightly, with fewer homes selling above the list price (12.6%, down 1 percentage point). Additionally, 24.8% of homes experienced price drops, reflecting decreased competition among buyers. However, the sale-to-list price ratio remains strong at 97.9%, suggesting that most homes still sell near their listed price.
Top 10 Metros with Fastest Growing Home Prices (YoY)
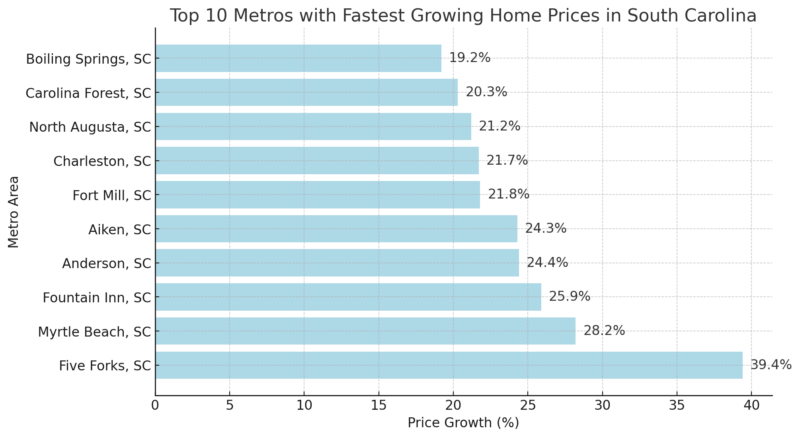
Metro areas like Five Forks (+39.4%) and Myrtle Beach (+28.2%) are experiencing the fastest home price growth, driven by demand for lifestyle amenities and economic opportunities. This sharp price growth indicates strong interest in these markets despite broader signs of a cooling housing market in South Carolina.
Methodology
- Data Sourcing: Compiled data from trusted sources such as ACS, BLS, Redfin, and Census Bureau for accuracy.
- Analysis of Trends: Identified year-over-year changes in population, housing, income, and labor statistics.
- Segmentation: Organized data into clear sections like demographics, housing market, and workforce for readability.
- Comparative Insights: Highlighted South Carolina’s performance relative to national averages.
- Visualization: Translated complex figures into tables and concise key statistics.
- Interpretation: Provided actionable insights and key takeaways to summarize findings.
References:
- World Population Review – South Carolina Population
- Neilsberg – South Carolina Population by Age
- Neilsberg – South Carolina Population: Race & Ethnicity
- Income By Zip Code – Income by Zip Code in South Carolina
- American Immigration Council – South Carolina Immigrant Population
- Bureau of Labor Statistics (BLS) – South Carolina Economic Data
- Redfin – South Carolina Housing Market
- Statistical Atlas – South Carolina Educational Attainment
- The Post and Courier – Migrant Workers Boost South Carolina Economy
- World Population Review – US Counties: South Carolina
Related Posts:
- North Carolina Population 2025 - Key Stats And Insights
- South Dakota Population in 2025 - Key Statistics and…
- Black Population in the United States by County…
- Oklahoma City Population 2025 - Growth Trends and…
- New York City Population 2025 - Key Trends and Forecasts
- San Antonio Population 2025 - How Does Migration…


