Pandemic-era policies, including the Medicaid continuous enrollment provision and enhanced Marketplace subsidies, significantly shaped U.S. health coverage in 2023.
The Affordable Care Act (ACA) expansions, particularly Medicaid and subsidized Marketplace coverage, served as a critical safety net during economic disruptions, contributing to a decline in the uninsured rate through 2022.
While Medicaid disenrollment resumed in April 2023, the full impact was not yet evident by the end of the year.
Extended Marketplace subsidies, in place through 2025, helped maintain most pandemic-era coverage gains.
This analysis, using American Community Survey (ACS) data, examines health coverage trends from 2022 to 2023, compares them to pre-pandemic levels in 2019, and highlights characteristics of the uninsured population ages 0-64.
Table of Contents
ToggleUninsured Population Trends
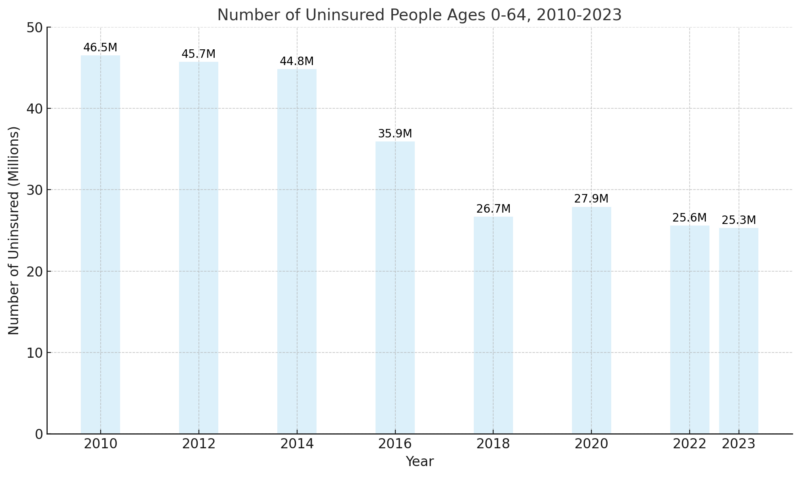
In 2023, the number of uninsured individuals ages 0-64 remained at a historic low of 25.3 million, with an uninsured rate of 9.5%, unchanged from 2022.
Despite the steady rate, both figures reflected significant improvements compared to 2019, when the uninsured rate was 10.9%.
Coverage gains were observed across nearly all demographic groups, with American Indian or Alaska Native (AIAN) and Hispanic individuals experiencing larger increases compared to White individuals.
Additionally, low-income populations and those in working families saw more substantial gains than higher-income groups and families without workers.
However, while uninsured adults ages 19-64 declined, the number of uninsured children increased slightly.
-
Number of uninsured people ages 0-64, 2010-2023
From 2019 to 2023, the uninsured rate declined by 1.4%, largely due to pandemic-era protections, including Medicaid continuous enrollment and enhanced ACA Marketplace subsidies
The Medicaid provision, which required states to maintain enrollment during the pandemic, ended on March 31, 2023, leading to resumed disenrollments, though the full effects were not felt in 2023 as noted by government sources.
Employer-based coverage declined by 0.5% during this period.
In 2023, the uninsured rate for adults ages 19-64 decreased from 11.3% to 11.1%, driven by a rise in Medicaid coverage for this group.
However, the uninsured rate for children increased slightly from 5.1% to 5.3% but remained lower than pre-pandemic levels in 2019. Overall, pandemic-era coverage policies continued to maintain historically low uninsured rates.
Who Is Uninsured?
The Affordable Care Act cut the number of uninsured people in the U.S. by half — but all that progress is at stake in the 2024 election. Read more about the choice at hand, and how it could impact the cost, access, and equity of insurance coverage. https://t.co/QIZZnnaGIJ
— Commonwealth Fund (@commonwealthfnd) November 1, 2024
In 2023, pandemic-era policies such as Medicaid continuous enrollment and enhanced ACA Marketplace subsidies maintained historically low uninsured rates, with 25.3 million individuals ages 0-64 uninsured, representing 9.5% of the population.
While the number of uninsured adults declined, a slight increase in uninsured children offset these gains.
Most uninsured individuals were adults in low-income, working families, with racial and ethnic minorities disproportionately affected. Over 80% of the uninsured had incomes below 400% of the federal poverty level, and nearly three-quarters lived in the South or West.
The high cost of insurance was the primary barrier, with many uninsured lacking access to employer-based coverage or remaining ineligible for Medicaid or Marketplace subsidies, particularly in non-expansion states.
-
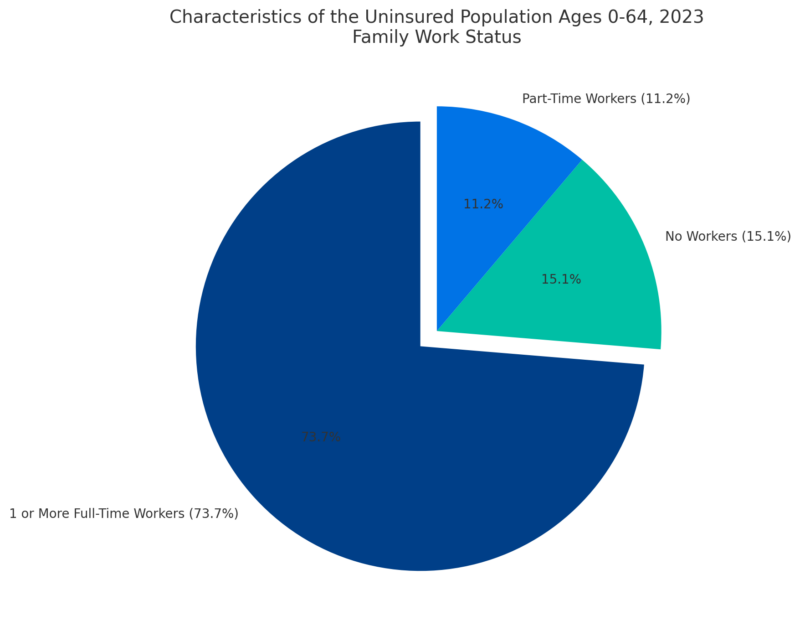
Characteristics of the uninsured population ages 0-64
Uninsured individuals face significant challenges in accessing care, often delaying or forgoing medical services due to cost, leading to poorer health outcomes.
Financial strain was also common, as nearly half of uninsured adults reported difficulty affording health care costs, with many accruing medical debt.
Future risks include potential coverage losses if Marketplace subsidies expire after 2025 or if Medicaid policies change, which could reverse gains and exacerbate disparities in access to care and health outcomes.
Uninsured Rates Among Population Ages 0-64 by Selected Characteristics, 2023
Category
Uninsured Rate (%)
Race and Ethnicity
White
6.5
Black
9.7
Hispanic
17.9
Asian
5.8
AIAN
18.7
NHPI
12.8
Age
Children (0-18)
5.3
Adults (19-64)
11.1
Medicaid Expansion
Expansion states
7.6
Non-expansion states
14.1
Family Income (% FPL)
<200%
15.6
200%+
7.0
Family Work Status
No Workers
13.5
Part-Time Workers
13.0
1 or More Full-Time Workers
9.7
Multiple Full-Time Workers
7.0
Citizenship
U.S. Citizen (Native)
7.5
U.S. Citizen (Naturalized)
8.9
Non-citizen (Resident for <5 years)
31.9
Non-citizen (Resident for 5+ years)
32.0
Why Are People Uninsured?
The primary reason many people are uninsured is the lack of access to affordable health coverage as noted by the CDC.
Most working-age adults rely on employer-sponsored insurance, but not all workers have access to such coverage and many who do find the premiums unaffordable.
Medicaid covers many low-income individuals, particularly children, but eligibility for adults remains restricted in states that have not adopted the ACA Medicaid expansion.
Marketplace subsidies make coverage more affordable for many, but even with subsidies, costs can remain prohibitive for some.
Category
Percentage/Count
Primary Reasons for Being Uninsured
High cost of insurance
63.2%
Ineligibility for coverage
27.0%
Did not want or need coverage
26.6%
Signing up was too difficult
23.9%
Employer Coverage Challenges
Uninsured workers with no employer benefits
64.7%
Increase in family coverage premiums (2014-2024)
52.0%
Increase in worker’s share of premiums (2014-2024)
31.0%
Medicaid Expansion Status
States adopting ACA Medicaid expansion
41 states + DC
Median Medicaid eligibility for parents in non-expansion states
34% FPL
Eligibility for Financial Assistance
Eligible for Medicaid or Marketplace subsidies
14.5 million (58%)
Ineligible for ACA financial assistance
10.9 million (42%)
In 2023, the majority of uninsured adults (63.2%) cited the high cost of insurance as the main reason for being uninsured.
Other reasons included ineligibility (27.0%), not wanting or needing coverage (26.6%), and the difficulty of signing up (23.9%).
Employer-based coverage remains inaccessible for many workers, with 64.7% of uninsured workers employed by companies that do not offer health benefits.
AHCJ states that premiums for employer-sponsored family coverage have risen significantly, outpacing wage growth and straining low-income families.
In states without Medicaid expansion, millions fall into a “coverage gap,” earning too much to qualify for Medicaid but too little to qualify for Marketplace subsidies.
Additionally, lawfully present immigrants face barriers such as a five-year waiting period for Medicaid eligibility.
Despite the financial assistance available under the ACA, not all uninsured individuals qualify for aid.
In 2023, nearly 60% of uninsured individuals (14.5 million) were eligible for Medicaid or subsidized Marketplace coverage, but over 40% (10.9 million) were ineligible due to factors such as their state not expanding Medicaid, immigration status, or lack of access to affordable plans as per NCBI.
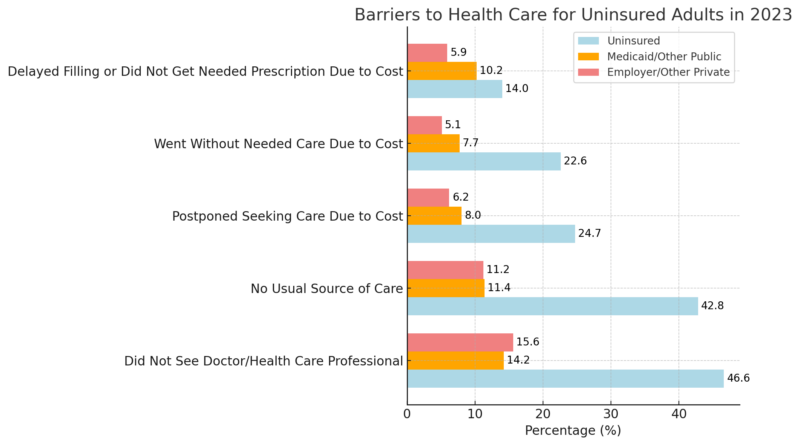
Uninsured Adults Face Significant Barriers to Health Care in 2023

A stark disparity in healthcare access persists between uninsured adults and those with public or private insurance, according to 2023 data.
Nearly half (46.6%) of uninsured adults aged 18-64 did not see a doctor or health care professional, compared to just 14.2% of those with Medicaid or other public insurance and 15.6% with private insurance.
Similarly, 42.8% of uninsured adults lacked a usual source of care, far exceeding the rates among those with Medicaid (11.4%) or private coverage (11.2%).
Financial barriers remain a significant hurdle for the uninsured. Nearly a quarter (24.7%) postponed seeking care due to cost, and 22.6% went without needed care for the same reason.
For those with Medicaid or private insurance, these rates were substantially lower, ranging from 5.1% to 8.0%.
Furthermore, 14.0% of uninsured adults delayed filling or failed to get a necessary prescription due to cost, compared to 10.2% of those with Medicaid and just 5.9% of those with private insurance.
Methodology for Crafting the Article
Analyzed data from the American Community Survey (ACS), CDC, NCBI, and other reputable health policy sources to identify key trends and statistics on U.S. health coverage in 2023.
Incorporated details on Medicaid continuous enrollment and ACA Marketplace subsidies to highlight their role in shaping health insurance coverage trends.
Compare uninsured rates and demographics between pre-pandemic levels (2019), peak pandemic years, and 2023 to provide a comprehensive analysis of changes over time.
Organized information into major themes, such as uninsured population trends, barriers to coverage, and reasons for being uninsured, supported by quantitative data.
Included perspectives from various demographic groups, insurance statuses, and expert sources to ensure an accurate, holistic view of the state of health insurance in 2023.
References
- Medicaid.gov – Unwinding and Returning to Regular Operations After COVID-19
- CDC – Health Insurance Coverage: Early Release of Estimates From the National Health Interview Survey
- Shadac – American Community Survey (ACS) Data
- AHCJ (Association of Health Care Journalists) – Report Shows Rising Insurance Costs Erode Workers’ Earnings, Increase Disparities
- NCBI – Barriers to Health Coverage in the United States
Related Posts:
- Why Drug Overdose Deaths Continue to Climb Despite…
- U.S. Uninsured Rate by Year – 9 Key Trends Since 2010
- SSA Targets 15 Million Field Office Visits in 2026,…
- Health Insurance Coverage - National Health…
- Sleep Apnea Affects 80 Million Americans, A Simple…
- US Inflation Rate in 2025 - What's Driving Prices…


