U.S. inflation is no longer moving quietly toward the Federal Reserve’s 2% target.
The latest Consumer Price Index report from the U.S. Bureau of Labor Statistics shows that consumer prices rose 4.2% over the 12 months ending in May 2026. Prices rose 0.5% from April to May on a seasonally adjusted basis.
Core CPI, which removes food and energy, rose 2.9% over the year. That is lower than headline inflation, but still above the Fed’s 2% goal.
Check out the latest CPI report for June 2026.
The story is not the same as in 2022. Supply chains are not collapsing. Stimulus checks are not pushing demand through the economy. The pressure now comes from energy, gasoline, shelter, food, services, high borrowing costs and renewed inflation expectations.
Prices are rising more slowly than they did at the 2022 peak, but they are rising from a much higher base.
Table of Contents
ToggleKey Insights About Inflation Rate in 2026
- Headline CPI rose 4.2% over the 12 months ending in May 2026.
- Core CPI rose 2.9% over the same period.
- Energy prices rose 23.5% over the year.
- Gasoline prices rose 40.5% over the year.
- Food prices rose 3.1% over the year.
- Shelter costs rose 3.4% over the year.
- PCE inflation rose 4.1% over the year in May.
- Core PCE inflation rose 3.4% over the year in May.
- The Fed held its target rate at 3.50% to 3.75% in June.
The May 2026 CPI report shows a clear change from the calmer inflation readings seen in parts of 2025.
Energy carried most of the monthly increase. BLS said the energy index rose 3.9% in May and accounted for more than 60% of the increase in the all-items index. Gasoline rose 7.0% in May after seasonal adjustment.
Food also moved higher. Food rose 0.2% in May. Food at home rose 0.1%, and food away from home rose 0.3%.
Shelter rose 0.3% in May. Rent rose 0.4%, and owners equivalent rent rose 0.3%. Housing is still one of the most important inflation categories because it takes up a large share of household budgets.
| Category | Monthly Change In May 2026 | 12 Month Change | What It Means |
| All items CPI | 0.5% | 4.2% | Inflation rose faster than the Fed wants. |
| Core CPI | 0.2% | 2.9% | Price pressure remains above target after food and energy are removed. |
| Energy | 3.9% | 23.5% | Energy was the largest source of the monthly increase. |
| Gasoline | 7.0% | 40.5% | Fuel costs are again affecting headline inflation. |
| Food | 0.2% | 3.1% | Grocery and restaurant costs are still rising. |
| Shelter | 0.3% | 3.4% | Rent and housing costs remain a major burden. |
| Apparel | 0.3% | 4.8% | Clothing prices are now rising faster than overall core goods. |
| Medical care services | 0.5% | 3.6% | Health care costs are adding service inflation. |
The next CPI report, covering June 2026, is scheduled for release on July 14. Until then, May remains the latest official CPI reading.
PCE Inflation Shows The Same Problem
CPI is the number most people see in headlines. The Federal Reserve pays close attention to PCE inflation because it captures consumer spending patterns in a different way.
The Bureau of Economic Analysis reported that the PCE price index rose 4.1% over the 12 months ending in May 2026. Core PCE rose 3.4%.
PCE inflation also rose 0.4% from April to May. Core PCE rose 0.3%.
| Measure | May 2026 Monthly Change | May 2026 Year Over Year Change | Why It Matters |
| CPI | 0.5% | 4.2% | Most common household inflation measure. |
| Core CPI | 0.2% | 2.9% | Shows inflation without food and energy. |
| PCE price index | 0.4% | 4.1% | Fed’s preferred broad inflation measure. |
| Core PCE price index | 0.3% | 3.4% | Key number for Fed policy decisions. |
The PCE report also showed a personal saving rate of 3.0% in May. That is a weak cushion for households facing higher prices, higher card rates and higher insurance bills.
What Is Driving Inflation In 2026?
Inflation in 2026 has several clear sources.
Energy is the most visible. Gasoline moved sharply higher in the May CPI report. AAA listed the national average for regular gas at $3.846 on July 9, 2026. That was below the spring peak, but still high enough to affect drivers and delivery costs.
Housing is the slower problem. Shelter inflation does not jump as quickly as gasoline, but it stays in the index for longer. Rent and owners equivalent rent both rose in May.
Food has cooled from the worst of the pandemic inflation period, but it has not stopped rising. Grocery prices rose 2.7% over the year. Restaurant prices rose 3.5%.
Services are still sticky. Medical care, personal care, recreation, airline fares and communication rose in May. Service prices often depend on labor, rent, insurance and financing costs.
| Inflation Driver | What Is Happening In 2026 | Who Feels It First |
| Gasoline and energy | Energy rose 23.5% year over year in the May CPI report. | Drivers, commuters, delivery services and lower income households. |
| Housing | Shelter rose 3.4% year over year, with rent still rising. | Renters, first-time buyers and households in high-cost metros. |
| Food | Food rose 3.1% year over year, with restaurants rising faster than groceries. | Families, retirees and workers eating away from home. |
| Medical care | Medical care services rose 3.6% year over year. | Older adults, families with chronic illness and workers with high deductibles. |
| Apparel | Apparel rose 4.8% year over year. | Families with children and workers who need uniforms or office clothing. |
| Interest rates | Borrowing costs remain high after the Fed’s rate hikes. | Homebuyers, credit card borrowers, auto buyers and small businesses. |
Why Inflation Feels Worse Than The Headline Number?
The inflation rate measures how fast prices are rising now. It does not show how much prices already rose.
A lower inflation rate does not mean prices went back down. It means prices are rising more slowly than before.
That distinction explains the frustration. A family that paid higher grocery, rent and utility bills through 2022, 2023, 2024 and 2025 is not starting from a clean budget in 2026.
The May real earnings report from BLS shows the strain. Real average hourly earnings fell 0.8% from May 2025 to May 2026. Real average weekly earnings fell 0.2% over the same period.
- Inflation slowing does not mean prices are lower.
- A 4.2% CPI rate means prices are still rising.
- Energy and food changes hit cash flow quickly.
- Rent changes last longer because leases adjust slowly.
- High interest rates make debt more expensive even if some goods stop rising.
- Real wage declines make the same paycheck buy less.
How 2026 Compares With The Last Inflation Spike
The 2022 inflation peak was broad and sudden. Energy, food, cars, rent, goods and services all moved together.
The 2026 problem is different. Supply chains are better. Used cars are not the same problem they were during the pandemic. New vehicles were down 0.3% in May. Used cars and trucks rose only 0.1% in May and were down 2.0% over the year.
The pressure has moved toward energy, housing, services and household debt.
| Period | Main Inflation Story | Household Effect |
| 2020 | Demand fell during the pandemic shock. | Prices were calm, but jobs and income were unstable. |
| 2021 | Reopening demand ran into supply shortages. | Cars, goods and home products became more expensive. |
| 2022 | CPI hit 9.1% in June after energy, food and goods surged. | Inflation became the main economic issue for households. |
| 2023 | Energy and goods cooled, but rent and services stayed firm. | Price increases slowed, but budgets stayed strained. |
| 2024 | Inflation moved closer to normal but did not fully return to target. | Higher price levels became the new baseline. |
| 2025 | Inflation looked more controlled in several months. | Debt costs, rent and insurance kept pressure on households. |
| 2026 | Energy and headline inflation rose again, with core PCE still above target. | Households face higher prices and high borrowing costs at the same time. |
Energy Is Back In The Story
Gasoline can change the inflation picture quickly because fuel prices move faster than rent or medical costs.
BLS reported that gasoline rose 7.0% in May after seasonal adjustment. Before seasonal adjustment, gasoline rose 8.6% in one month. Over the year, gasoline rose 40.5%.
Energy affects households directly through gas, electricity and utility bills. It also affects businesses through transport, delivery, refrigeration, manufacturing and travel.
AAA reported on July 2 that the national average had fallen nearly 50 cents from a month earlier to $3.83 per gallon, after peaking at $4.56 on May 21. That decline helped drivers, but it did not erase the earlier shock.
| Energy Item | May CPI Monthly Change | May CPI 12 Month Change |
| Energy | 3.9% | 23.5% |
| Gasoline | 7.0% | 40.5% |
| Electricity | 0.6% | 5.9% |
| Utility gas service | -0.5% | 3.0% |
Energy can cool quickly if oil and gas prices fall. It can also rise again if refinery problems, weather, war risk or shipping disruptions hit supply.
Housing Is Another Problem
Housing inflation usually changes slowly.
New rents can cool before CPI shelter shows the full effect. That delay happens because the CPI shelter index captures a broad stock of leases and owners equivalent rent, not only new leases signed during the month.
In May, shelter rose 0.3%. Rent rose 0.4%. Owners equivalent rent rose 0.3%. Shelter was up 3.4% over the year.
A 3.4% shelter increase is lower than the peak, but rent and mortgage costs are already high. A household looking for a new apartment or buying a home does not feel much relief from slower inflation if the starting price is unaffordable.
Housing also connects to insurance. Our report on homeowners insurance rates shows why insurance has become part of the inflation burden in many states.
Food Inflation Has Cooled But Not Disappeared
Food inflation is no longer running at the extreme rates seen in 2022.
That does not make groceries cheap.
Food rose 3.1% over the year in May. Food at home rose 2.7%. Food away from home rose 3.5%.
Several grocery groups moved in different directions. Fruits and vegetables rose 6.1% over the year. Nonalcoholic beverages rose 5.8%. Dairy fell 1.0%.
| Food Category | 12 Month Change |
| Food overall | 3.1% |
| Food at home | 2.7% |
| Food away from home | 3.5% |
| Fruits and vegetables | 6.1% |
| Nonalcoholic beverages | 5.8% |
| Meats, poultry, fish and eggs | 1.8% |
| Dairy and related products | -1.0% |
Food is politically sensitive because it is purchased often. A household can ignore a car price for months. It cannot ignore grocery prices for a week.
The Fed Is Not Declaring Victory
The Federal Reserve held its target range for the federal funds rate at 3.50% to 3.75% in June 2026.
The June 17 FOMC statement said the committee maintained the range in support of its dual mandate.
The Fed’s June projections show why policymakers are cautious. The median projection for 2026 PCE inflation rose to 3.6%. The median projection for 2026 core PCE inflation rose to 3.3%.
| Fed Projection | 2026 | 2027 | 2028 |
| PCE inflation | 3.6% | 2.3% | 2.0% |
| Core PCE inflation | 3.3% | 2.5% | 2.1% |
| Unemployment rate | 4.3% | 4.3% | 4.2% |
| Real GDP growth | 2.2% | 2.3% | 2.2% |
| Federal funds rate | 3.8% | 3.6% | 3.4% |
The Fed does not need inflation to hit 2% before changing rates. It does need confidence that inflation is moving there. The latest 2026 data make that confidence harder.
Inflation Expectations Are Rising Again
Inflation expectations matter because they can affect pay demands, pricing decisions and consumer behavior.
The New York Fed’s June 2026 Survey of Consumer Expectations showed that one year inflation expectations rose to 3.7%, the highest level since September 2023. Three year expectations rose to 3.3%, the highest level since June 2022. Five year expectations were unchanged at 3.0%.
| Expectation Horizon | June 2026 Result | What Changed |
| One year ahead | 3.7% | Up 0.2 percentage point from May. |
| Three years ahead | 3.3% | Up 0.2 percentage point from May. |
| Five years ahead | 3.0% | Unchanged. |
That is one of the most important 2026 warning signs. Short and medium term expectations are moving up, even though long term expectations remain steadier.
Debt Makes Inflation More Painful In 2026
Higher prices are bad enough by themselves. Higher interest rates make the pressure worse.
The New York Fed reported that total household debt stood at about $18.8 trillion in the first quarter of 2026. Credit card balances stood at $1.25 trillion. Auto loan balances stood at $1.69 trillion. Student loan balances stood at $1.66 trillion. The data come from the New York Fed’s Q1 2026 Household Debt and Credit report.
Credit cards matter most for daily inflation pressure because rates are high and balances are flexible. Families often use cards to bridge gaps caused by groceries, gas, repairs and medical bills.
High rates also change housing. A family can see inflation slow and still be locked out of the housing market because mortgage payments remain too high.
Who Feels the Inflation Most?
Inflation does not hit all households the same way.
Lower income families spend a larger share of income on food, rent, gas and utilities. Older adults on fixed income depend on benefit adjustments that lag price changes. Renters face lease renewals. Families with children face food, childcare, clothing and transport costs at the same time.
| Group | Main Inflation Pressure In 2026 | Why It Hits Hard |
| Renters | Rent and utility bills | Housing takes a large share of income, and moving is expensive. |
| Commuters | Gasoline and auto costs | Fuel prices change cash flow immediately. |
| Families with children | Food, clothing, childcare and transport | Several essential costs rise at the same time. |
| Retirees | Food, medical care, utilities and insurance | Fixed income adjusts slowly, and health costs are harder to cut. |
| Small businesses | Wages, rent, energy, insurance and borrowing | Costs rise before every business can raise prices. |
| Credit card borrowers | High interest on carried balances | Debt payments can erase savings from lower prices in other areas. |
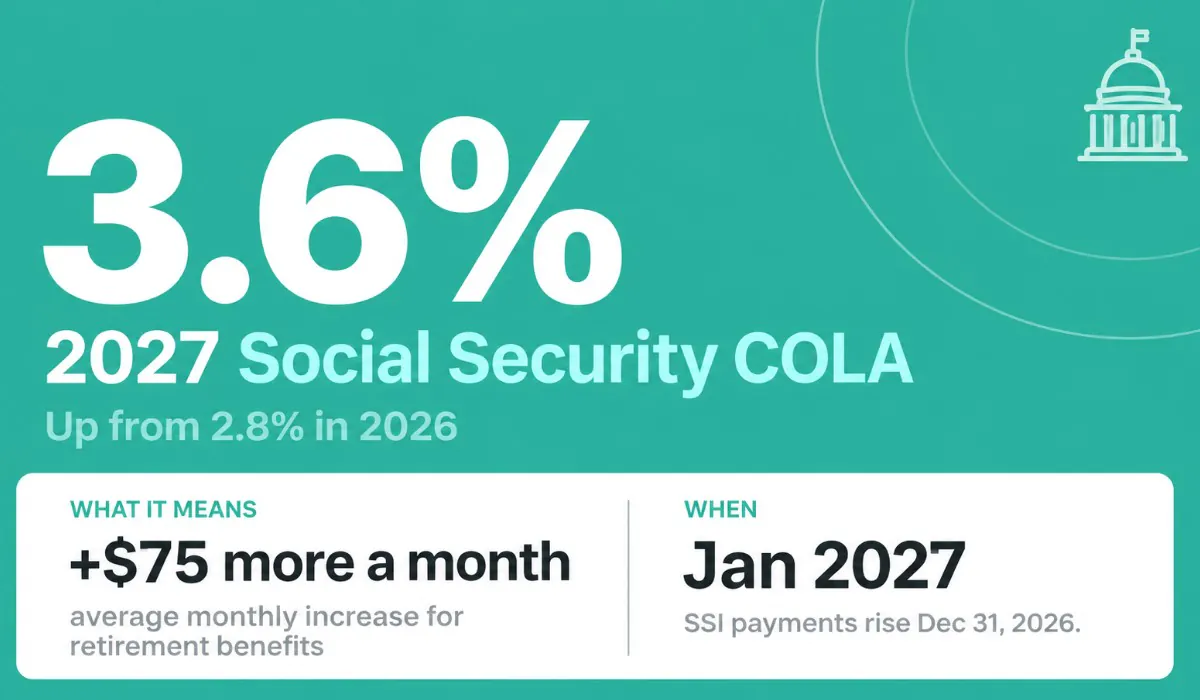
Social Security recipients receive inflation adjustments, but those adjustments look backward. Our latest Social Security COLA projection explains how inflation data feeds into benefit increases.
What Could Push Inflation Higher Again?
The main upside risks are clear.
Energy is first. Oil shocks can hit gasoline, diesel, airfare, shipping and manufacturing.
Tariffs are second. Import taxes can raise prices directly for consumers and indirectly for companies that use imported parts or materials. The inflation effect depends on how much businesses pass through to buyers.
Housing is third. If rent growth does not cool enough, shelter can keep core inflation above target.
Inflation expectations are fourth. Expectations do not set prices by themselves, but they can shape wage bargaining and business pricing.
Labor and services are fifth. A tight labor market can keep service prices moving even when goods inflation is calm.
- Oil and gasoline spikes can lift headline inflation quickly.
- Tariffs can raise prices for imported goods and business inputs.
- Rent can keep core inflation elevated for months.
- Higher inflation expectations can make price increases harder to stop.
- Medical care and insurance costs can keep household inflation above the headline rate.
- Credit card rates can make inflation feel worse even when CPI slows.
What Could Bring Inflation Down?
Inflation could still cool in the second half of 2026.
Gasoline could fall if oil prices stabilize and refinery supply improves. Rent inflation could slow as older leases reset closer to current market conditions. Goods prices could stay soft if inventories improve and demand weakens. High interest rates could keep cooling big purchases.
The Fed’s June projections still show inflation moving lower in 2027 and 2028. That is not a guarantee. It is the central bank’s current median forecast.
| Possible Relief Source | How It Would Lower Inflation |
| Lower oil and gasoline prices | Reduces headline CPI and transport costs. |
| Slower rent growth | Pulls down shelter inflation with a lag. |
| Stable goods prices | Keeps core goods from adding pressure. |
| Weaker demand | Makes it harder for companies to raise prices. |
| Lower inflation expectations | Reduces pressure in wage and price setting. |
| Higher productivity | Lets output grow without the same price pressure. |
What Households Can Do Now?
No household can control the CPI.
Households can still reduce the damage from inflation and high rates.
| Problem | Practical Step |
| Gas prices | Combine trips, compare stations, review commute options and avoid unnecessary premium fuel. |
| Food prices | Plan meals around store sales, switch brands and track restaurant spending. |
| Rent pressure | Compare renewal terms early and check total moving costs before deciding. |
| Credit card debt | Pay down the highest interest balance first after keeping a small emergency fund. |
| Low savings yield | Move emergency cash to a safe account with a competitive rate. |
| Insurance increases | Shop policies before renewal and compare deductibles carefully. |
| Medical costs | Check network rules, use preventive care and compare generic drug options. |
A household budget should be updated with current prices, not old targets. A grocery budget from 2021 can be unrealistic in 2026. The same applies to gas, rent, utilities, insurance and debt payments.
Methodology
This article uses the latest available official inflation data as of July 9, 2026.
The main CPI data come from the BLS May 2026 Consumer Price Index release, published June 10, 2026. The June CPI release is scheduled for July 14, 2026.
PCE inflation data come from the BEA May 2026 Personal Income and Outlays release.
Federal Reserve policy data come from the June 17, 2026 FOMC statement and the June 2026 Summary of Economic Projections.
Consumer inflation expectations come from the New York Fed June 2026 Survey of Consumer Expectations.
Gasoline price context comes from AAA’s July 2026 fuel price data. Household debt context comes from the New York Fed Q1 2026 Household Debt and Credit report.
Bottom Line
U.S. inflation in 2026 is not back at the 2022 crisis point, but it is no longer safely near the Fed’s target.
May CPI rose 4.2% from a year earlier. PCE inflation rose 4.1%. Energy, gasoline, food, shelter and services are keeping pressure on households. Real wages fell over the year. Inflation expectations are rising again.
The main risk is not a repeat of the same pandemic inflation shock. The risk is a new mix of expensive energy, sticky rent, high debt costs and cautious consumers.
For households, the important question is simple. Are wages, savings and debt payments keeping up with the bills that actually arrive each month?
Related Posts:
- Could 2.4 Million New Yorkers See A Rent Freeze This Year?
- FDA To Make Food Additive Safety More Open - What…
- Average American Savings Account Balance In 2026…
- Hims & Hers Pulls Copycat Wegovy Weight Loss Pill…
- SNAP Households Could Get an Extra $60 a Month for…
- Trump Pressures RFK Jr. to Cut Childhood Vaccines as…