

Take a look at the data for average IQ scores across the United States, and you’ll notice the numbers at the bottom of the list usually cluster right around the mid-90s.
According to the latest state-by-state numbers from the average IQ in the USA report, Mississippi currently sits at the very bottom with an average score of 94.2. Louisiana and California aren’t far ahead, coming in at 95.3 and 95.5.
Now, while those figures sit a bit below the national baseline of 98 to 100, it’s a massive mistake to misinterpret them. A lower state average doesn’t mean people from these regions are somehow naturally less capable or less intelligent.
The truth is that standardized test results track much closer to a child’s environment than their actual potential.
Everyday realities like local school funding, childhood nutrition, family income, and basic healthcare access completely dictate how kids perform on these tests.
At the end of the day, these rankings don’t measure raw brainpower. They just expose a blatant lack of equal opportunity.
The Lowest-Ranking States by Average IQ
To see how the numbers shake out, here is the look at the bottom ten states from the dataset:
Bottom 10 US States by Average IQ
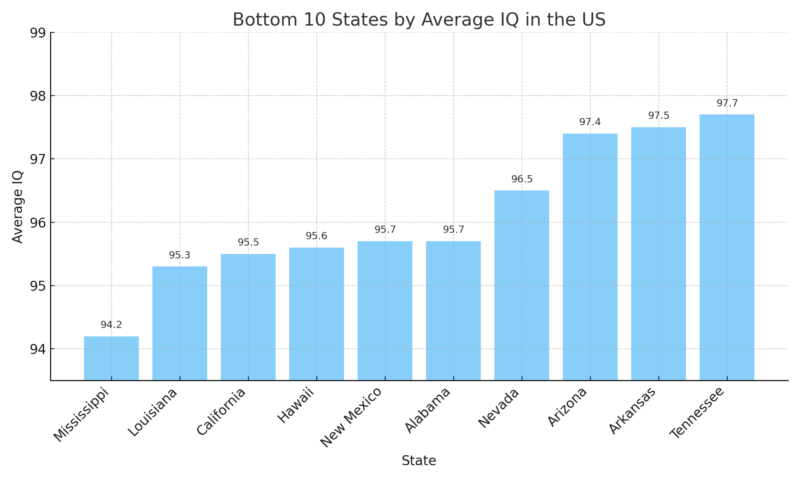
Most states in the country are packed tightly between 97 and 103 points. This means the differences between the highest and lowest states are actually very small. The gap between the top spot (Massachusetts at 104.3) and the bottom spot (Mississippi at 94.2) is only about 10 points.
On a normal distribution curve, these groups overlap heavily. This means there are millions of people living in Mississippi who score much higher than millions of people living in Massachusetts.
The gap is not a vast intellectual divide. It is simply a reflection of everyday conditions like school funding, job markets, and health services.
The Cost of Living is Among Biggest Factors
View this post on Instagram
The local cost of living plays a big role behind these scores. States that rank at the top often have expensive cities that naturally draw in professionals with advanced degrees and specialized skills.
Cost of Living vs. State IQ (U.S. Average = 100)
(Source: Bureau of Economic Analysis, 2024)
State
IQ Rank
Average IQ
Cost of Living Index
Massachusetts
1
104.3
116.0
New Hampshire
2
104.2
109.4
Vermont
4
103.8
110.5
California
48
95.5
139.0
Mississippi
50
94.2
86.1
Alabama
45
95.7
88.3
Key Takeaways:
These numbers show where people move for work rather than how smart they are.
A college graduate finishing an engineering degree or a medical residency is far more likely to move to Boston or Seattle for a job than to rural Mississippi. Over time, these career choices stack up and shift a state’s average score. The IQ averages simply show what kinds of industries are available in the region.
Poverty Levels Shape the IQ Map
Poverty has a massive impact on how children grow up and develop. It affects everything from daily nutrition and housing stability to early education and stress levels, which directly impact how well a person performs on tests later in life.
Child Poverty Rates by State (2024)
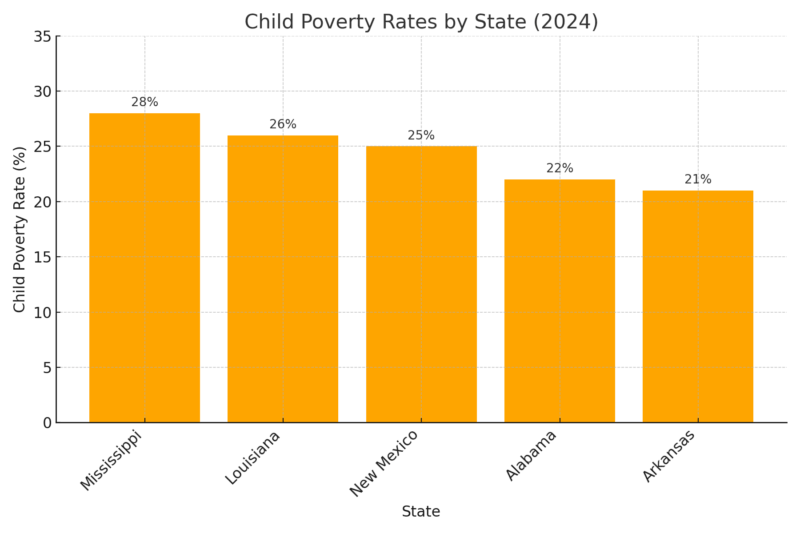
Now look at the child poverty rates in top-ranking IQ states:
- Massachusetts: 11%
- New Hampshire: 10%
- Minnesota: 11%
In states with higher average scores, children are twice as likely to grow up with full access to:
When childhood poverty numbers double, test scores naturally drop. This is a measure of the hardships a child faces, not their natural brainpower.
School Funding Gaps Are Enormous
How much money a state puts into its classrooms is another massive factor behind these test scores.
K–12 Per-Pupil Spending (2024)

According to recent data from the U.S. Census Bureau, Massachusetts spends more than twice as much money per student each year compared to Mississippi.
When a school has double the budget, it can afford:
Underfunded schools are left playing catch-up, and the lower test scores are often unfairly blamed on local intelligence levels.
The Rural vs. City Split
States at the bottom of the IQ list also tend to have much larger rural populations:
Percentage of People Living in Rural Areas
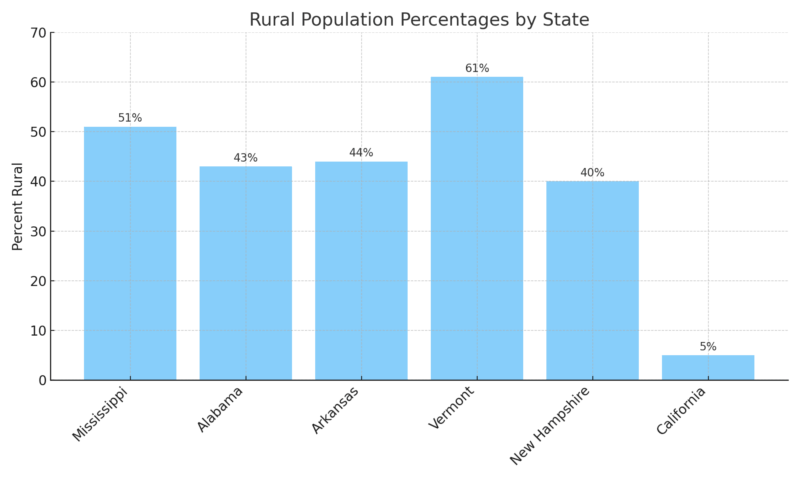
Living in the countryside is not a disadvantage on its own. For example, Vermont is very rural and ranks near the top of the list. However, when rural areas face high poverty, it creates a tough combination of challenges:
Vermont succeeds because its small towns are backed by healthy funding. Mississippi struggles because its rural areas lack that same financial foundation.
“Brain Drain” – How Moving Changes the Averages?

Another major force behind these rankings is what economists call brain drain. States at the top of the list constantly pull in university graduates, while lower-ranking states lose them to better job markets across state lines.
States like Massachusetts, Washington, and Colorado add thousands of college-educated residents every year because they have booming economies, higher salaries, and major tech or research companies.
On the other side, states like Mississippi, Louisiana, and Alabama lose their young professionals and college graduates because they leave to find better-paying jobs elsewhere.
Net Gain or Loss of College-Educated Adults (2023)
State
Net Migration Balance
Massachusetts
+11,000
Washington
+9,400
Colorado
+7,300
Mississippi
–4,700
Louisiana
–5,200
Alabama
–3,600
If a state loses its most educated residents year after year, its overall average test score will drop. This does not mean the people left behind are less intelligent. It just means the local economy is losing human capital.
Healthcare Access – The Hidden Factor
Good health is essential for a growing brain, and healthcare access maps look remarkably similar to the IQ map. States with lower average scores often have the highest numbers of uninsured residents and fewer pediatricians.
For instance, Mississippi has an uninsured rate of around 14 percent, Alabama is at 12 percent, and Texas hits 18 percent. Meanwhile, top-ranking states offer near-universal coverage, with Massachusetts at just 2.5 percent uninsured, Vermont at 3.8 percent, and New Hampshire at 5.3 percent.
Uninsured Rates by State (2024)
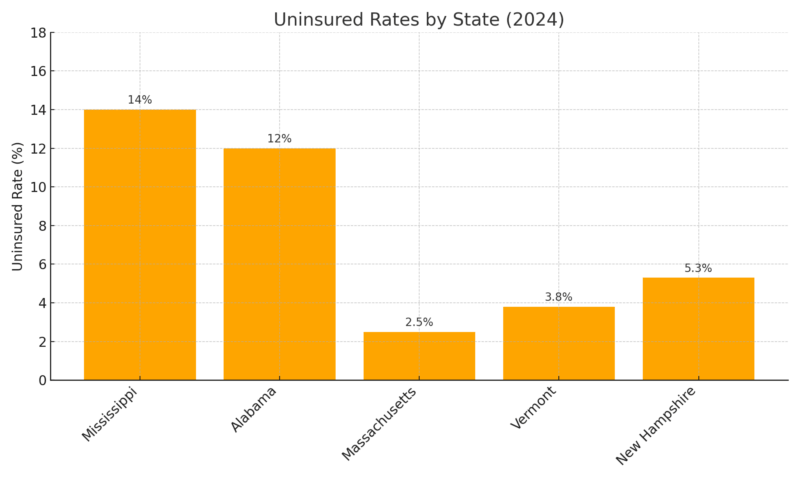
Health issues, poor prenatal care, and missed developmental milestones in early childhood can easily impact future test scores. These numbers reflect the state of local healthcare systems rather than the capability of the residents.
The Final Words
When you put all the pieces together, such as income, school budgets, health access, rural challenges, and job opportunities, it is clear that the deck is stacked unevenly.
Top-ranking states are wealthier, have better-funded public services, and attract highly paid professionals. Lower-ranking states face deep-rooted financial challenges, underfunded classrooms, and limited infrastructure.
A child born in a wealthy school district gets a massive head start in life. A child born in an underfunded, rural community faces an uphill battle from day one. IQ tests show the results of those differences without showing a person’s maximum potential. If every state had the exact same resources and schools, these ranking gaps would likely vanish within a single generation.
The 10-point gap between the top and bottom states is an environmental scorecard. It shows exactly where public investment is working, and where more help is needed.
@rob_roams 10 states with the lowest IQ’s #states #iq #smart #dumb ♬ Epic News – DM Production