

Alabama’s population is on the rise again, but not for the reasons you might expect. According to the latest U.S. Census Bureau estimates, the state added nearly 50,000 residents between 2023 and 2024, bringing the total population to around 5.16 million. Most of that growth didn’t come from births, but from people packing up and moving to Alabama from other states and abroad.
Newcomers, from engineers headed to Huntsville to retirees settling along the Gulf Coast, are reshaping the state’s demographics, economy, and long-term outlook.
The Numbers Behind the Growth
In percentage terms, Alabama grew by about 1% in 2024, a modest but steady increase compared to roughly 0.7% in the years before. The population boost translates to 49,231 more residents in a single year. The data paints a clear picture: migration is doing the heavy lifting, not natural growth.
| Population Component | 2024 Estimate | Context |
| Total Growth | +49,231 | ≈ 1% annual increase |
| Domestic Migration | +26,000 | New residents from other U.S. states |
| International Migration | +16,000 | Growth from foreign-born populations |
| Births | ~58,000 | Roughly stable year-over-year |
| Deaths (2023 data) | ~59,000 | Still exceeding births slightly |
For the third consecutive year, deaths have outnumbered births, a lingering effect of the pandemic years and Alabama’s aging population. Without migration, the state’s population would likely be flat or even declining.
County Growth Stories: North to South Momentum
Population growth in Alabama isn’t evenly spread. Two regions stand out as engines of expansion: Madison County in the north and Baldwin County in the south.
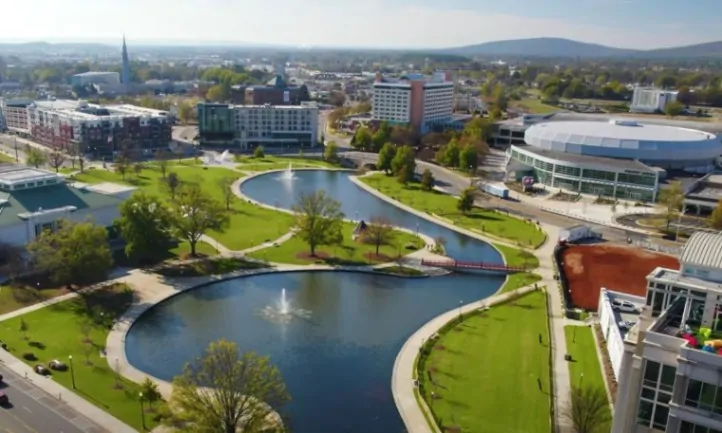
Madison County, home to Huntsville, has been adding around 10,000 people every year since 2019. Its rise as a technology and aerospace hub, anchored by NASA’s Marshall Space Flight Center, Redstone Arsenal, and a cluster of private tech firms, continues to attract professionals from across the U.S.
Farther south, Baldwin County reached a new high, gaining more than 8,000 new residents in 2024. The appeal here is lifestyle: retirees, remote workers, and families looking for coastal charm and lower costs are finding a home along Alabama’s beaches and small-town communities.
Meanwhile, areas that once struggled with population loss, Jefferson County (Birmingham), Montgomery, and Mobile, are showing signs of recovery. After declines in 2020 and 2021, these metros are finally stabilizing, helped by new investments and a broader job mix. Jefferson County alone attracted roughly 3,300 out-of-state residents last year, the most of any county in the state.
Migration: The Lifeline of Alabama’s Growth
Experts at the University of Alabama’s Center for Business and Economic Research note that migration is now the state’s primary growth driver. Nyesha Black, who leads demographic research there, explained that without inflows from other states and abroad, Alabama would be losing population.
“If it were not for migration,” she said, “the state of Alabama would not be growing.”
Foreign-born residents are also becoming a more visible part of the picture. Alabama’s immigrant population rose 13% in 2024, adding about 27,000 new residents and now making up roughly 4.5% of the total population. These newcomers are filling critical roles in construction, healthcare, and manufacturing sectors that have struggled with workforce shortages since the pandemic.
A More Diverse Alabama
@al.comnews Alabama’s urban areas all grew in 2024, and two major population centers at either end of the state were among the fastest growing metropolitan areas in the nation. This is according to new population estimates recently released by the U.S. Census Bureau. Story by Ramsey Archibald #alabama #census
Alabama’s growth is not just numerical but cultural. The demographic mix of the state is shifting, as younger, more diverse communities grow and older, predominantly white populations decline.
Census data shows that nearly 315,000 residents now identify as multiracial, up by 30,000 in just one year. The Hispanic and Latino population increased by roughly 16,000, while the Black population rose by about 3,000, and the Asian population grew by around 2,000. In contrast, the White population declined by approximately 2,000.
This gradual diversification is transforming both urban and rural Alabama, with noticeable demographic changes in schools, workplaces, and neighborhoods.
The Road Ahead
Migration patterns depend on jobs, cost of living, and quality of life, and Alabama’s challenge now is to remain competitive in all three. Huntsville’s booming tech sector and Baldwin County’s coastal lifestyle have made the state more appealing than ever, but sustaining that momentum will require strategic planning.
Black cautions that relying too heavily on a limited stream of newcomers could become risky, especially if national immigration policies tighten or birth rates continue to fall. “Alabama will have to compete to remain an attractive place for people to want to migrate here,” she said. “It just always goes back to the economy.”
For now, the story is largely positive: steady migration, strong job markets in key metros, and a population that’s slowly but surely becoming more diverse. Alabama’s 2024 growth isn’t explosive, but it’s steady, healthy, and reshaping the state for the next decade.