
The U.S. unemployment rate was 4.3% in May 2026, but the state-by-state picture is much more uneven. South Dakota had the lowest jobless rate in the country at 2.1%, while California had the highest rate among states at 5.3%. The District of Columbia, which is not a state, was higher at 6.1%.
The latest unemployment rate by state in 2026 shows a labor market that is still adding jobs, but not at the same speed in every region. Some smaller states remain extremely tight for employers. Several large states have more people looking for work, even while their economies remain large and active.
The table below uses the latest state unemployment rates from the Bureau of Labor Statistics. The rates are preliminary and measure unemployment by where workers live, not where employers are located.
Unemployment Rate By State In 2026
| State Or Area | Unemployment Rate | Rate Tier |
|---|---|---|
| Alabama | 3.0% | Low |
| Alaska | 4.6% | Moderate |
| Arizona | 4.8% | Moderate |
| Arkansas | 4.2% | Near U.S. rate |
| California | 5.3% | High |
| Colorado | 3.9% | Low to moderate |
| Connecticut | 5.1% | High |
| Delaware | 5.1% | High |
| Florida | 4.8% | Moderate |
| Georgia | 3.4% | Low |
| Hawaii | 2.5% | Very low |
| Idaho | 3.7% | Low to moderate |
| Illinois | 5.1% | High |
| Indiana | 3.3% | Low |
| Iowa | 3.2% | Low |
| Kansas | 3.8% | Low to moderate |
| Kentucky | 4.5% | Moderate |
| Louisiana | 4.5% | Moderate |
| Maine | 3.1% | Low |
| Maryland | 4.4% | Moderate |
| Massachusetts | 4.5% | Moderate |
| Michigan | 5.1% | High |
| Minnesota | 4.4% | Moderate |
| Mississippi | 3.8% | Low to moderate |
| Missouri | 3.8% | Low to moderate |
| Montana | 3.4% | Low |
| Nebraska | 3.0% | Low |
| Nevada | 5.2% | High |
| New Hampshire | 3.0% | Low |
| New Jersey | 4.7% | Moderate |
| New Mexico | 4.9% | Moderate |
| New York | 4.6% | Moderate |
| North Carolina | 3.7% | Low to moderate |
| North Dakota | 2.4% | Very low |
| Ohio | 3.7% | Low to moderate |
| Oklahoma | 4.1% | Near U.S. rate |
| Oregon | 5.2% | High |
| Pennsylvania | 4.2% | Near U.S. rate |
| Rhode Island | 4.3% | Same as the U.S. rate |
| South Carolina | 4.6% | Moderate |
| South Dakota | 2.1% | Very low |
| Tennessee | 3.6% | Low to moderate |
| Texas | 4.3% | Same as the U.S. rate |
| Utah | 3.7% | Low to moderate |
| Vermont | 2.6% | Very low |
| Virginia | 3.8% | Low to moderate |
| Washington | 5.2% | High |
| West Virginia | 4.3% | Same as the U.S. rate |
| Wisconsin | 3.4% | Low |
| Wyoming | 3.4% | Low |
| District of Columbia | 6.1% | Highest overall |
The 2026 state unemployment map is not a simple story of good states and bad states. Several low-rate states are small labor markets where employers have a limited pool of available workers. Several high-rate states are large economies with more job churn, more industry exposure, and larger numbers of people moving in and out of the labor force.
The national rate of 4.3% gives one useful benchmark, but state rates show the conditions workers actually face. A job seeker in South Dakota is entering a much tighter labor market than a job seeker in California, Nevada, Oregon, or Washington.
The Bureau of Labor Statistics reported that 18 states had unemployment rates lower than the U.S. figure, seven states plus the District of Columbia had higher rates, and 25 states were not appreciably different from the nation in the May 2026 State Employment and Unemployment release.
The Low-Unemployment Cluster
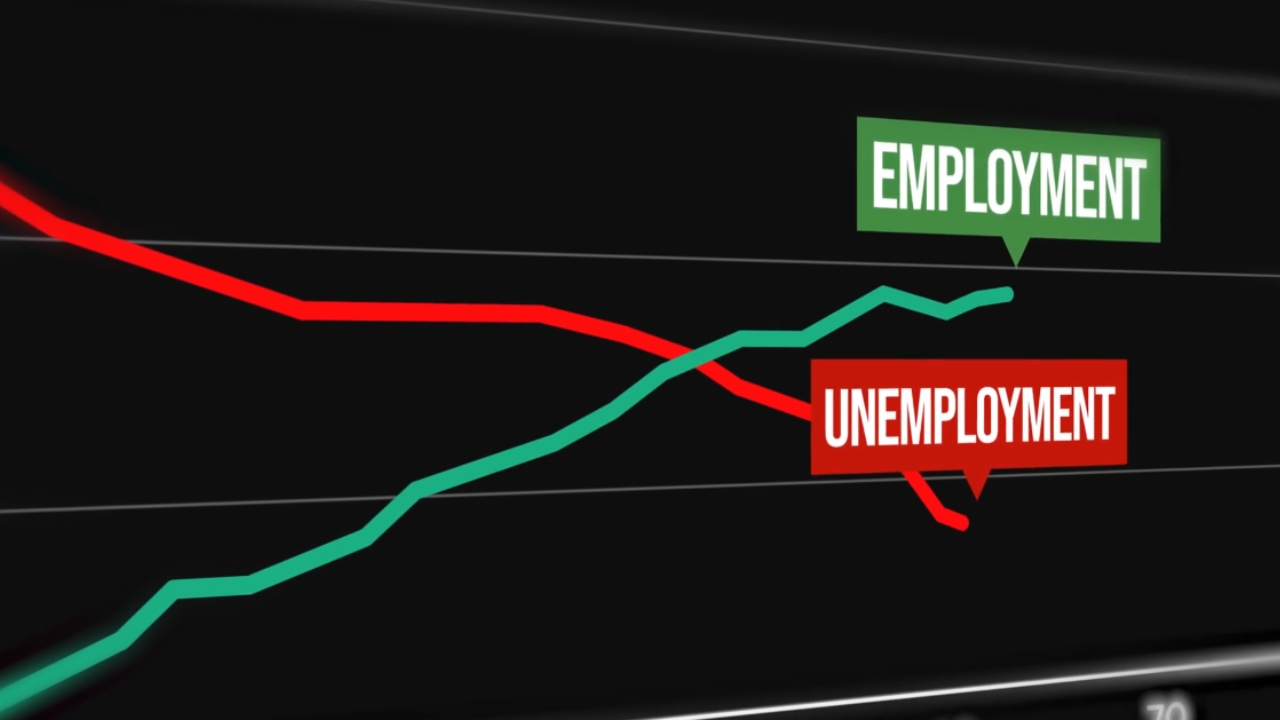
The lowest-rate states are South Dakota, North Dakota, Hawaii, and Vermont. Those states sit below 3%, which usually means employers have fewer available job seekers to draw from.
Low unemployment helps workers who want leverage in pay, hours, or job choice. For employers, it can create pressure. Hiring can take longer, training becomes more important, and retention becomes a bigger part of workforce planning.
What A Very Low Unemployment Rate Can Hide?
A very low unemployment rate does not automatically mean every worker has a good job. It does not measure wages, schedules, underemployment, job quality, or whether people left the labor force.
A state can have low unemployment and still have households struggling with the cost of living.
The High-Unemployment Cluster
View this post on Instagram
California, Nevada, Oregon, Washington, Michigan, Illinois, Connecticut, and Delaware all sit at or above 5%. Those rates show more slack in the labor market and more competition for available jobs.
High-rate states do not all have the same problem. Nevada is more sensitive to travel and hospitality cycles. Michigan has more manufacturing exposure. California and Washington have large technology, trade, education, healthcare, and service economies, but both have more active job seekers relative to their labor force.
Why Large States Have Higher Rates
Large states contain many labor markets at once. California includes technology centers, farm regions, ports, universities, tourism, entertainment, logistics, and high-cost metro areas.
One statewide rate blends all of that into a single number.
Lowest Unemployment Rates In 2026
The lowest unemployment rates in May 2026 were concentrated in smaller or mid-sized states. Those markets can feel tight very quickly because the labor force is smaller and employers have fewer available workers.
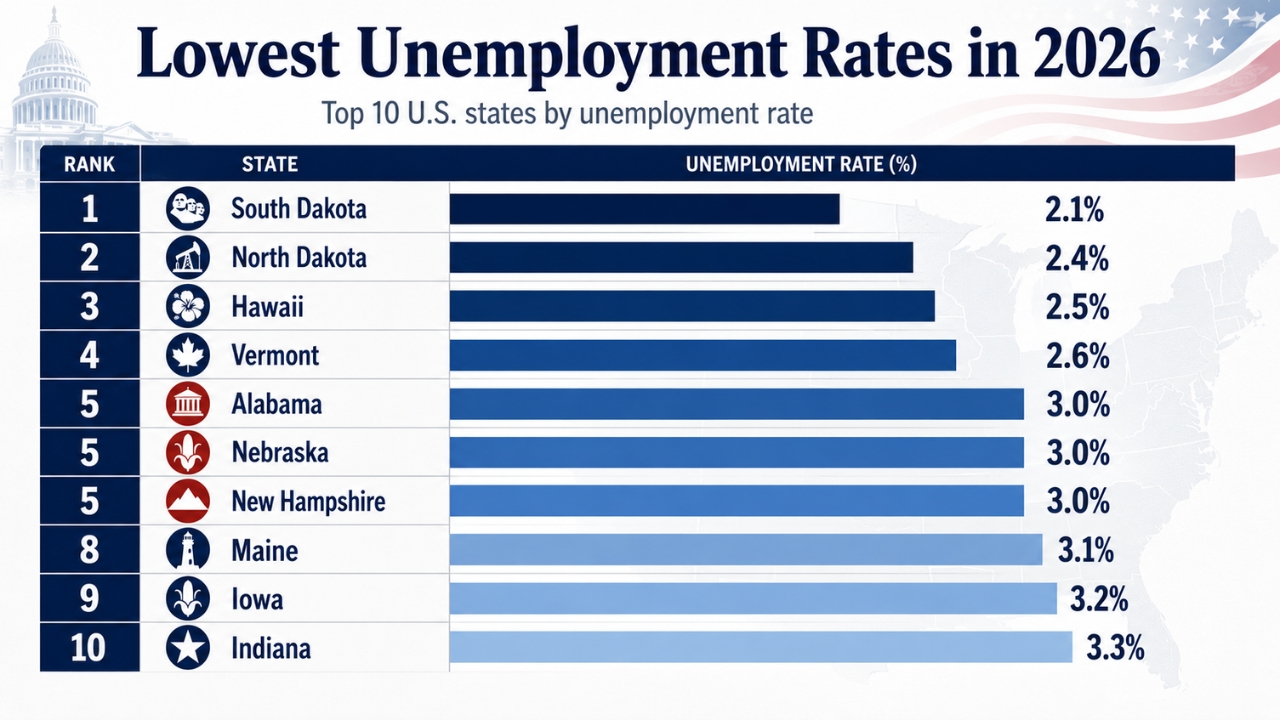
Several low-rate states have smaller populations, older workforces, lower job churn, or steady local demand from healthcare, education, agriculture, energy, local services, and government. When hiring continues, and fewer people are looking for work, the unemployment rate stays low.
In those states, the labor-market problem can shift from job availability to worker availability. Employers may have openings, but not enough applicants with the schedule, training, or location fit.
Highest Unemployment Rates In 2026
The highest unemployment rates show where job seekers face more competition. These states and jurisdictions have larger shares of workers looking for work compared with their labor force.
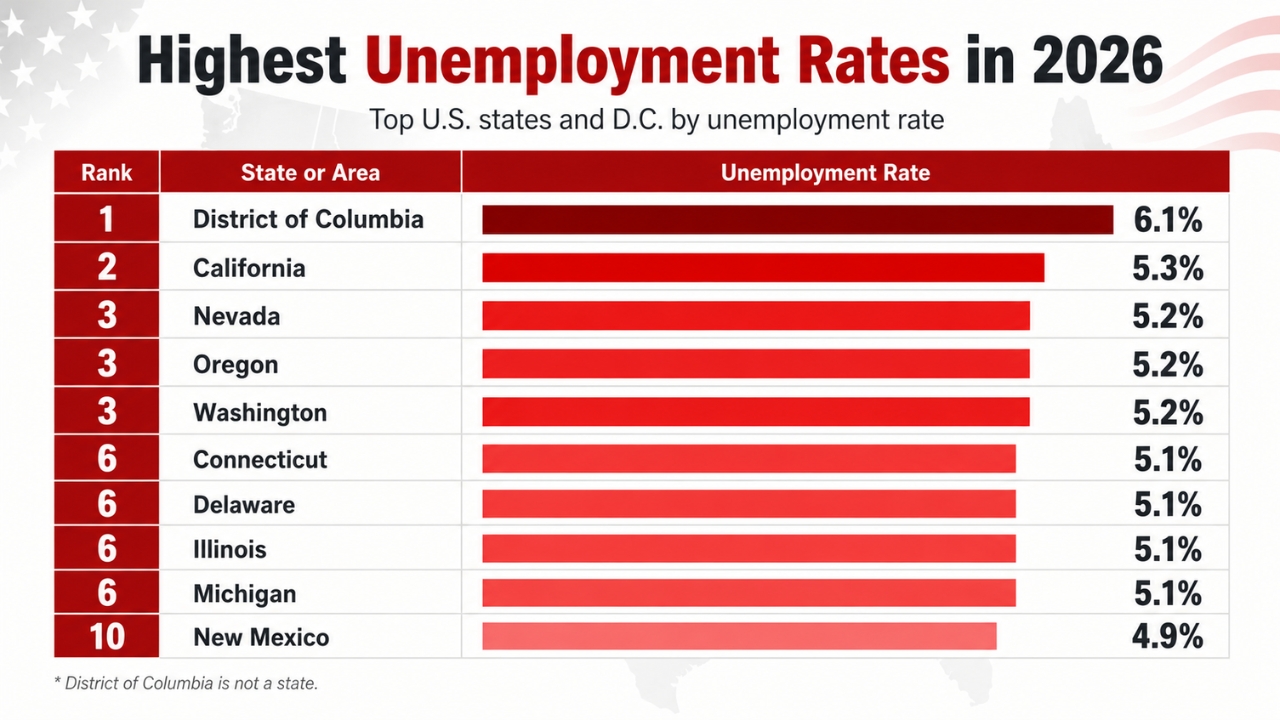
A higher unemployment rate usually means a job search takes more effort. Employers may receive more applications, interviews may move more slowly, and workers may have less room to push for pay or schedule flexibility.
The rate does not tell the whole story, though. A worker in healthcare or local government may still find openings in a high-rate state. A worker in finance, information, manufacturing, or transportation may face tighter hiring even in a state with a lower headline rate.
Why California Stands Out?
California had the highest unemployment rate among states, at 5.3%. That stands out because California is also one of the largest economies in the world.
A higher jobless rate in a large economy usually points to a mix of factors: population size, high costs, industry churn, technology restructuring, logistics shifts, and regional differences between coastal metros and inland areas.
National Job Market In 2026
BREAKING: The US economy adds 172,000 jobs in May, crushing expectations of 85,000.
The unemployment rate was 4.3%, in-line with expectations of 4.3%.
April’s jobs number was also revised UP by +64,000 jobs.
This marks the second strongest US jobs report in 13 months.
— The Kobeissi Letter (@KobeissiLetter) June 5, 2026
The national job market was still adding jobs in May. Employers added 172,000 nonfarm payroll jobs, and the unemployment rate stayed at 4.3%, according to the May 2026 Employment Situation report.
Job gains came mainly from leisure and hospitality, local government, and healthcare. Financial activities lost jobs. Construction, manufacturing, retail, information, professional and business services, and other major sectors showed little change.
The national report also shows why the job market feels mixed. There were 7.3 million unemployed people in May. Long-term unemployment stood at 2.0 million and was up by 524,000 over the year. Long-term unemployed workers made up 27.5% of all unemployed people.
Wage Growth And Working Hours
Average hourly earnings for private nonfarm workers rose to $37.53 in May, up 0.3% for the month and 3.4% over the year. Average weekly hours held at 34.3.
Pay is still rising, but wages need to be read beside prices. We have covered household price pressure in our report on U.S. inflation. A worker can receive a raise and still feel pressure if rent, insurance, groceries, fuel, and borrowing costs rise faster than expected.
What The Pay Data Tells Us
The wage numbers point to a labor market that is neither collapsing nor booming. Employers are still paying more, but the rate of wage growth is controlled. Workers are not seeing the kind of broad pay surge that would erase cost-of-living pressure in high-cost states.
Job Openings Show A Hiring Gap

Job openings give another view of the labor market. In April 2026, openings rose to 7.6 million, while hires fell to 5.1 million and separations fell to 5.0 million, according to the BLS Job Openings and Labor Turnover Survey.
That gap is important. A job opening is not the same as a completed hire. Employers may post positions and still move slowly because of budget limits, skill requirements, higher borrowing costs, automation plans, or uncertainty about demand.
For job seekers, that means applications can feel harder than the number of openings suggests. A labor market can have millions of open jobs and still have selective hiring.
Low-Hire, Low-Fire Conditions
The Federal Reserve Beige Book for June 2026 described a labor market with little change in employment across most districts and hiring focused mainly on critical roles or replacement. The report described a low-hire, low-fire pattern in many areas, with workers more reluctant to change jobs because of uncertainty in the June 2026 Beige Book summary.
That helps explain why job seekers can see a stable unemployment rate and still feel that hiring is slow. Employers may avoid broad layoffs, but they may also avoid expanding payrolls quickly.
How State Economies Shape Unemployment?
State unemployment rates follow the structure of local economies. A state with heavy tourism exposure moves differently from an energy state. A state with many corporate headquarters moves differently from a state driven by agriculture, government or healthcare.
State GDP helps explain scale and structure. We have covered that wider map in our guide to U.S. states ranked by GDP. The Bureau of Economic Analysis also reports state GDP and personal income data; its latest state GDP release showed economic growth in 35 states in the fourth quarter of 2025 through its GDP by state data.
Large Economies Can Still Have High Unemployment
California is the clearest example. A large economy can produce a large number of jobs and still have a high unemployment rate if the labor force is even larger, if hiring slows in high-wage sectors, or if regional job markets weaken.
Texas gives the opposite kind of example in the May data. Its unemployment rate matched the national rate at 4.3%, but because the state has a huge labor force, the number of unemployed workers remains large in raw terms.
Population Changes Add Pressure
Fast-growing states can add jobs and still feel labor-market pressure if new workers arrive faster than employers hire.
Which States Improved in 2026?

Six states had statistically significant unemployment-rate decreases: Delaware, Massachusetts, Ohio, Rhode Island, South Carolina, and South Dakota.
Ohio had the largest year-over-year improvement among states with significant changes, with the rate falling by 1.0 percentage point from May 2025. South Dakota also improved and kept the lowest rate in the country.
Monthly Changes Need Caution
One month can show movement, but a labor market should be judged over several months. BLS state estimates are preliminary and can be revised. Weather, school calendars, tourism, strikes, temporary closures, and labor force movement can all affect a single month.
Which States Worsened?
Alabama and Kentucky had statistically significant month-to-month unemployment-rate increases in May. Alabama rose by 0.2 percentage point to 3.0%, while Kentucky rose by 0.2 percentage point to 4.5%.
Over the year, Connecticut and Florida had the largest significant increases. Connecticut rose by 1.3 percentage points, and Florida rose by 1.1 points.
A rising unemployment rate can mean layoffs, slower hiring or more people entering the labor force and looking for work. The cause needs a local context. A higher rate is not always only a sign of job loss. It can also rise when more people start searching again.
Unemployment Rate By Region
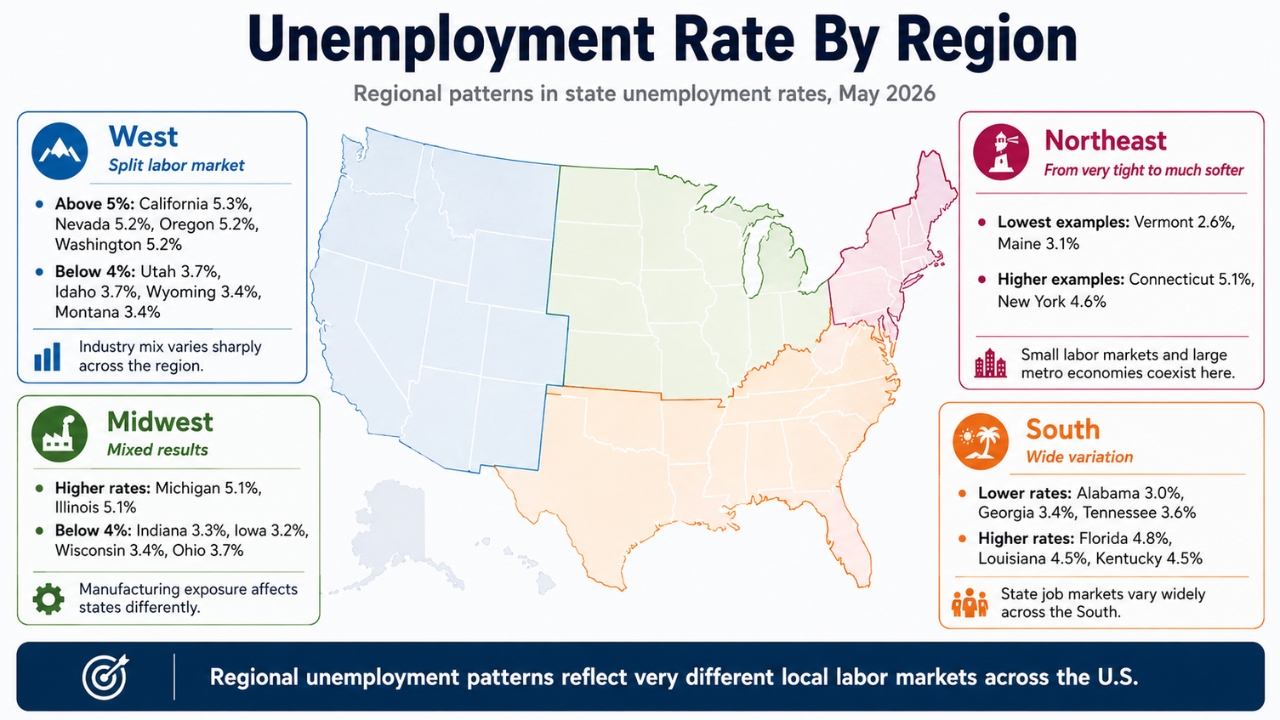
Regional patterns help readers see why state rates differ. The West includes several high-rate states in the May data, including California, Nevada, Oregon, and Washington. The Plains include several low-rate states, including South Dakota, North Dakota, Nebraska, and Iowa.
West
The West has a split labor market. California, Nevada, Oregon, and Washington are above 5%, while Utah, Idaho, Wyoming, and Montana are below 4%. That shows how different local industry mixes can be inside one broad region.
Midwest
The Midwest also splits. Michigan and Illinois are at 5.1%, while Indiana, Iowa, Wisconsin, and Ohio sit below 4%. Manufacturing exposure is important, but it does not affect every state the same way.
South
The South has a wide variation. Alabama is at 3.0%, Georgia is at 3.4%, and Tennessee is at 3.6%. Florida is much higher at 4.8%, while Louisiana and Kentucky stand at 4.5%.
Northeast
The Northeast ranges from Vermont at 2.6% and Maine at 3.1% to Connecticut at 5.1% and New York at 4.6%. The region includes small, tight labor markets and large metro economies with more job churn.
What The Data Means For Job Seekers

State unemployment rates should change how job seekers read the market. A lower-rate state may have fewer applicants per role, but it can also have fewer openings in specialized fields. A higher-rate state may offer more postings, but competition can be heavier.
Workers In High-Rate States
Workers in higher-rate states should search by industry, not only geography. Healthcare, local government, skilled trades, social assistance, and some service roles remain more stable nationally.
Technology, finance, information, transportation, and some corporate roles may be more selective.
Practical Moves
Workers in low-rate states may have more leverage, especially in healthcare, skilled trades, public services, and local business roles. The challenge can be job quality. Low unemployment does not guarantee high pay. Employers in low-rate states face a worker shortage problem. Employers in high-rate states may receive more applications, but they still may struggle to find candidates with the right experience. In tight states, wage offers, schedules, and hiring speed become important. In higher-rate states, employers may be able to hire more selectively, but long hiring processes can still push better candidates elsewhere. Keeping workers matters because replacing them can take longer in tight markets. Employers that rely on constant turnover may face higher training costs and more service problems. The unemployment rate affects households directly because losing work changes income faster than almost any other economic shock. A person can plan around higher grocery prices or insurance costs for a while. A job loss changes the whole monthly budget immediately. State unemployment also needs to be read beside income and living costs. We have covered household income differences in our guide to middle-class income by state. A 4.8% unemployment rate in Florida does not feel the same as a similar rate in Arizona because wages, rents, insurance, transport costs, and local industries differ. The percentage is only the starting point. The national jobs report shows where hiring was still moving in May. Leisure and hospitality added 70,000 jobs, local government added 55,000, and healthcare added 35,000. Financial activities lost 22,000 jobs. Healthcare remains one of the most durable hiring areas because demand is tied to aging, chronic disease, home care, outpatient services, and hospital staffing. Workers moving into healthcare support roles may find more stability than in more cyclical industries. We have covered one practical healthcare-adjacent path in our report on medical billing changes, which is relevant for people considering back-office healthcare work. Local government hiring includes public services, administration, transportation, public safety, schools, and municipal operations. These jobs vary by state budget and city finances, but they can provide steadier demand than some private sectors. Leisure and hospitality hiring can help workers enter the labor market quickly, but job quality varies. Pay, hours, tips, seasonality and benefits differ by metro area and employer. Financial activities lost jobs in May. Professional and business services showed little change. That helps explain why some white-collar workers report slower searches even while the national payroll numbers look healthy. The unemployment rate counts people who are jobless, available to work, and actively looking. It does not count everyone without a job. People who stopped looking are outside the headline unemployment rate. So are people who want full-time work but are working part-time because they cannot find full-time hours. New research shows that nearly half of workers today are searching for the exit — but not for the reasons you might expect.https://t.co/glqXhk6biB — Money (@Money) June 22, 2026 In May, 4.8 million people were working part-time for economic reasons, and 6.2 million people outside the labor force said they wanted a job. Long-term unemployment is one of the most serious signals in the May data. Two million people had been jobless for 27 weeks or longer. That group made up 27.5% of all unemployed people. Long job searches can make hiring harder because skills can fade, confidence can drop, and employers may become more selective. A stable unemployment rate can still hide growing pressure among people stuck out of work for months. The state unemployment rate comes from the Local Area Unemployment Statistics program. BLS says LAUS produces monthly and annual employment, unemployment, labor force, and unemployment-rate estimates for states, counties, metropolitan areas, and many cities through its LAUS estimation methodology. The rates in this article are seasonally adjusted. Seasonal adjustment removes regular patterns tied to school calendars, tourism, holidays, weather, and other recurring events. That makes state-to-state and month-to-month comparisons cleaner. State unemployment rates are based on where workers live. Payroll job counts are based on where employers are located. A person can live in New Jersey and work in New York, or live in Maryland and work in Washington, D.C. That is why residence-based unemployment and workplace-based payroll data answer different questions. BLS marks the latest state rates as preliminary. Estimates can be revised when more data arrives or when seasonal factors are recalculated. Readers should use the latest release for current analysis and avoid treating one month as a permanent trend. The next labor-market update will help show whether the May pattern continues. Watch three signals together: state unemployment rates, national payroll gains, and job openings. California, Nevada, Oregon, Washington, Michigan, Illinois, Connecticut, and Delaware should be watched closely. A sustained rate above 5% can signal a softer labor market and more difficult searches for workers. The long-term unemployed are already up sharply over the year. If that number keeps rising, the national labor market will look weaker than the 4.3% headline rate suggests. Openings alone are not enough. The more useful question is whether openings turn into hires. A high number of openings with lower hiring points to caution among employers. People looking for work should use state and local resources, not only national job boards. Local workforce centers can help with training, unemployment insurance questions, job-search planning, and employer connections. The U.S. Department of Labor network lists local help through American Job Centers, which connect workers with public employment services in their area. The latest unemployment rate by state in 2026 shows a divided labor market. The national rate was 4.3% in May, but state rates ranged from 2.1% in South Dakota to 5.3% in California. The District of Columbia stood at 6.1%. Low-rate states are dealing with a tight labor supply. High-rate states have more job seekers competing for work. Large states shape the national picture because their labor forces are so large, but smaller states can show the tightest hiring conditions. The most useful reading is simple: the U.S. labor market is still adding jobs, but the experience depends heavily on state, industry, and local cost of living. A worker should read the state rate first, then look at the city, industry, and wage picture before judging the job market where they live.
Workers In Low-Rate States
Practical Moves
What The Data Means For Employers

Retention Is Part Of Hiring
Employer Priorities In 2026
Unemployment And Household Pressure
Industries To Watch In 2026

Healthcare
Related Career Path
Local Government
Leisure And Hospitality
Finance And White-Collar Roles
Why The Headline Rate Does Not Tell The Whole Story
Long-Term Unemployment
How BLS Measures State Unemployment
Residence-Based Data
Why Revisions Happen
What To Watch Next?

Signal 1: States Above 5%
Signal 2: Long-Term Unemployment
Signal 3: Hires Versus Job Openings
Where To Get Help If You Are Looking For Work?
FAQs
Bottom Line