
In the latest census of the US population, Arizona had a population of 7,151,502.
As of 2025, Arizona’s population is approximately 7,582,384 as per the latest data.
The data reveals that the state has consistently been one of the fastest-growing regions in the United States.
From 2023 to 2026, annual growth rates are projected to decrease slightly, settling at around 1.3% per year.
Despite this deceleration, Arizona’s growth rate remains above the national average, driven by factors such as job opportunities and a favorable climate.
By exploring the various projections and demographic trends, we can gain deeper insights into the state’s future.
Key Takeaways
- Arizona’s population grew from 7,151,502 (latest census) to 7,582,384 in 2025, maintaining a 1.3% annual growth rate, which remains above the national average.
- The median home price is $451,100 (+4.6% YoY), while home sales increased by 16.7% and inventory rose 23.1%, indicating a balanced market with steady appreciation.
- Arizona’s unemployment rate increased from 3.4% to 3.8% in 2024, while the state added 8,200 nonfarm jobs in September, but employment growth is slowing compared to previous years.
- The state is 66.67% White, with 13.41% identifying as two or more races. 21.3% of the population is under 18, and 19.3% is 65+, signaling a growing aging population with increased healthcare demands.
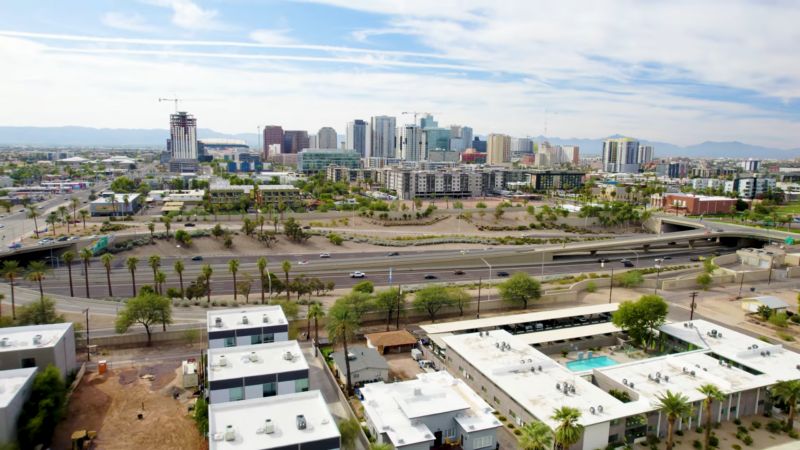
- Metro areas like Phoenix and Tucson are seeing high population density, while rural counties remain sparsely populated. Arizona continues to attract high-income retirees and job seekers due to lower taxes and a favorable climate.
- Arizona’s GDP is projected to grow by 2.8% in 2025, outpacing the national rate (2.7%). Housing demand is expected to remain strong, but challenges like stricter immigration policies, higher interest rates, and global economic slowdowns could impact employment and tourism.
1. Population Size and Density

- Arizona’s population size and density chart
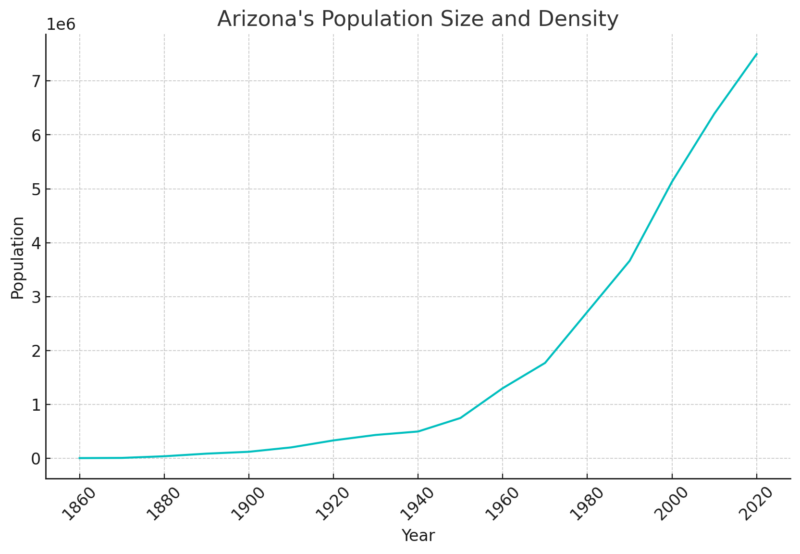
This figure represents significant growth since the 2010 census, which recorded a population of 6,392,017. The state has seen substantial population increases, only marginally tapering at times.
Population density varies considerably across the state. Metro areas like Phoenix and Tucson are more densely populated.
Rural regions, conversely, maintain much lower population densities. Such demographic trends highlight Arizona’s urbanization and the continued influx of residents to its metropolitan centers.
2. County Population
The most populous counties in Arizona are Maricopa County with 4,585,871 residents, Pima County with 1,063,162, Pinal County with 484,239, Yavapai County with 249,081, and Mohave County with 223,682 according to Arizona-demographics.
| County | Population | Growth Rate | Area (sq mi) | Population Density (per sq mi) |
|---|---|---|---|---|
| Maricopa | 4,615,909 | 3.84% | 3.6K | 502 |
| Pima | 1,068,848 | 2.26% | 3.5K | 116 |
| Pinal | 503,441 | 17.03% | 2.1K | 94 |
| Yavapai | 251,932 | 6.2% | 3.1K | 31 |
| Mohave | 226,459 | 5.73% | 5.1K | 17 |
| Yuma | 217,568 | 5.79% | 2.1K | 39 |
| Coconino | 144,721 | -0.32% | 7.2K | 8 |
| Cochise | 123,793 | -1.38% | 2.4K | 20 |
| Navajo | 109,550 | 2.61% | 3.8K | 11 |
| Apache | 64,539 | -2.08% | 4.3K | 6 |
| Gila | 54,084 | 1.37% | 1.8K | 11 |
| Santa Cruz | 49,636 | 4.03% | 477 | 40 |
| Graham | 40,228 | 4.09% | 1.8K | 9 |
| La Paz | 16,885 | 1.91% | 1.7K | 4 |
| Greenlee | 9,411 | -1.23% | 711 | 5 |
Maricopa County has the highest population with 4,615,909 people, making it the most densely populated county with 502 people per sq mi according to World Population Review.
Pinal County has the highest growth rate of 17.03%, indicating rapid expansion.
Coconino (-0.32%), Cochise (-1.38%), Apache (-2.08%), and Greenlee (-1.23%) counties have experienced population declines.
Coconino County has the lowest population density with just 8 people per sq mi, despite being geographically large.
Maricopa County remains the most densely populated at 502 per sq mi, followed by Santa Cruz County at 40 per sq mi.
The largest county by area is Coconino County (7.2K sq mi) but has a declining population.
3. Age Distribution
| Category | Percentage |
|---|---|
| Persons under 5 years | 5.3% |
| Persons under 18 years | 21.3% |
| Persons 65 years and over | 19.3% |
| Female persons | 50.8% |
21.3% of the population is under 18, indicating a significant portion of youth, which can impact education, healthcare, and future workforce planning.
19.3% of the population is 65+, which suggests a growing elderly demographic that may require increased healthcare, senior living services, and social support.
Only 5.3% of the population is under 5, indicating a relatively stable or slightly declining birth rate.
Arizona’s largest age group consists of individuals aged 25 to 29, with about 501,624 people (7.02% of the total population). Meanwhile, the smallest group is those 85 years and older, at 1.94% of the population. The state also has a relatively balanced gender ratio with slightly more females than males according to U.S Census.
4. Gender Ratio
The gender ratio in Arizona, as per the U.S. Census Bureau’s data, is nearly balanced, with slightly more females than males.
Neilsberg notes that the current gender ratio is approximately 99.7 males for every 100 females. This translates to 50.08% females and 49.92% males in the state.
5. Ethnic and Racial Composition
| Race/Ethnicity | Percentage |
|---|---|
| White | 66.67% |
| Two or More Races | 13.41% |
| Other Race | 7.66% |
| Black or African American | 4.56% |
| Native American | 4.15% |
| Asian | 3.36% |
| Native Hawaiian or Pacific Islander | 0.2% |
The majority racial group is White (66.67%), which aligns with broader demographic trends in Arizona.
13.41% of individuals identify as two or more races, showing an increasing trend in racial diversity.
At 7.66%, this category may include populations that don’t fit into standard racial categories, often indicating Hispanic/Latino or mixed-ethnicity individuals as per World Population Review notes.
Black or African American residents make up 4.56%, while Native Americans account for 4.15%, likely reflecting Arizona’s historical and indigenous communities.
6. Decade by Decade Analysis
USAFacts says in their research that between 1900 and 2020, Arizona witnessed substantial population increases. In the early 1900s, Arizona had a relatively modest population.
The 1940s marked a turning point with an influx of defense industry jobs during World War II.
From 1990 to 2000, Arizona was the second fastest-growing state with nearly a 40% increase.
By 2020, Arizona’s population surpassed 7 million, showing an 11.9% increase since 2010.
7. Population Growth Projections
In the short term, Arizona’s population growth remains positive. According to government officials, projections indicate a population growth rate of approximately 1.3% per year through 2026. As of 2025, the population is projected to be 7,497,004, reflecting consistent annual increases from previous years.
From 2023 to 2025, job growth is expected to decelerate slightly from 2.1% to 1.9%. Despite this, Arizona’s job gains are predicted to outpace national averages, suggesting economic factors will continue to attract new residents.
🆕AZ latest jobs report is now available!
✅Unemployment rate has reached a new record low.
✅Labor force growth is positive and well above national rate.
✅Job market remains positive.
✅Employment growth continues across most industries & metro areas. https://t.co/eicQ8OiFqy— AZ Office of Economic Opportunity (@OEOAZGOV) June 20, 2024
Looking further ahead, projections show a more moderate population growth rate. By 2060, sub-county projections predict a steady but slower increase compared to earlier decades. Factors contributing to these predictions include economic conditions and demographic shifts.
By 2080, the U.S. population is expected to peak at nearly 370 million and then slightly decline to 366 million by 2100. Arizona’s growth patterns will likely align with these national trends, emphasizing a stable but slowing population expansion over the long term.
8. Housing Market
| Metric | Value | Year-over-Year Change |
|---|---|---|
| Median Sale Price | $451,100 | +4.6% |
| Number of Homes Sold | 7,390 | +16.7% |
| Number of Homes for Sale | Increased | +23.1% |
| Median Days on Market | 63 Days | TBD |
The median home price in Arizona is $451,100, reflecting a 4.6% increase from the previous year.
This indicates steady appreciation despite fluctuations in interest rates and market conditions.
A 16.7% rise in the number of homes sold suggests strong demand, possibly driven by new buyers entering the market or a shift in affordability according to Redfin.
The 23.1% increase in inventory (homes for sale) means that buyers have more options, which could help stabilize prices in the coming months.
The median time to sell a home is 63 days, which suggests a moderate market where homes are moving but not extremely fast.
9. Labor Market Dynamics
Arizona added 8,200 nonfarm jobs in September 2023, reflecting a 0.26% increase, while the U.S. saw a 0.37% increase. Common Sense Institute Home says that the manufacturing sector alone gained 1,400 jobs during this period, a strong recovery after previous stagnation.
Over the year, Arizona’s job growth was 1.9%, a slowdown from the 3.5% growth rate seen the previous year. Since April 2020, the state has added 516,600 jobs, recovering 106% of its pandemic-related job losses.
| Month | Civilian Labor Force (in thousands) | Employment (in thousands) | Unemployment (in thousands) | Unemployment Rate (%) |
|---|---|---|---|---|
| July 2024 | 3,758.3 | 3,631.5 | 126.7 | 3.4% |
| Aug 2024 | 3,761.6 | 3,633.1 | 128.6 | 3.4% |
| Sept 2024 | 3,761.1 | 3,628.7 | 132.4 | 3.5% |
| Oct 2024 | 3,757.3 | 3,621.7 | 135.6 | 3.6% |
| Nov 2024 | 3,750.8 | 3,610.2 | 140.6 | 3.7% |
| Dec 2024 | 3,744.1 | 3,601.5 | 142.6 | 3.8% |
The civilian labor force declined from 3,758.3K in July to 3,744.1K in December, indicating a slight contraction.
Employment numbers also fell from 3,631.5K to 3,601.5K, suggesting fewer people working.
Unemployment increased from 126.7K in July to 142.6K in December, which is a 12.6% rise over six months according to BLS.
The unemployment rate climbed from 3.4% to 3.8%, signaling a softening job market.
The rising unemployment trend could indicate seasonal shifts, economic slowdown, or structural changes in the job market.
If the trend continues, job seekers may face tougher conditions, and businesses could see hiring slowdowns.
10. Educational Statistics

- Tucson has a 35% attainment rate for four-year college degrees

Arizona’s high school graduation rate stands at 77.3%, which is below the national average of 86.6%. Among Arizona counties, Greenlee County had the highest graduation rate at 94.0%, while Pima County ranked the lowest at 71.2%.
Arizona has seen improvements since 2021, when the rate dropped to 76.4%, following the national trend of rising graduation rates as per the Arizona MAP Dashboard.
Arizona Department of Education says that the number of residents with bachelor’s degrees or higher is increasing, reflecting Arizona’s focus on higher education.
Tucson, for example, reports a 35% attainment rate for four-year degrees. This increase is tied to Arizona’s broader efforts to improve education in key areas like STEM fields, which are crucial for the state’s economic growth.
Student Population Trends
Enrollment in Arizona’s K-12 system remains steady, while postsecondary enrollment has seen an increase, particularly among part-time students. This shift is driven by greater flexibility in education programs, such as online courses, which are expanding access for students across the state.
In a similar trend, educational attainment levels in Utah have shown consistent growth, reflecting a broader focus on academic progress across the region.
11. Impact of Migration
- Migration from rural areas fuels the growth of cities such as Phoenix and Tucson

| Indicator | Value / Forecast for 2025 |
|---|---|
| Economic Growth (GDP Growth Rate) | 2.8% (Above trend and faster than 2024) |
| National Economic Growth Rate | 2.7% (Slightly lower than Arizona) |
| Employment Growth | Moderate growth expected |
| Unemployment Rate | Slight increase, but below national rate |
| Population Growth | Continued strong growth |
| New Housing Units Added | 58,400 (Majority single-family homes) |
| Multifamily Housing Construction | 14,000 units |
| House Price Increase | 2.0% (Moderate rise, in line with national trend) |
| Vacancy Rate | Elevated, above national rate |
| Tourism Sector | Weaker due to global economic factors |
| Key Economic Risks | Tougher immigration enforcement, higher interest rates, global economic slowdown |
Comerica notes that the state’s 2.8% projected growth is slightly above the 2.7% national rate, driven by strong population growth and housing market expansion.
This suggests that Arizona remains an attractive destination for businesses and residents.
Moderate employment growth is expected, but challenges such as a strong dollar, weaker global economies, and stricter immigration enforcement may slow job creation, particularly in the tourism, hospitality, and construction sectors.
Despite this, Arizona’s unemployment rate will stay below the national average, indicating a resilient job market.
58,400 new dwellings are expected to be added, with single-family homes making up the bulk of new construction.
Multifamily housing (14,000 units) remains the most affordable option, sustaining high demand despite tighter lending conditions.
House prices are expected to rise by 2.0%, reflecting a balanced market rather than a housing boom.
The tourism industry may face challenges due to weaker global economies (impacting visitor spending) and a strong U.S. dollar (making Arizona more expensive for international travelers).
12. Policy Implications

- Zoning reforms play a crucial role in controlling urban sprawl
Arizona’s ongoing population growth demands a shift in urban planning strategies. Cities must prioritize affordable housing development to keep pace with rising demand. This could involve promoting mixed-use developments that combine residential, commercial, and recreational spaces, thus fostering community integration while efficiently utilizing available land.
The state’s projected population growth through 2026 further emphasizes the need for such planning as per AZ Report Cards.
Zoning reforms are critical to managing urban sprawl. By encouraging higher-density developments, cities can reduce the impact of sprawl on the environment and public infrastructure.
Furthermore, preserving green spaces in urban areas is essential for maintaining environmental sustainability and enhancing residents’ quality of life. Strategic land use planning that balances development and conservation will allow for continued growth while protecting natural resources.
Arizona Governor Katie Hobbs has launched Efficiency Arizona, a program designed to help low-income residents replace faulty cooling and heating systems to reduce heat-related health risks. The program fully covers the cost for households earning below 80% of the median income and offers a 50% subsidy for those earning between 80% and 150%.
Seniors, who are especially vulnerable to heat-related illnesses, are a key target group. However, concerns have been raised about income limits excluding some in need. The program is the first phase of a broader initiative to address heat risks across the state.
More about that can be found in this news article.
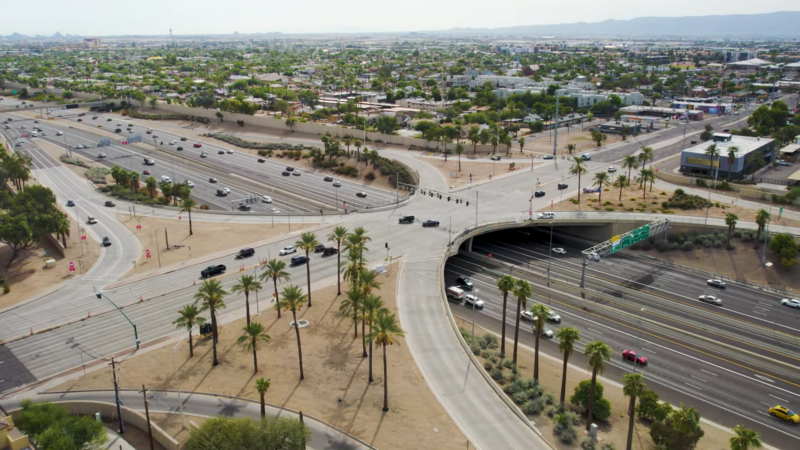
Transportation and Infrastructure
As Arizona’s population expands, the demand for efficient transportation systems becomes a key policy focus. Expanding public transit networks such as buses and light rail can help connect suburban and urban areas, improving mobility and reducing traffic congestion. According to reports, addressing these needs through infrastructure investments is essential to support the growing population.
Additionally, Arizona must focus on sustainable transportation options. Investing in bike lanes and electric vehicle charging stations can promote eco-friendly commuting alternatives, contributing to environmental sustainability.
The integration of these options, along with regular maintenance and upgrades to existing roads and bridges, will ensure Arizona’s infrastructure remains robust and capable of handling future growth.
Methodology
Data Collection: We sourced population, housing, labor, and economic data from U.S. Census Bureau, Bureau of Labor Statistics (BLS), and Arizona state reports.
Trend Analysis: We analyzed historical and projected growth rates to highlight Arizona’s population, housing, and job market trends.
Comparative Insights: We compared Arizona’s performance against national averages to assess economic and demographic significance.
Regional Breakdown: We examined county-level data, identifying high-growth areas and declining populations.
Market & Policy Review: We evaluated housing market shifts, policy changes, and economic risks, considering local and global factors.
Final Interpretation: The findings were synthesized into key takeaways, ensuring clarity, relevance, and actionable insights for readers.
References:
- U.S. Census Bureau – Latest Census of U.S. Population
- Arizona-Demographics – Counties by Population
- World Population Review – Arizona County Population Data
- Redfin – Arizona Housing Market
- Bureau of Labor Statistics (BLS) – Arizona Employment & Unemployment Data
- Comerica Bank – Arizona State Economic Outlook 2025
- Arizona Office of Economic Opportunity (OEOAZGOV) – Arizona Labor Market Update
- USAFacts – Arizona Population Change Over the Decades
- Arizona Department of Education – High School Graduation Rates
- Arizona MAP Dashboard – Arizona’s Educational Statistics
- Arizona Department of Transportation (ADOT) – Arizona Infrastructure and Transportation
- KGUN9 News – Governor Hobbs Launches Efficiency Arizona
- Office of Economic Opportunity Arizona – Arizona’s Population Growth & Projections
- Common Sense Institute – Arizona Jobs and Labor Force Update
- Arizona Report Cards – Arizona’s Demographic & Economic Report


