
Indianapolis, Indiana, had an estimated population of 876,665 in 2025 according to the World Population Review.
The city, located in Hamilton County, has been experiencing a population decline at an annual rate of -0.3%.
Since the 2020 census, which recorded a population of 887,177, Indianapolis has seen a total population decrease of -1.18%
The population of the Indianapolis metro area is approximately 1,925,000, showing a modest growth trend of 1.16% from the previous year as noted by Macrotrends.
Meanwhile, within the city limits, estimates suggest a population of around 897,486 people, illustrating varied growth patterns and dynamics compared to the surrounding metropolitan area.
Key Takeaways
Historical Population Trends
View this post on Instagram
For the sixth consecutive year, Indiana’s population growth rate has slowed. According to the U.S. Census Bureau, Indiana’s population grew by approximately 0.3% in 2012, a rate higher than its neighboring states, though reflective of the broader sluggish growth seen across the United States.
Columbus, Ohio, with a population slightly lower than Indianapolis by about 30,000, has a significantly higher growth rate. It was projected that Columbus would surpass Indianapolis in population by 2020.
Despite the slow growth, Indiana’s population is predicted to increase by 15% by 2050, with the most growth expected in counties surrounding Indianapolis. The Indianapolis-Carmel metro area has consistently been the state’s primary growth driver, accounting for 57% of Indiana’s growth from 2000 to 2010.
By 2030, it is expected to contribute 62% of the state’s growth. Observing how much Indianapolis can grow leading up to the next census will be noteworthy.
Historically, the area now known as Indianapolis was originally inhabited by the Miami and Lenape (Delaware) Native American tribes, who were displaced around 1820. The site was selected as Indiana’s state capital in 1820, uniquely positioned near the geographic center of the state, making it one of the closest state capitals to being centrally located.
Age Structure
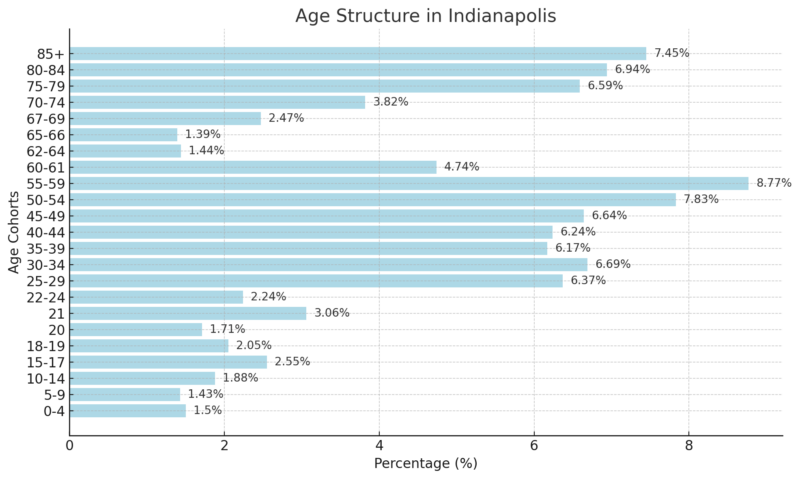
The largest age groups in Indianapolis are middle-aged adults (55-59 years) at 8.77%, followed by older adults aged 50-54 (7.83%).
Young adults aged 25-34 make up a significant portion of the population (13.06% combined), highlighting a workforce-ready demographic according to Statistical Atlas.
The lower percentages in younger cohorts (e.g., 1.50% for 0-4 years) suggest a declining birth rate or migration of families with young children.
Age and Sex Distribution
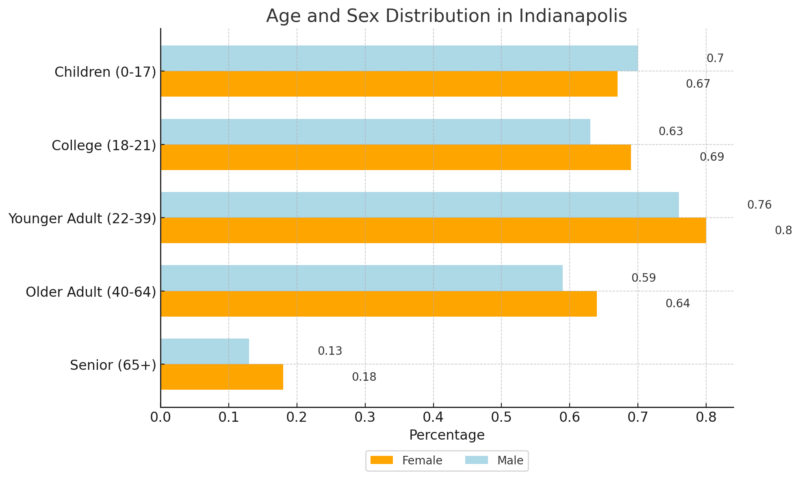
Older adults (40-64) represent the largest share of Indianapolis’s population at 30.8%, with a fairly balanced gender distribution.
Younger adults (22-39) also make up a significant portion (28.0%), reflecting a strong workforce demographic.
Children (24.8%) represent a notable share, emphasizing the importance of education and family-oriented resources.
Seniors (11.1%) are a smaller but significant segment, indicating an aging population.
Detailed Age and Sex Distribution
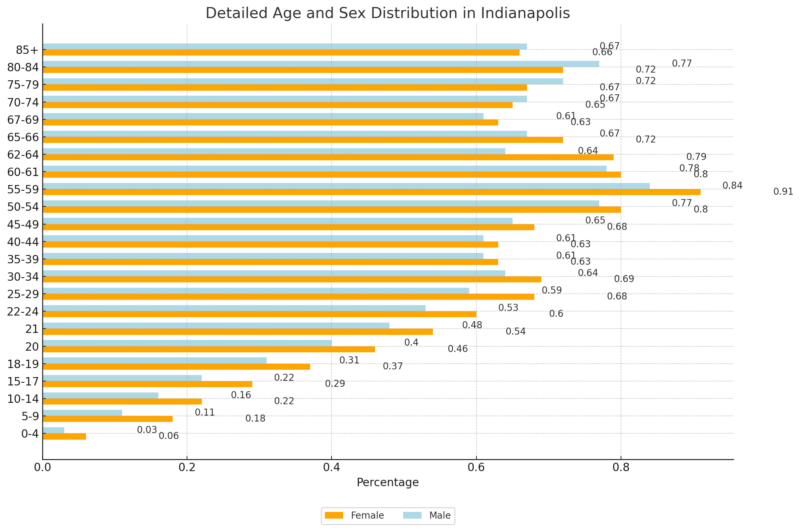
Females slightly outnumber males in most age groups, particularly among older cohorts (e.g., 55-59 and 65+), reflecting higher life expectancy for women.
Younger cohorts (0-9) show a narrower gender gap.
The largest gender differences appear in the middle-aged groups, highlighting the effects of aging and mortality on male demographics.
Cultural and Ethnic Composition
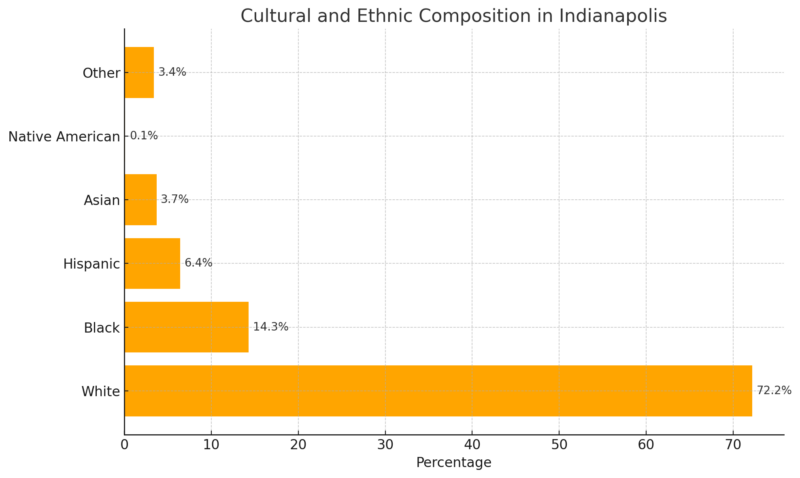
Indianapolis is predominantly White, with 72.2% of the population identifying as such. Black residents form the second-largest racial group at 14.3%, followed by Hispanic individuals at 6.4%.
Asian residents account for 3.7%, while Native Americans represent only 0.1% of the population according to Best Neighborhood.
The “Other” category makes up 3.4%, highlighting some diversity beyond the major racial categories.
The relatively small percentages for non-White groups suggest opportunities to further support diversity and inclusion initiatives within the city.
Language Spoken at Home by Age Group in Indianapolis
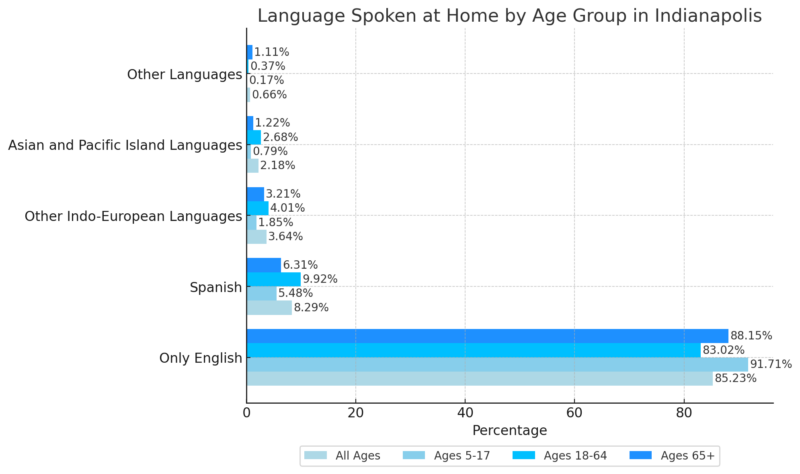
English is the primary language spoken in Indianapolis across all age groups, with 85.23% of the population speaking only English.
The percentage is highest among children aged 5-17 (91.71%) and remains above 83% for all other age brackets.
Spanish is the most common non-English language, spoken by 8.29% of the population.
Its prevalence is highest among working-age adults (18-64) at 9.92% and lower among children (5.48%) and seniors (6.31%).
Top 50 Neighborhoods By Population in Indianapolis
Rank
Neighborhood
Population
1
Far Eastside
60.39k
2
Chapel Hill-Ben Davis
32.24k
3
Near Eastside
29.50k
4
Snacks-Guion Creek
27.69k
5
Near Southeast
27.12k
6
South Perry
21.77k
7
Eagledale
21.48k
8
Fall Creek
18.69k
9
Garden City
17.72k
10
North High School
17.19k
11
South Franklin
16.78k
12
Near Westside
15.98k
13
Eagle Creek
15.90k
14
Crooked Creek
15.83k
15
Augusta-New Augusta
15.60k
16
Mars Hill
14.56k
17
South Emerson
14.09k
18
St. Vincent-Greenbriar
13.96k
19
Downtown
13.95k
20
Irvington
13.78k
21
Edgewood
13.27k
22
Fairgrounds
12.56k
23
Martindale-Brightwood
12.10k
24
University Heights
11.95k
25
Devington
11.34k
26
Mapleton-Fall Creek
11.30k
27
Valley Mills
11.15k
28
Galludet
11.01k
29
Nora-Far Northside
10.79k
30
Castleton
10.67k
31
Eastside
10.10k
32
Allisonville
10.02k
33
Butler-Tarkington
9.66k
34
Glenn’s Valley
9.45k
35
Geist
9.39k
36
Key Meadows
8.92k
37
Meridian Kessler
8.59k
38
West Indianapolis
8.48k
39
Near Northside
8.41k
40
Southdale
8.35k
41
Southeast Warren
8.19k
42
Linden Wood
8.05k
43
Delaware Trail
7.86k
44
Arlington Woods
7.66k
45
Near Southside
7.51k
46
Meadows
7.30k
47
Near Northwest-Riverside
7.04k
48
Millersville
6.86k
49
Broad Ripple
6.72k
50
North Perry
6.61k
Far Eastside is the most populous neighborhood in Indianapolis, with 60.39k residents, making it a significant contributor to the city’s total population.
This area may require enhanced infrastructure and resources to accommodate its large population as per table from Statistical Atlas.
Neighborhoods such as Chapel Hill-Ben Davis (32.24k) and Near Eastside (29.50k) also have substantial populations. These areas are likely key hubs of activity and may face similar resource and service demands as the Far Eastside.
Neighborhoods like South Perry (21.77k) and Eagledale (21.48k) fall into a mid-range population bracket. These areas represent stable residential zones but may not face the same resource challenges as more densely populated neighborhoods.
Broad Ripple (6.72k) and North Perry (6.61k) are the least populated neighborhoods. These areas might offer more opportunities for growth and development or appeal to residents seeking less densely populated living environments.
Income Statistics
Metric
Value
Year-over-Year (Y-o-Y) Change
Average Annual Household Income
$82,697
9.1%
Median Annual Household Income
$59,110
8.8%
Income (Aged 25-44)
$63,594
N/A
Income (Aged 45-64)
$67,954
N/A
Income (Under 25)
$37,535
N/A
Income (65+)
$47,544
N/A
People Below Poverty Level
-3
N/A
People Above the Poverty Level
718,557
0.9%
Point2Homes notes that Indianapolis has a notable disparity between the average household income ($82,697) and the median household income ($59,110), indicating the presence of higher-earning households that raise the average.
Income levels increase with age until the 45-64 bracket, which earns the highest median wage ($67,954).
Younger residents (under 25) and seniors (65+) earn significantly less, reflecting entry-level roles or retirement.
The Y-o-Y increase in average and median incomes (9.1% and 8.8%, respectively) suggests economic improvement and rising wages.
Employment Statistics in Indianapolis
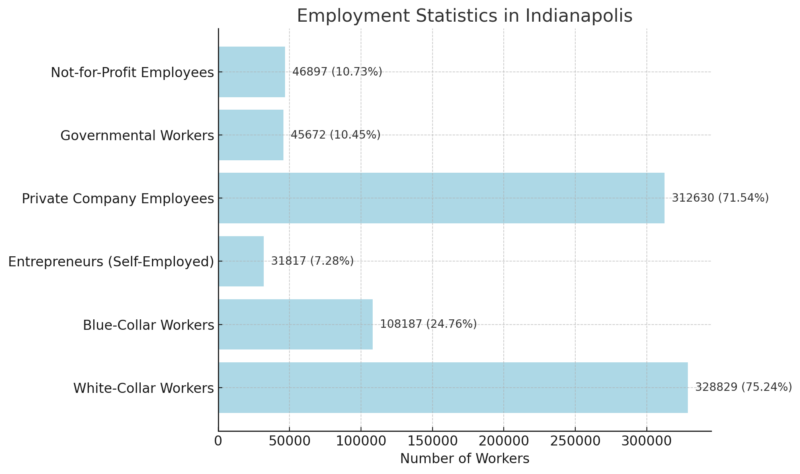
Indianapolis has a predominantly white-collar workforce (75.24%), with a smaller blue-collar segment (24.76%).
Employment in private companies is the largest category (71.54%), while government workers and nonprofit employees account for 10.45% and 10.73%, respectively.
Entrepreneurs make up 7.28% of the workforce, reflecting the city’s focus on small business and innovation.
The Y-o-Y changes show notable growth in government and nonprofit sectors (3.6% and 4.3%, respectively), indicating expanding opportunities in these fields.
Housing Market Overview
Metric
Value
Year-over-Year (Y-o-Y) Change
Median Sale Price
$240,000
+4.3%
Median Sale Price per Sq Ft
$135
+6.3%
Number of Homes Sold
895
+5.5%
Median Days on Market
30
+2 days
Sale-to-List Price
97.6%
+0.04 points
Homes Sold Above List Price
16.4%
+0.6 points
Homes with Price Drops
34.7%
+7.1 points
The median sale price of homes in Indianapolis has increased by 4.3% year-over-year, reaching $240,000, which remains 44% lower than the national average. This affordability makes Indianapolis an attractive market for buyers.
Redfin notes that the median price per square foot has also risen by 6.3% to $135, reflecting a consistent upward trend in property values.
There has been a 5.5% increase in the number of homes sold, rising from 848 last year to 895 in December 2024. This indicates strong demand in the market despite price increases.
Indianapolis remains a very competitive market, with homes receiving an average of two offers and selling within 30 days, which is slightly slower than last year’s 28 days.
The sale-to-list price ratio is 97.6%, meaning most homes sell slightly below their list price.
16.4% of homes are selling above list price, a slight increase of 0.6 percentage points from last year, showing increased competition for desirable properties.
34.7% of homes experienced price drops, a significant increase of 7.1 percentage points year-over-year.
This may indicate sellers adjusting to changing buyer expectations or attempting to counterbalance rising mortgage rates.
Educational Attainment in Indianapolis and Indiana
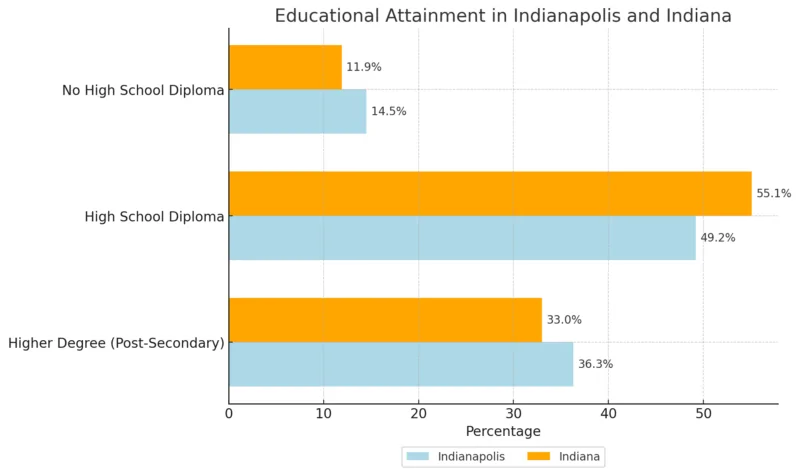
In Indianapolis, 36.3% of the population aged 25 and older have a higher degree, which is 3.3 percentage points higher than the Indiana average of 33.0%.
This indicates a higher proportion of individuals with advanced education in the city compared to the state.
Approximately 49.2% of Indianapolis residents hold only a high school diploma, which is 5.9 percentage points lower than Indiana’s statewide average of 55.1%.
This suggests a lower reliance on high school diplomas as the terminal level of education in Indianapolis.
About 14.5% of Indianapolis residents have not completed high school, which is 2.6 percentage points higher than Indiana’s average of 11.9%.
This indicates a slightly higher rate of educational disadvantage in Indianapolis compared to the state at large.
Relative Educational Attainment
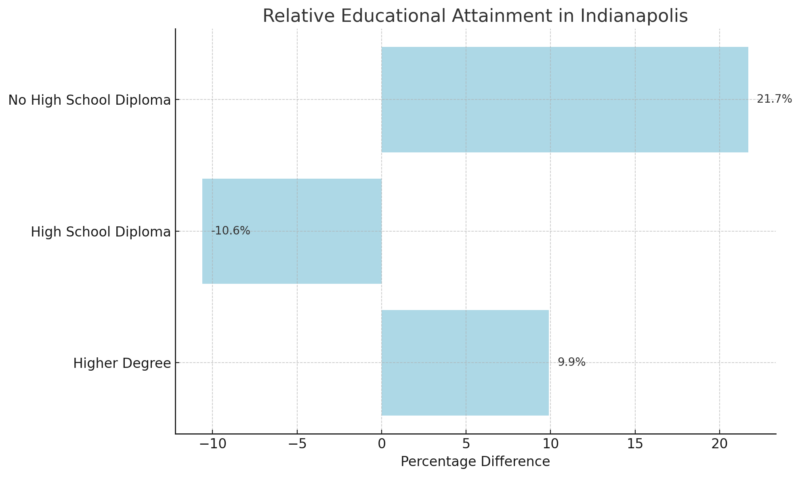
Indianapolis has a 9.9% higher share of residents with post-secondary education compared to the Indiana average, reflecting a stronger emphasis on advanced education in the city.
The city has a 10.6% lower share of residents with only a high school diploma compared to the state, indicating that a greater proportion of residents pursue higher education beyond high school.
The percentage of residents in Indianapolis without a high school diploma is 21.7% higher than the Indiana average, highlighting a potential challenge in addressing educational access and retention at lower levels within the city.
Methodology
This article synthesizes information from authoritative sources, including the U.S. Census Bureau, Bureau of Labor Statistics, and economic data aggregators. Data was analyzed to highlight population trends, economic contributions, and demographic insights.
Sector-specific growth and housing affordability were evaluated using regional and national benchmarks. Educational and labor force statistics were cross-referenced to ensure accuracy and context.
Finally, actionable insights were derived to present a concise profile of Baltimore’s socio-economic landscape.
References
- World Population Review – Indianapolis Population 2024
- Macrotrends – Indianapolis Metro Area Population 2024
- Statistical Atlas – Age and Sex Distribution in Indianapolis
- Best Neighborhood – Race in Indianapolis, IN
- Point2Homes – Indianapolis Demographics
- Redfin – Indianapolis Housing Market 2024
- Statistical Atlas – Population by Neighborhood in Indianapolis
- U.S. Census Bureau – Population Estimates for Indianapolis
- Bureau of Labor Statistics (BLS) – Employment and Labor Force Statistics for Indianapolis
- Economic Development Reports – Income and Poverty Data for Indianapolis