
NHANES is one of the clearest ways the United States measures what is happening inside the health of the country.
The full name is the National Health and Nutrition Examination Survey. It is run by the National Center for Health Statistics, which is part of the CDC. Its job is to measure the health and nutrition of adults and children across the U.S. population.
That may sound like a normal health survey at first. It is not. NHANES does not only ask people questions. It also brings selected participants into mobile exam centers, measures their bodies, checks blood pressure, collects blood and urine samples, and records detailed diet information.
That is why the survey has become so important. It can show health problems people already know about, but it can also find risk that is hidden. High blood pressure, diabetes, kidney problems, nutrient deficiencies and environmental exposures can all exist before a person feels sick or receives a diagnosis.
What NHANES Measures?
NHANES is designed to measure the health and nutritional status of people in the United States. The survey gives researchers a national picture of disease risk, diet, growth, body size, lab markers and exposure to some environmental chemicals.
The CDC describes NHANES as the only national survey that includes health exams and laboratory tests for all ages. That makes it different from surveys that rely only on what people remember or report.
NHANES helps answer questions such as:
- How many adults have high blood pressure?
- How many people have diabetes but do not know it?
- Are obesity and severe obesity changing over time?
- Are children growing within expected ranges?
- Are Americans getting enough key nutrients?
- Are lead, mercury or other chemicals showing up in blood or urine?
- Which age, income or racial groups face higher health risk?
- Are public health problems getting better or worse?
The survey is used by federal agencies, universities, doctors, hospitals, researchers and policymakers. It supports clinical guidance, health reports, growth charts, environmental monitoring and nutrition policy.
Why NHANES Is More Useful Than A Regular Survey?
A regular survey can ask a person if a doctor ever diagnosed high blood pressure. NHANES can measure blood pressure during the exam.
A regular survey can ask if someone has diabetes. NHANES can use lab tests to identify people who may have diabetes but have not been diagnosed.
A regular survey can ask about diet. NHANES can compare diet answers with lab markers, body measurements and health conditions.
| Type Of Information | What NHANES Collects | Why It Matters |
|---|---|---|
| Interview Data | Health history, income, access to care, lifestyle, diet and supplement use | Shows what people report about their health and daily life |
| Exam Data | Height, weight, blood pressure, body measures, dental checks and other tests | Provides direct measurements instead of self-report alone |
| Lab Data | Blood and urine markers, glucose, cholesterol, kidney markers and environmental chemicals | Finds health risks that may not have symptoms |
| Diet Data | Food, drinks, nutrients and supplement use | Connects nutrition patterns with measured health markers |
The power of NHANES comes from that combination. It does not only ask how healthy people think they are. It helps measure what their bodies show.
How NHANES Started?
The roots of NHANES go back to federal efforts to collect national health data through direct examinations. The National Health Survey Act of 1956 helped create the legal foundation for national health surveys.
Early health examination surveys focused on physical measurements and health conditions. In the 1970s, nutrition became a core part of the work, and the program became NHANES.
| Period | What Changed | Why It Mattered |
|---|---|---|
| 1960 To 1962 | The National Health Examination Survey examined adults. | The federal government began collecting direct health measurements at national scale. |
| 1971 To 1974 | NHANES I added nutrition to health exams. | Researchers could connect diet, lab markers and health status. |
| 1976 To 1980 | NHANES II expanded age coverage. | Children and older adults became a larger part of national health measurement. |
| 1988 To 1994 | NHANES III expanded chronic disease, nutrition and exposure data. | The survey became a major source for disease and risk factor research. |
| 1999 Onward | NHANES became a continuous survey. | Repeated cycles made it easier to track national health trends. |
Continuous NHANES does not mean live tracking. Fieldwork takes time. Lab processing takes time. Data review takes time. Public files are released after review. The value is that the country gets repeated national measurements that can be compared carefully over time.
How NHANES Works Today?

NHANES uses a national probability sample. People are selected from communities across the country so the results can represent the civilian, noninstitutionalized U.S. population.
People cannot volunteer into the survey on their own. That rule is important. If anyone could join, the survey might attract people who already care more about health, nutrition or research. A selected sample gives researchers a better national picture.
Selected households are contacted by NHANES. Participation is voluntary. People who take part usually complete an interview and may be invited to an exam in a mobile examination center.
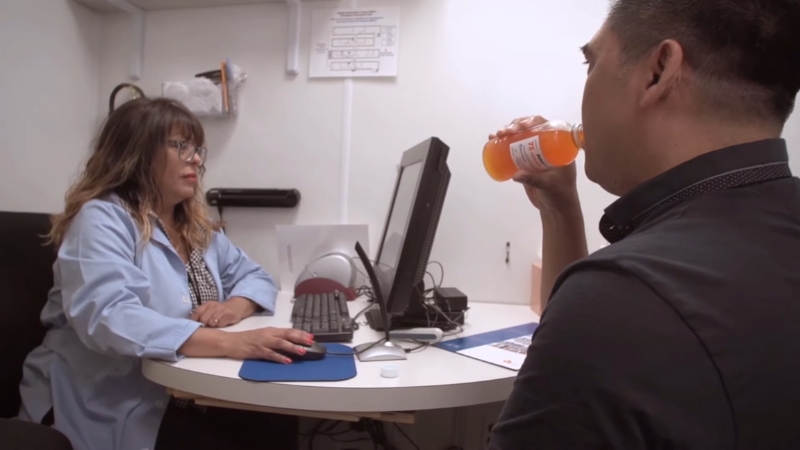
Household Interviews
Interviewers collect information about health history, access to care, diet, supplement use, physical activity, tobacco use, alcohol use, living conditions and demographic background.
Some questions change by age, survey cycle and research priority. A child, an older adult and a pregnant participant may not receive the exact same set of questions.
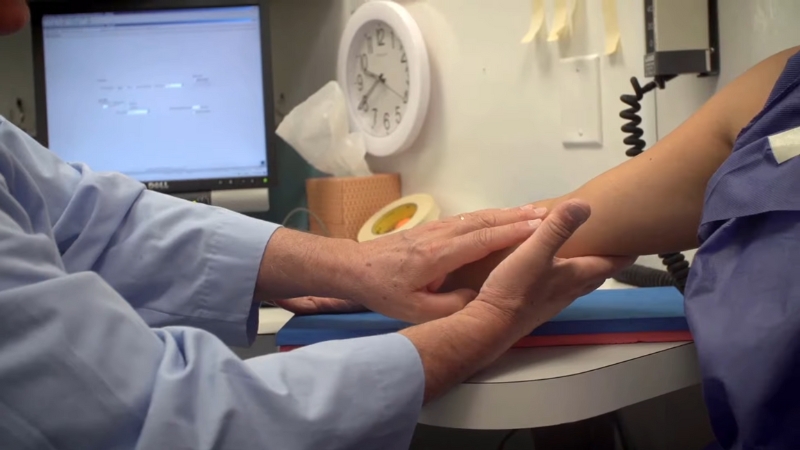
Mobile Examination Centers
Participants may be invited to a mobile examination center, often called a MEC. These are specially built exam units that travel to selected communities.
Exams can include height, weight, waist circumference, blood pressure, dental checks, vision or hearing measures, body composition and other tests. The exact components depend on the cycle.
Standard procedures matter. A blood pressure reading, body measurement or lab sample must be collected in the same careful way across locations so the data can be compared.
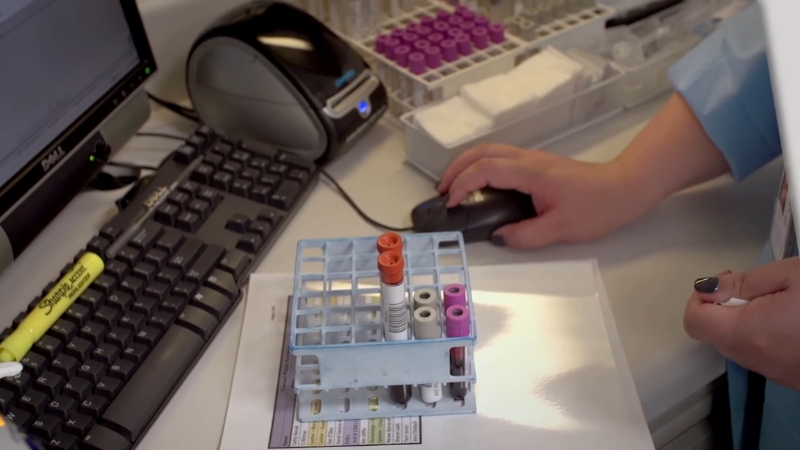
Lab Tests And Biospecimens
Blood and urine samples allow NHANES to measure health markers that people may not know. Examples include cholesterol, blood sugar, kidney markers, nutritional biomarkers and environmental chemicals.
The NHANES biospecimen program also stores certain DNA, serum, plasma and urine specimens for approved health research.
Sampling And Survey Weights
NHANES is not designed to examine every person in the country. It is designed to study a carefully selected sample and use survey weights to make national estimates.
Survey weights help adjust for selection probability, nonresponse and the structure of the sample. Without them, the results can be wrong.
That is why NHANES is powerful but not casual. A researcher cannot simply download the file, count rows and call that a national estimate. Good analysis must account for weights, strata, clusters, lab subsamples, missing data and release documentation.
- NHANES uses a selected sample, not volunteers.
- Survey weights help turn the sample into national estimates.
- Some lab tests are done only on subsamples.
- Trend comparisons require checking whether methods changed.
- Ignoring the survey design can produce misleading results.
How NHANES Changed After The Pandemic?
NHANES field operations were suspended in March 2020 because of the COVID-19 pandemic. CDC later released a pre-pandemic file covering 2017 through March 2020. A new post-pandemic cycle began in August 2021.
The August 2021 To August 2023 release notes explain that the files are nationally representative and are based on an updated sample design with modified questionnaires and examination procedures.
CDC also lists NHANES 2025 To 2026 documentation, including questionnaires, lab methods, codebooks and procedure manuals.
The post-pandemic period matters because health behavior, care access and survey operations all changed after 2020. Researchers need to read release notes before comparing recent data with older cycles.
Recent NHANES Findings That Show Why It Matters
NHANES has shaped public health because it measures real health markers. Recent reports show why that matters.
Hypertension
NCHS reported that 47.7% of U.S. adults had hypertension during August 2021 to August 2023 when using the 2017 ACC/AHA definition.
Among adults with hypertension, 59.2% were aware of it, 51.2% reported treatment and 20.7% had controlled hypertension. Those numbers show why blood pressure remains a major public health issue.
You should also check our guide to normal blood pressure by age.
Diabetes
NCHS also used NHANES to estimate diabetes prevalence among U.S. adults during August 2021 to August 2023. The report found total diabetes at 15.8%, diagnosed diabetes at 11.3% and undiagnosed diabetes at 4.5% among adults age 20 and older.
The undiagnosed figure is the point. A person can report no diabetes diagnosis and still have lab values that meet diabetes criteria. That is the kind of gap NHANES can reveal.
Older Adults And Chronic Disease
NHANES is useful for studying older adults because it measures conditions and risk factors that become more common with age. That includes blood pressure, diabetes, kidney markers, body composition, anemia, nutrition and medication-related questions.
Our reporting on chronic disease among older adults shows why measured data matters as the country ages.
Obesity And Metabolic Health
NHANES connects diet, weight, body measurements and lab values in one system. That helps researchers study obesity, cholesterol, blood sugar, nutrient intake and supplement use together.
That kind of data will stay important as obesity treatment changes. Our coverage of GLP-1 medication use among American women shows why national measurement will matter as more people use newer weight loss and diabetes drugs.
Child Growth Charts
NHANES measurements helped build the growth references used in pediatric care. CDC growth charts help clinicians track infant, child and adolescent growth over time.
A growth chart is not a diagnosis by itself. It helps doctors see patterns that may need more attention.
Lead Exposure
NHANES has also been central to national blood lead monitoring. CDC says state surveillance data are not population-based estimates and that NHANES is the best available source for nationally representative prevalence estimates of higher blood lead levels in U.S. children.
That matters because lead exposure can be uneven across housing, income, geography and age. National estimates help show the broader burden, while local testing helps target response.
How NHANES Supports Public Health Decisions?
NHANES helps public health officials move from impressions to measurements. It can show how common a problem is, which groups are affected and whether a health trend is improving or getting worse.
The survey has supported work on:
- Blood pressure awareness and control
- Diabetes diagnosis and risk
- Child growth monitoring
- Obesity and body composition
- Food intake and nutrient status
- Supplement use
- Environmental chemical exposure
- Kidney disease markers
- Oral health
- Health disparities
The CDC brings many of these outputs together through its NHANES results and publications page, which includes reports, dashboards and other resources.
How Researchers Use NHANES Data?
NHANES public-use files are widely used by universities, federal agencies, hospitals and policy researchers. Researchers can download questionnaires, datasets, codebooks and documentation from CDC.
NCHS provides public-use files with privacy protections. The NCHS data user agreement says public-use files must be used for statistical analysis or reporting and not for trying to identify participants.
Some data are too sensitive for public files. Exact geography, exact dates and certain linked data may require restricted access. Researchers who need that level of detail may have to work through the NCHS Research Data Center.
For researchers, NHANES is useful but demanding. Good analysis requires reading documentation, using correct weights, checking lab methods and respecting privacy rules.
Quality Control Is What Makes The Data Useful
NHANES data are only useful if measurements are reliable. That requires trained staff, standard procedures, calibrated equipment, careful lab work and review before files are released.
Quality control matters for basic measures such as height, weight and blood pressure. It also matters for lab tests, where specimen handling and method changes can affect results.
Quality control also matters during analysis. Researchers have to account for sample design, response rates, lab subsamples and changes between cycles.
What NHANES Can And Cannot Tell Us?
NHANES is powerful, but it has limits. It is best for national estimates and broad group comparisons. It is not built to answer every local or individual question.
| NHANES Can Tell Us | NHANES Usually Cannot Tell Us |
|---|---|
| National estimates for many health measures | Exact counts for every city, county or state |
| How common some conditions and risk factors are | Whether one person will develop a disease |
| Measured health markers from exams and labs | Every possible diagnosis in a medical record |
| Trends when methods are comparable | Perfect comparisons when methods changed |
| Differences across broad population groups | Very detailed local estimates from small communities |
NHANES is also mainly cross-sectional. It measures people at a point in time. Some linked files and special studies allow more analysis, but the main public-use files are not the same as long-term medical follow-up for every participant.
Response Rates Are A Real Challenge
Response rates matter because surveys become harder to interpret when fewer selected people take part. NHANES faces the same challenge as many federal surveys.
Healthy People documentation reports that for NHANES August 2021 to August 2023, 22,660 people were eligible, 11,933 were interviewed and 8,860 completed the health examination component. That equals 34.5% interviewed and 25.6% examined, according to the federal page on NHANES as a Healthy People data source.
CDC also publishes NHANES response rate files for researchers who need more detail.
Low response rates do not make NHANES useless. They do mean analysts need to take sample design, weighting and nonresponse evaluation seriously.
Privacy And Participant Trust
NHANES depends on public trust. Participants share sensitive health information, exam results and biological specimens. That requires strong privacy protection.
Public-use files remove direct identifiers. More sensitive files are restricted. Researchers who want access to restricted variables must apply through controlled systems and follow rules meant to protect participants.
That balance is important. Public health research needs detailed data, but participants need protection from identification or misuse.
Current Challenges For NHANES
NHANES remains important because U.S. health keeps changing. It also faces real pressure.
Participation
Lower response rates can increase uncertainty. NHANES needs selected households to participate so national estimates remain reliable.
Cost
Mobile centers, trained staff, lab testing, travel, specimen handling and data processing make NHANES expensive. That cost is also part of why the data are valuable.
Method Changes
New equipment, new questions and new lab methods can make trend analysis harder. Researchers need to check documentation before comparing cycles.
Privacy
More detailed data can help researchers, but it can also increase disclosure risk. NHANES has to protect participant identity while keeping data useful.
FAQs
Final Takeaway
NHANES is one of the most important public health data systems in the United States because it combines what people report with what trained staff measure.
That approach helps the country track chronic disease, nutrition, child growth, obesity, environmental exposure, blood pressure, diabetes and health disparities. It also gives researchers a way to find problems that may be missed by medical records or self-reported surveys.
The survey has limits. It is not local enough for every city or county. Response rates remain a challenge. Methods can change between cycles. Privacy rules limit some data access.
Even with those limits, NHANES still fills a role that few data systems can replace. It helps the country see health more clearly, using real measurements from real people across the United States.