As of 2025, the population of Chicago, Illinois is approximately 2,746,388, marking a notable shift from previous years according to data from Census.
This dynamic landscape reflects broader demographic trends that impact everything from city planning to cultural vibrancy.
Beyond the city limits, the Chicago metro area has experienced growth, with the population reaching nearly 8.98 million as per Macrotrends.
These statistics underscore the complexity and diversity that continue to define Chicago’s population.
Key Takeaways
- Chicago’s population declined to 2,746,388 in 2025, continuing a trend of -0.99% annual decrease since 2020.
- Chicago’s unemployment rate reached 6.2%, the highest among major U.S. metro areas.
- Domestic outmigration is the main reason for population decline, driven by high taxes and the search for better opportunities.
- Chicago’s racial composition is 53.1% White, 20.7% Hispanic, 15.2% Black, and 8.1% Asian, showing a diverse demographic landscape.
- Chicago has a high crime index of 6 (100 being the safest), with 98,997 total reported crimes and property crimes being the most prevalent.
- Healthcare is Chicago’s largest employment sector, employing 189,578 people, making up 13.7% of the workforce.
1. Population Size and Growth

The city has been experiencing a decrease in residents at a rate of about -0.99% annually. This trend reflects broader urban challenges and opportunities, influencing housing, employment, and urban planning dynamics.
The Chicago metropolitan area, however, presents a slightly different picture, with its population growing modestly by 0.53% to reach 8,984,000 as per Macrotrends research. Compared to the past few years, this indicates varying growth patterns between the city core and its surrounding areas.
2. Age Distribution
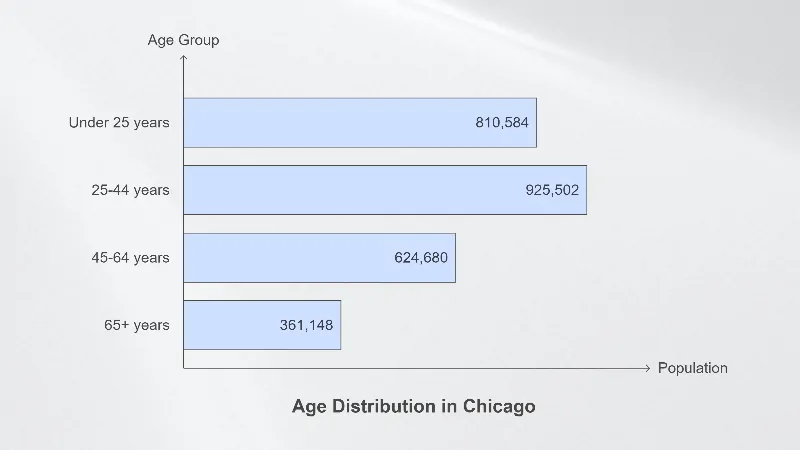
- The largest age group in Chicago is the 25-44 years category, which makes up a significant portion of the total population.
- The elderly population (aged 65 and above) stands at 361,148, making up a smaller portion of the overall population compared to other age groups.
Chicago, IL Population by Age Cohort
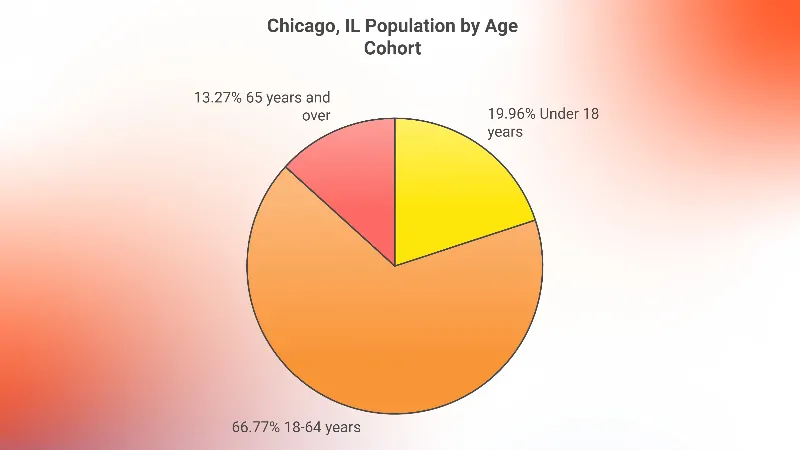
Key Observations
- The adult cohort (18-64 years) constitutes the largest proportion of Chicago’s population at 66.77%.
- The children cohort (under 18 years) makes up 19.96% of the total population.
- Seniors aged 65 years and above represent 13.27% of Chicago’s population.
It’s clear that the population of Chicago is predominantly made up of adults aged 18-64 years, making up 66.77% of the population. This is a significant indicator of the city’s working-age population, highlighting Chicago as a city that has a considerable workforce.
The 25-29 age group stands out as the largest specific age group, indicating a strong presence of young adults. This could reflect a dynamic urban population driven by professionals, students, and young families, according to Neilsberg’s research.
The elderly population, while significant, is still relatively small compared to the younger age groups, which may point to a potentially younger overall population demographic or migration patterns favoring younger residents.
The smallest population cohort is 80-84 years, which could reflect a variety of factors such as health and life expectancy trends or retirement migration away from the city.
This age distribution provides important insights into planning for city services, such as schools, healthcare, and community services, catering primarily to young adults, families, and seniors.
3. Ethnic and Racial Composition
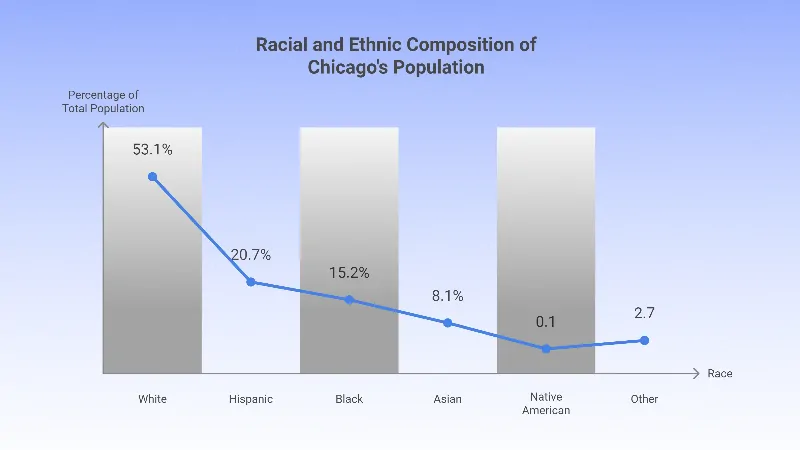
- The largest racial group in Chicago is White, comprising 53.1% of the population. This makes White residents the majority demographic within the city.
- The Hispanic population is the second largest racial/ethnic group, representing 20.7% of the city’s population, followed by the Black population at 15.2%.
- Asian residents make up 8.1% of the population, reflecting a smaller yet significant community.
- The Native American population is the smallest, accounting for just 0.1%, while Other races represent 2.7%.
The racial composition of the population of Chicago reflects a diverse urban population with a mix of ethnic backgrounds. The White population forms the majority, but a considerable portion of the city’s residents are Hispanic and Black, highlighting Chicago’s multi-ethnic nature according to Best Neighborhood.
The Hispanic community, at 20.7%, is the largest minority group, indicating a strong cultural presence that shapes many aspects of the city’s identity, such as language, festivals, and local businesses. The Black population, at 15.2%, is also a significant part of the demographic landscape, contributing richly to Chicago’s culture, history, and economy.
The Asian population at 8.1% further adds to the city’s multicultural character, contributing to the diversity of neighborhoods, educational institutions, and business sectors.
The Native American and Other races groups have smaller representations, yet they are crucial for understanding the full mosaic of Chicago’s racial diversity.
- Fun fact:According to some estimates, around 350,000 ethnic Serbs live in the Chicago area.
4. Population by Neighborhood
Rank
Neighborhood
Population
1
Logan Square
85,000
2
Little Village
80,460
3
West Rogers Park
65,010
4
Albany Park
57,200
5
South Austin
56,850
6
Archer Heights
55,070
7
Rogers Park
54,990
8
Lake View
53,040
9
Gresham
50,800
10
Englewood
49,560
11
Brighton Park
46,260
12
South Shore
44,820
13
Portage Park
43,600
14
Humboldt Park
41,600
15
Jefferson Park
41,050
16
Gage Park
39,560
17
Cragin
39,120
18
Back of the Yards
38,910
19
Bridgeport
38,030
20
Lake View East
37,740
21
West Lawn
35,430
22
South Loop
31,860
23
Edgewater Beach
31,400
24
Marquette Park
31,170
25
Belmont Central
31,080
26
West Pullman
29,640
27
Bronzeville
29,310
28
South Chicago
28,290
29
Ravenswood
27,790
30
Garfield Ridge
25,660
31
West Englewood
25,520
32
North Austin
24,160
33
East Side
23,370
34
Uptown
22,090
35
Near North
21,790
36
West Town
21,570
37
Roseland
21,370
38
Streeterville
21,160
39
East Garfield Park
21,130
40
Hermosa
20,910
41
Heart of Chicago
20,260
42
Chicago Lawn
18,910
43
Chatham
18,880
44
Hyde Park
18,430
45
University Village – Little Italy
18,350
46
West Elsdon
18,160
47
Avondale
18,000
48
Bucktown
17,310
49
North Center
17,130
50
Morgan Park
16,990
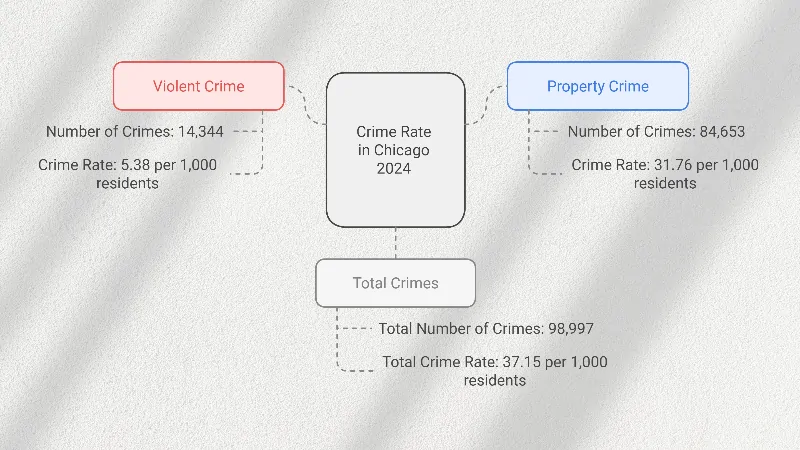
5. Crime Rate in Chicago 2024
- Total Crime Index: 6 (with 100 being the safest), indicating that Chicago is safer than only 6% of U.S. cities. This suggests that crime levels are significantly higher compared to most places in the United States.
Annual Crime Breakdown
Key Observations
- Total reported crimes in Chicago for the most recent year are 98,997, with a crime rate of 37.15 per 1,000 residents according to Neighborhood Scout.
- Property crimes make up the majority, accounting for 84,653 incidents, with a rate of 31.76 per 1,000 residents.
- Violent crimes are reported at 14,344 cases, with a rate of 5.38 per 1,000 residents.
Violent Crime Details
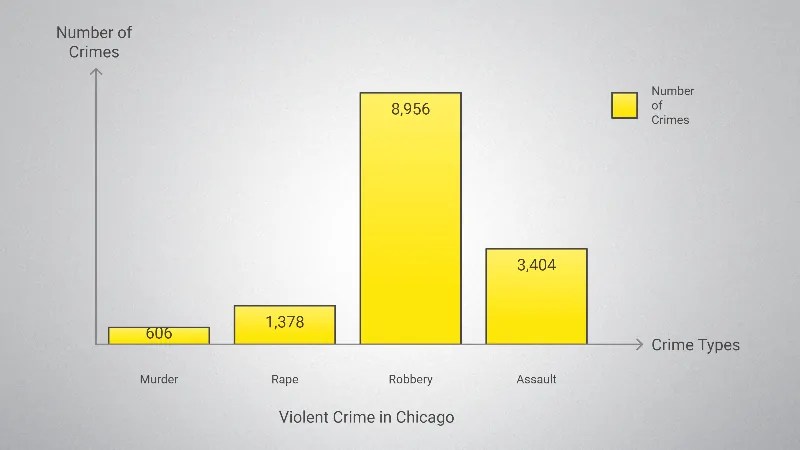
Key Observations
- Robbery is the most prevalent form of violent crime, with 8,956 reported incidents and a rate of 3.36 per 1,000 residents.
- Assault follows with 3,404 incidents (1.28 per 1,000 residents).
- Murder and rape rates are relatively lower, with 606 murders (0.23 per 1,000) and 1,378 rapes (0.52 per 1,000).
- Compared to national averages, Chicago has significantly higher rates for robbery and murder, while the assault rate is lower than the national rate of 2.68 per 1,000 residents.
Chances of Becoming a Victim of a Violent Crime
- In Chicago, the likelihood of becoming a victim of violent crime is 1 in 186, compared to 1 in 348 for the entire state of Illinois. This highlights a considerably higher risk for residents of Chicago compared to the state average.
Property Crime Details
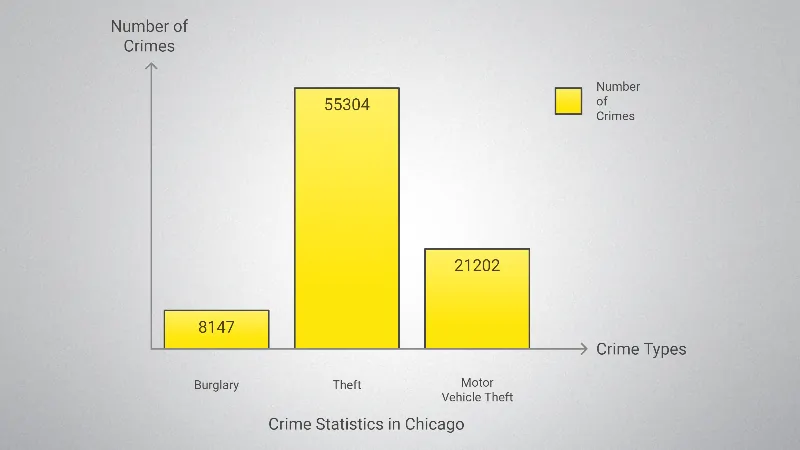
Key Observations
- Theft is the most common property crime, with 55,304 incidents and a rate of 20.75 per 1,000 residents, which suggests that theft constitutes the bulk of property crimes in Chicago.
- Motor vehicle theft is also a significant issue, with 21,202 reported incidents and a rate of 7.96 per 1,000 residents.
- Burglary is less common, but still notable, with 8,147 cases (3.06 per 1,000 residents).
- In comparison to national rates, Chicago’s theft and motor vehicle theft rates are substantially higher than the U.S. averages of 14.02 and 2.83 per 1,000 residents respectively.
Chances of Becoming a Victim of a Property Crime
- Residents in Chicago have a 1 in 31 chance of being a victim of a property crime, which is significantly higher than the state average of 1 in 59.
Comparative Analysis with National Data
Violent Crimes in the U.S.
- The murder rate in Chicago (5.38 per 1,000 residents) is notably higher than the national rate of 0.06 per 1,000.
- Robbery rates in Chicago (3.36 per 1,000 residents) are also significantly higher compared to the national average of 0.66 per 1,000.
Property Crimes in the U.S.
- The theft rate in Chicago (20.75 per 1,000 residents) is considerably higher than the national average of 14.02 per 1,000.
- Motor vehicle theft rates are also high in Chicago compared to the national rate, with 7.96 per 1,000 residents compared to 2.83 per 1,000 nationally.
6. Unemployment Rates
Key Insights
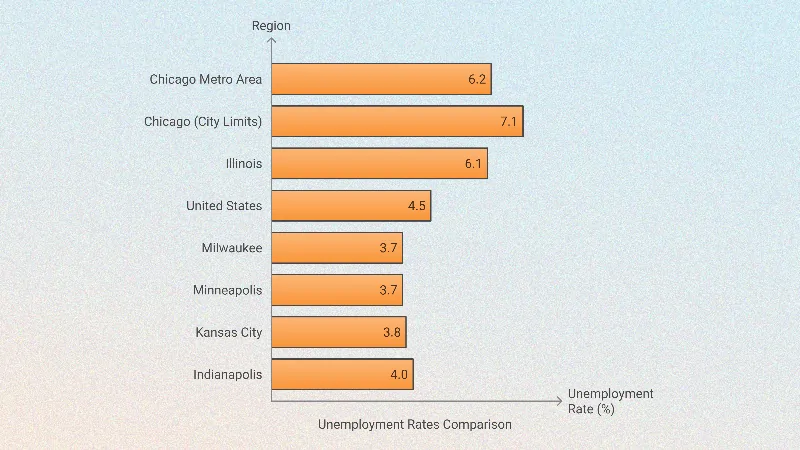
- BLS notes that Chicago Metro Area has the highest unemployment rate of the nation’s 50 largest metro areas, at 6.2%.
- Within Chicago city limits, the unemployment rate is even higher at 7.1%, up from 5.3% in June 2023.
- Nearly 100,000 Chicagoans are unemployed, representing an increase of 26,000 compared to last year.
- Comparatively, other Midwestern cities, such as Milwaukee and Minneapolis, have much lower unemployment rates (3.7%), significantly below Chicago’s levels.
7. Educational Attainment
School Type
Elementary Schools
High Schools
Total Schools
District-run
423
91
514
Charter
53
58
111
Contract
1
6
7
SAFE
–
2
2
Grand Total
477
157
634
Key Facts
- Total Number of Students: 323,251 were enrolled at the start of the 2023-2024 school year according to CPS.edu.
- Total Schools: 634, comprising district-run, charter, contract, and SAFE schools.
- The majority of schools are district-run, with 423 elementary and 91 high schools.
- Charter schools include 53 elementary and 58 high schools.
- Contract schools and SAFE schools make up a smaller portion, with only 7 contract schools and 2 SAFE high schools.
8. Housing and Living Conditions
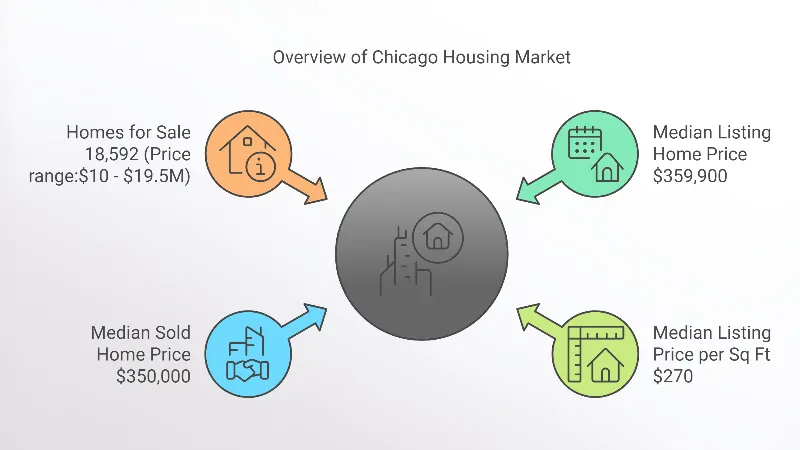
- The median listing home price in Chicago is $359,900, with a median sold price slightly lower at $350,000, indicating a potentially competitive market with negotiation in prices according to Realtor.
- The median listing price per square foot stands at $270, which can provide an estimate for buyers comparing home values by size.
- 18,592 homes are currently available for sale, with prices ranging widely from $10 (likely a symbolic or auction price) to $19.5 million, reflecting a diverse market with various property types across Chicago’s 78 neighborhoods.
9. Health and Wellbeing

The healthcare sector is the largest employment industry in Chicago, employing 189,578 people, which constitutes 13.7% of the city’s workforce according to Census gov. This highlights the central role that healthcare plays not only in public services but also in driving economic growth through job creation.
Metric
Value
Number of People Employed
189,578
Share of Workforce
13.7%
Sector Rank in Employment Size
1st (Largest Industry)
10. Economy and Employment
Metric
Value
Total Employment
1.38 million
1-Year Change
-0.0184%
Largest Industry
Health Care & Social Assistance (13.7%)
Highest Paying Industry
Mining, Quarrying, & Oil & Gas Extraction ($98,750)
Key Observations
- The Chicago economy employs approximately 1.38 million people or 3.06 for the greater metro area according to Roosevelt University, with only a slight decline of 0.0184% in employment from 2021 to 2022.
- The Health Care & Social Assistance sector is the largest industry, employing 189,578 people or 13.7% of the workforce.
- Professional, Scientific, & Technical Services and Educational Services are also major employers, engaging 13% and 10% of the workforce, respectively.
Industries in Chicago
Industry
Number of Employees
Share of Workforce (%)
Health Care & Social Assistance
189,578
13.7%
Professional, Scientific, & Technical Services
179,115
13%
Educational Services
138,785
10%
Retail Trade
–
8.36%
Manufacturing
–
7.75%
Accommodation & Food Services
–
7.08%
Transportation & Warehousing
–
6.72%
Key Observations
- Health Care & Social Assistance employs the largest share of Chicago’s population, showing the importance of healthcare infrastructure to the local economy.
- Professional, Scientific, & Technical Services follows closely, reflecting Chicago’s role as a hub for professional expertise and innovation.
- Educational Services is the third-largest industry, highlighting the strength of Chicago’s educational institutions.
- The highest paying industries include Mining, Quarrying, & Oil & Gas Extraction with average earnings of $98,750, followed by Management of Companies & Enterprises at $93,766, and Utilities at $93,410.
Employment by Occupation
Occupation
Number of People Employed
Share of Workforce (%)
Management Occupations
160,331
11.6%
Office & Administrative Support Occupations
136,550
9.89%
Sales & Related Occupations
122,402
8.86%
Business & Financial Operations
–
8.54%
Education, Instruction, & Library
–
6.41%
Food Preparation & Serving Related
–
5.14%
Key Observations
- Management Occupations are the most common jobs, employing 11.6% of the workforce. This reflects the presence of a significant number of corporate offices and businesses in Chicago.
- Office & Administrative Support and Sales & Related Occupations follow, making up 9.89% and 8.86% of the workforce respectively, indicating a substantial administrative and service sector.
- Other notable occupations include Education, Instruction, & Library (6.41%) and Food Preparation & Serving (5.14%), emphasizing the city’s diverse employment opportunities across various service sectors.
Income and Earnings
Income Inequality
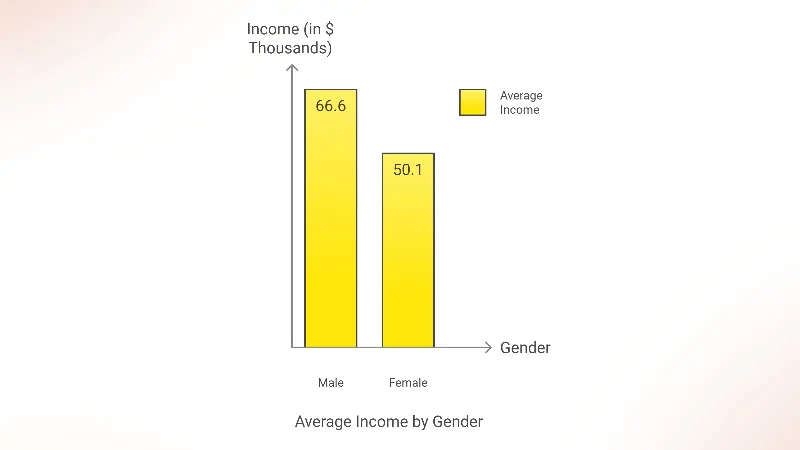
- The average income for males in Illinois is 1.33 times higher than that for females, indicating a significant gender income disparity. The average income for females is estimated at approximately $50,052 according to DATAUSA.IO.
- The Gini index for income inequality in Illinois is 0.477, which is lower than the national average, suggesting a moderately unequal income distribution but still better than many other states.
Highest Paying Jobs by Gender
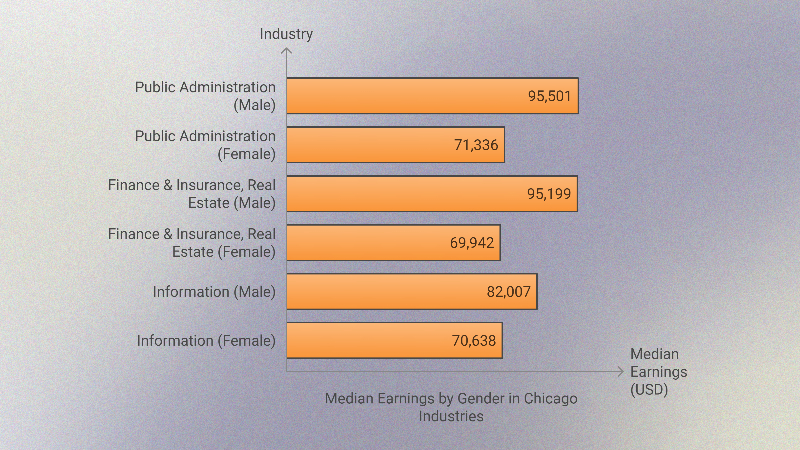
Key Observations
- Public Administration offers the highest median earnings for both men and women, with males earning $95,501 and females earning $71,336.
- Finance & Insurance, and Real Estate also rank highly for both genders, showing strong career opportunities in these industries.
- While women earn significantly less compared to men across industries, Information stands out as a sector where women’s earnings are relatively competitive compared to other sectors.
The Gini index stands at 0,483 indicates moderate income inequality, suggesting disparities in income distribution still persist but are somewhat mitigated compared to the broader national average according to government officials.
For policymakers and city planners, these insights emphasize the need for strategic support in high-employment industries like healthcare and education, and efforts to reduce income inequality, particularly along gender lines. Encouraging growth in industries with high-paying jobs, while fostering equal access, can help improve both economic equity and overall prosperity in Chicago.
11. Migration Patterns
More migrants in Chicago to be evicted from shelters as new facility opens https://t.co/rI1T5uK5DL
— NBC Chicago (@nbcchicago) June 11, 2024
Domestic migration in Chicago has seen fluctuations, with noticeable trends impacting the city’s population. From the 2023 Census data, it is clear that the Chicago area has faced significant population losses for the third year in a row.
The third-worst in terms of loss among major U.S. metropolitan areas, Chicago’s net outflow highlights mobility patterns within the country. Contributing factors include the search for affordable living and economic opportunities elsewhere.
Though there are challenges, Chicago remains attractive to residents from nearby cities like St. Louis, likely due to geographic proximity and connectivity. This movement can affect local real estate, employment sectors, and cultural integration while offering new opportunities for local businesses and communities.
International Immigration
International immigration bolsters Chicago’s diverse cultural fabric. In the past year and a half, over 36,000 migrants have arrived, adding to the city’s rich multicultural environment. This influx plays a vital role in filling labor gaps, contributing to local economic growth, and fostering a globalized community atmosphere.
Many international migrants come from regions impacted by economic disparities or social upheaval, seeking better opportunities in the city. This ongoing trend underscores the importance of inclusive policies and resources to support successful integration. It maintains Chicago’s status as a hub for growth and innovation driven by a diverse population.
12. Predicted Future Demographics
Year
Population
Change (%) from Previous Period
2020
2,699,347
–
2025
2,782,240
+1.2% (from 2020)
2030
2,859,007
+1% (from 2025)
- 2020 Population: The population of Chicago was 2,746,388 as per the latest U.S. Census.
- Projected Growth: Chicago’s population is projected to increase to 2,782,240 by 2025, reflecting a 1.2% growth from 2020. By 2030, the population is expected to reach 2,859,007, a 1% increase from 2025.
View this post on Instagram
These projections indicate a slow but steady growth rate for Chicago over the next decade, which could suggest gradual improvements in economic factors or policies impacting urban livability. However, this growth also comes amidst a backdrop of outmigration, emphasizing that retaining residents could be key to achieving these projected figures.
The city will continue to experience demographic shifts. The median age across the United States is predicted to rise, impacting Chicago as well. With many states expecting over a quarter of their population to be older than 65 by 2030, Chicago could see an increase in its aging population as well.
Methodology
This was created using data aggregation and analysis from multiple reputable sources, including:
- U.S. Census Bureau and World Population Review for population statistics.
- Macrotrends for metropolitan growth estimates.
- Chicago Public Schools (CPS) reports for education data.
- Neighborhood Scout for crime statistics.
- Census.gov for healthcare employment figures.
- Illinois Policy and other state data repositories for economic and unemployment insights.
All information was collated to provide a comprehensive and concise understanding of Chicago’s demographic, economic, and social conditions. Data from surveys, government reports, and local databases helped shape an accurate reflection of the current situation and forecast trends. The insights were distilled to identify critical areas of change and inform readers about the key issues affecting Chicago’s future.