
The current population of Milwaukee, Wisconsin, in 2025 is 556,111. The city has been experiencing a decline at an annual rate of -0.94%, with a total population decrease of -3.65% since the 2020 census, which recorded 577,207 residents according to World Population Review.
The metro area population reached approximately 1,473,000, a modest increase of 0.68% from the previous year, according to Macrotrends.
Milwaukee’s demographic changes are influenced by a variety of factors, including natural increases and migration patterns. The city continues to attract new residents thanks to its economic opportunities and cultural assets, even as it manages shifts within its urban core.
Key Takeaways
- Milwaukee’s population is 556,111 (2025), declining at -0.94% annually, while the metro area has grown to 1.47 million (+0.68%).
- The city’s median age is 31.8, with a youthful population; 25.22% are aged 15-29, and 11.35% are seniors (65+).
- Racially diverse, Milwaukee’s population is 38.76% White, 38.61% Black, 9.93% multiracial, and 4.75% Asian.
- Median home prices rose 23.4% to $216K; homes sell in 49 days, with 32.6% selling above the asking price.
- Milwaukee’s average income is $67,046; however, 17.5% of residents lack a high school diploma, 102.4% above the state average.
- The job market is stable with 3.4% unemployment, yet wages ($30.11/hr) remain below the national average ($31.48/hr).
Population Trends and Economic Outlook
View this post on Instagram
Milwaukee currently ranks 4th among major U.S. cities for child poverty, with 43% of children living in poverty. While the city’s unemployment rate aligns with the national average, its job market shows stability and improvement.
80% of college graduates moving to Milwaukee do so for employment opportunities. Downtown revitalization efforts aim to attract residents and drive growth.
Milwaukee has seen slow population growth, mainly in downtown neighborhoods due to new condo and apartment developments. From 2011 to 2013, the city added 4,000 residents, signaling a turnaround after five decades of decline. However, long-term growth trends remain uncertain.
Originally home to Native American tribes, Milwaukee was settled by French traders in the late 17th century. The city’s name comes from a Potawatomi or Ojibwe word meaning “gathering place by the water.” Incorporated in 1846, Milwaukee saw rapid immigrant-driven growth, peaking at 741,000 residents in 1960 before experiencing a prolonged population decline.
Milwaukee, WI Population Age Distribution
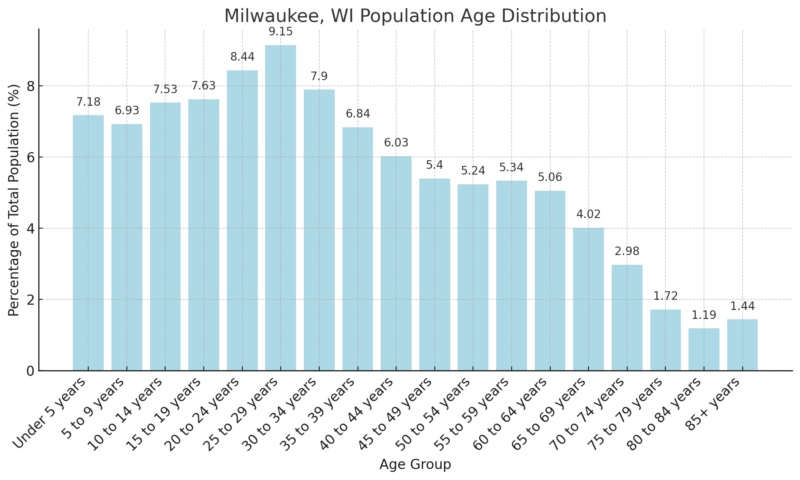
The median age in Milwaukee is 31.8 years, based on 2018-2022 ACS 5-Year Estimates. Below is a breakdown of the city’s age demographics.
Milwaukee’s population is youthful, with 21.64% under the age of 15 and 25.22% between 15-29 years. Adults aged 30-64 years make up 41.81%, while seniors aged 65+ account for 11.35% of the population.
Key Population Statistics
Category
Value
Median Age (Total)
31.8 years
Median Age (Male)
30.9 years
Median Age (Female)
32.8 years
Total Adults
426,146
Total Seniors (65+ Years)
65,007
Age Dependency Ratio
58.7
Old Age Dependency Ratio
18.0
Child Dependency Ratio
40.7
Total Female Population
294,474 (51.36%)
Total Male Population
278,825 (48.64%)
Milwaukee has a median age of 31.8 years, indicating a relatively young population. Males have a slightly lower median age of 30.9 years, while females have a median age of 32.8 years. This suggests that women, on average, live slightly longer than men, contributing to a higher median age among females.
The total adult population is 426,146, with 65,007 individuals classified as seniors (65+ years old). The age dependency ratio is 58.7, meaning that for every 100 working-age individuals, there are approximately 59 dependents (children and seniors combined).
The child dependency ratio is 40.7, indicating a larger proportion of young dependents compared to the old-age dependency ratio of 18, which suggests that Milwaukee has a relatively lower proportion of elderly dependents.
Racial Demographics
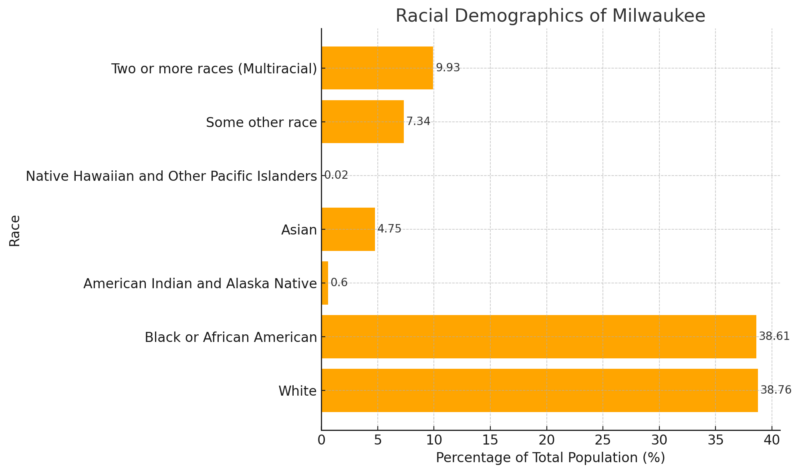
Milwaukee has a diverse racial composition, with White (38.76%) and Black or African American (38.61%) populations making up nearly equal proportions of the city’s residents. The multiracial (9.93%) and “some other race” (7.34%) categories highlight the city’s growing racial diversity according to Neilsberg.
Asian residents (4.75%) and American Indian/Alaska Native (0.60%) populations are smaller but contribute to the city’s cultural diversity. The Native Hawaiian and Pacific Islander population (0.02%) remains the smallest demographic group.
Milwaukee Economic Summary
Category
Value
Average Weekly Wage (Milwaukee Area)
$1,236
Average Weekly Wage (U.S.)
$1,390
Total Nonfarm Employment (Nov 2024)
859.2K
Employment Change (2023-2024)
-4.5K (-0.5%)
Milwaukee Area Unemployment Rate (Nov 2024)
3.4%
U.S. Unemployment Rate (Nov 2024)
3.5%
Employer Costs per Hour (Midwest)
$43.15
Employer Costs per Hour (U.S.)
$44.40
Average Hourly Wage (Milwaukee)
$30.11
Average Hourly Wage (U.S.)
$31.48
Annual Average Spending (Midwest)
$72,575
Annual Average Spending (U.S.)
$77,280
Milwaukee’s average weekly wage ($1,236) is lower than the national average of $1,390, indicating a slight wage gap.
The employment market saw a decline of 4,500 jobs (-0.5%), suggesting potential economic challenges according to BLS.
Milwaukee’s unemployment rate (3.4%) is nearly on par with the national average (3.5%), reflecting a stable job market despite employment fluctuations.
Employer costs per hour worked in the Midwest ($43.15) are slightly below the U.S. average ($44.40), suggesting regional competitiveness in labor costs.
The average hourly wage in Milwaukee ($30.11) is lower than the national average ($31.48), which may impact disposable income and economic mobility.
Annual average spending in the Midwest ($72,575) is lower than the U.S. average ($77,280), reflecting a potentially lower cost of living in Milwaukee compared to national standards.
Income Levels
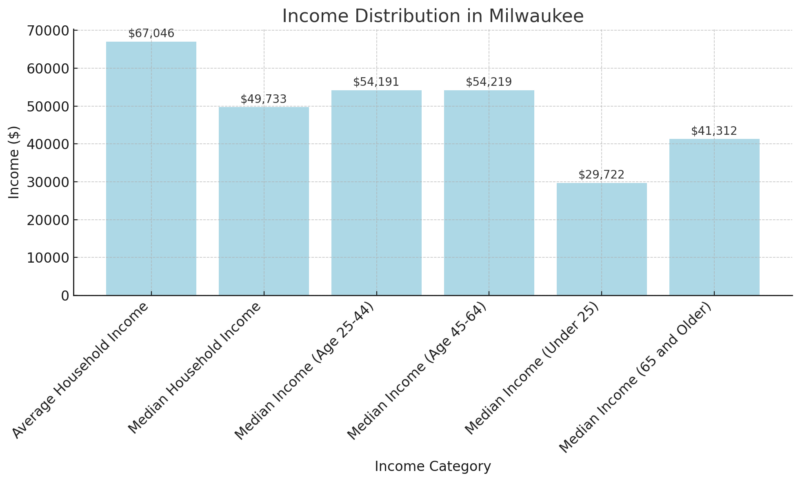
Milwaukee’s average household income stands at $67,046, while the median household income is $49,733 according to Point2Homes. The gap between these figures suggests a notable income disparity, indicating that while some households earn significantly more, a large portion of residents fall below the average income level.
Income distribution varies by age group, with individuals aged 25 to 44 earning a median income of $54,191, which is nearly identical to the $54,219 median income for those aged 45 to 64. However, younger residents under 25 earn considerably less, with a median income of just $29,722, while those 65 and older also earn lower wages, with a median of $41,312.
Both the average and median household incomes have increased over the past year, with a 9.0% rise in average income and a 9.7% rise in median income. While this growth indicates positive wage trends, it does not necessarily mean all residents are experiencing financial improvements.
The number of people living above the poverty level has decreased slightly by 0.3%, which suggests that some households continue to face economic struggles despite overall income growth.
Education Levels
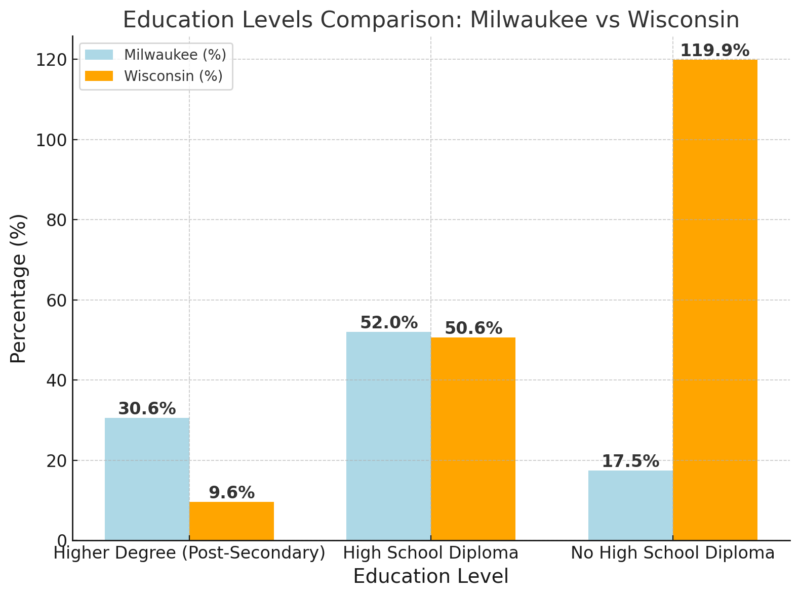
Educational attainment in Milwaukee reflects notable differences compared to the state of Wisconsin. The percentage of residents with a higher degree (30.6%) is 21% lower than the statewide average of 38.7%, indicating that Milwaukee has a smaller proportion of residents who have completed post-secondary education as noted by Statistical Atlas.
This could have implications for the local job market and economic growth, as higher education levels are often associated with higher earning potential.
On the other hand, 52.0% of Milwaukee residents have attained a high school diploma, which is only 1.4% lower than Wisconsin’s overall average of 52.7%. This suggests that while Milwaukee residents generally complete high school at similar rates to the rest of the state, fewer pursue higher education afterward.
A particularly striking statistic is that 17.5% of Milwaukee’s population lacks a high school diploma, which is 102.4% higher than the state average of 8.64%. This significant gap suggests potential barriers to education, such as socioeconomic challenges, limited access to resources, or disparities in the education system.
Housing and Real Estate
Category
Value
Year-over-Year Change
Median Sale Price
$216,000
+23.4%
Median Sale Price per Sq. Ft.
$146
+26.4%
Number of Homes Sold
436
-5.6%
Median Days on Market
49 days
-3 days
Sale-to-List Price Ratio
98.5%
+0.8 pts
Homes Sold Above List Price
32.6%
+2.0 pts
Homes with Price Drops
23.7%
+3.5 pts
Milwaukee Migration (Staying Local)
70%
N/A
Milwaukee Migration (Leaving the City)
30%
N/A
The Milwaukee housing market remains somewhat competitive, with homes receiving an average of three offers and selling in 49 days. Home prices have seen a significant increase of 23.4%, bringing the median sale price to $216,000.
This growth is also reflected in the price per square foot, which has risen by 26.4% year-over-year, suggesting increasing property values across the city.
Despite rising prices, the number of homes sold has declined by 5.6% compared to the previous year, indicating a potential slowdown in transactions. However, homes are selling slightly faster than last year, with the median days on the market dropping from 52 to 49 days according to Redfin.
In terms of competition, the sale-to-list price ratio stands at 98.5%, meaning most homes are selling close to their asking price. Additionally, 32.6% of homes are selling above the list price, which has increased by 2 percentage points from last year, reflecting strong demand.
However, 23.7% of homes have had price drops, an increase of 3.5 percentage points, suggesting that while demand is present, some sellers may be overpricing their homes.
Migration trends show that 70% of Milwaukee homebuyers are choosing to stay within the metropolitan area, while 30% are looking to move elsewhere.
Population Health
Category
Milwaukee
National Average
Peer Group
State
Overall Population Health Score
59
N/A
N/A
N/A
Population Without Health Insurance
8.2%
11.5%
8.9%
6.5%
Smoking Rate
17.1%
19.0%
15.6%
15.0%
Life Expectancy
75.1 years
75.8 years
78.1 years
78.2 years
Milwaukee’s overall population health score of 59 suggests moderate healthcare conditions, slightly below optimal levels. The uninsured population (8.2%) is significantly lower than the national average (11.5%), which indicates good access to insurance coverage but still lags behind the state average of 6.5% according to US News.
The smoking rate (17.1%) is better than the national average but remains above the state level, highlighting a need for more smoking cessation programs.
Life expectancy (75.1 years) is slightly below the national average of 75.8 years and significantly lower than the state and peer group averages, suggesting that long-term health challenges persist in the city.
Access to Care
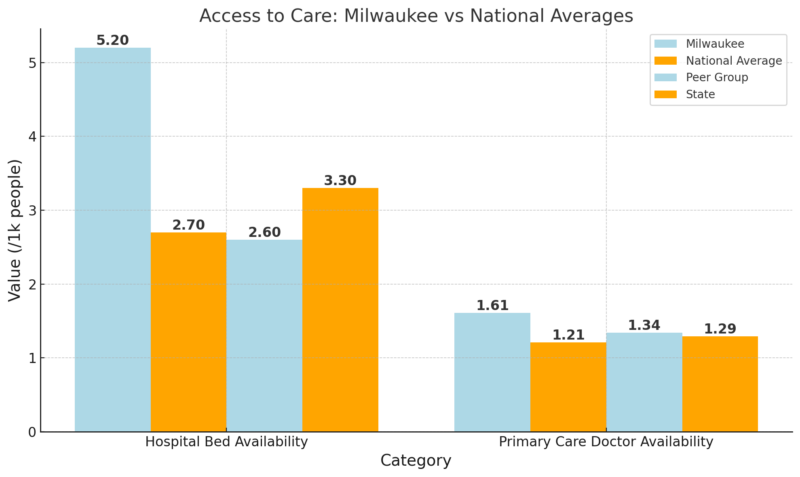
Milwaukee offers above-average access to hospital beds (5.2 per 1,000 people) compared to both the national (2.7) and state (3.3) averages, which suggests better emergency and inpatient care.
However, primary care doctor availability (1.61 per 1,000 people) is only slightly above the national and state averages, meaning that access to routine medical care may still be limited in certain areas, possibly contributing to lower preventive healthcare utilization.
Health Behaviors
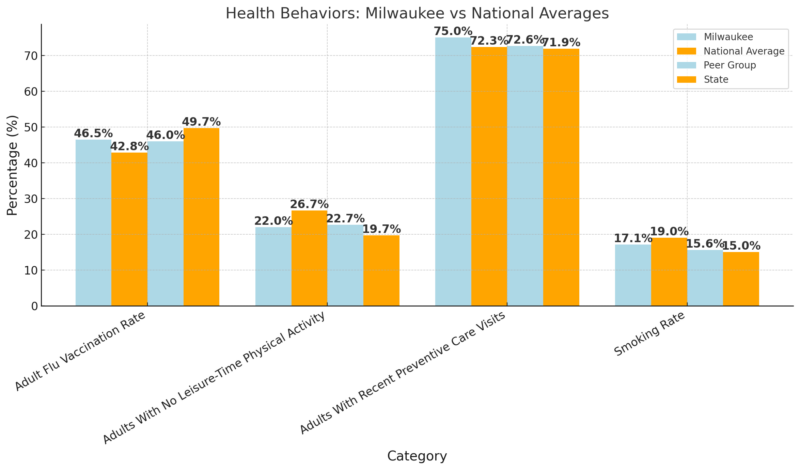
Milwaukee’s flu vaccination rate (46.5%) is higher than the national average (42.8%), indicating strong participation in preventive health measures.
The percentage of adults with no leisure-time physical activity (22%) is lower than the national average (26.7%), meaning that Milwaukee residents engage in physical activities at a better rate than the national norm but still fall behind the state average (19.7%).
Preventive care visits (75.0%) are also higher than the national average, showcasing better engagement in healthcare services. However, smoking remains an issue, with a rate of 17.1%, which, while below the national level, is still higher than state and peer group averages.
Methodology
We compiled this report using trusted sources, including World Population Review, Macrotrends, BLS, Redfin, and Neilsberg. Census data and economic reports were analyzed to ensure accurate population, wage, and employment trends.
Housing market insights were drawn from MLS records and Redfin calculations. Education and demographic statistics were gathered from ACS 5-Year Estimates and state-level reports. Comparative analysis with Wisconsin and national data provided context for Milwaukee’s trends.
The report was structured to highlight key findings with clear tables, ensuring readability and data transparency.
References
- World Population Review – Milwaukee, Wisconsin Population 2025
- Macrotrends – Milwaukee Metro Area Population
- Neilsberg – Milwaukee, WI Population by Age
- Neilsberg – Milwaukee, WI Population by Race
- Bureau of Labor Statistics (BLS) – Milwaukee Economic Summary
- Redfin – Milwaukee Housing Market
- Point2Homes – Milwaukee, WI Demographics
- Statistical Atlas – Milwaukee, WI Educational Attainment