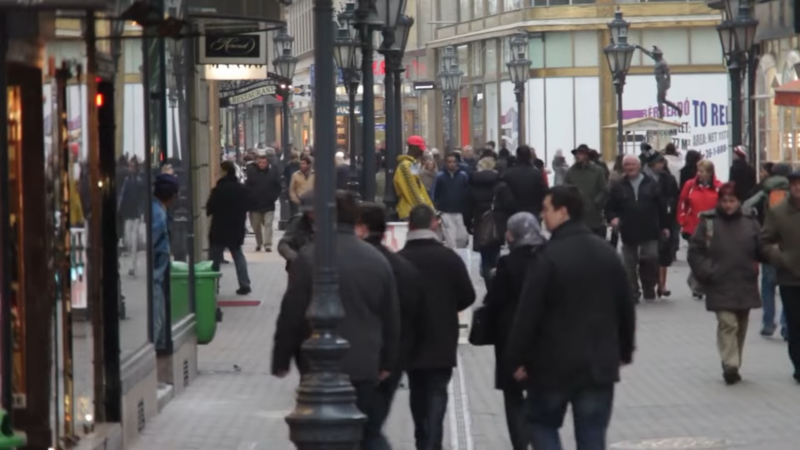
The population boom has led to a more youthful demographic within the city.
Inflows of young families and professionals have lowered the median age in the Dallas-Fort Worth area to 35.1 years, compared to the national metro average of 38.5 years.
This younger population is infusing the city with vitality and driving demand for modern amenities and entertainment options.
Dallas, spanning multiple counties in Texas (including Dallas, Collin, Denton, Ellis, Kaufman, Rockwall, and Tarrant), has a current population of 1,302,753 as of 2025 according to World Population Review.
Serving as the county seat of Dallas County, the city is experiencing a slight population decline, decreasing at an annual rate of -0.01%.
Since the 2020 census, which recorded 1,303,212 residents, the population has fallen by -0.04%.
Between 2021 and 2022, the Dallas-Fort Worth region added 170,396 new residents according to axios.com, making it the fastest-growing metropolitan area in the United States.
This influx has significantly impacted the city’s infrastructure, economy, and societal landscape.
Key Takeaways
Demographic Shifts and Trends
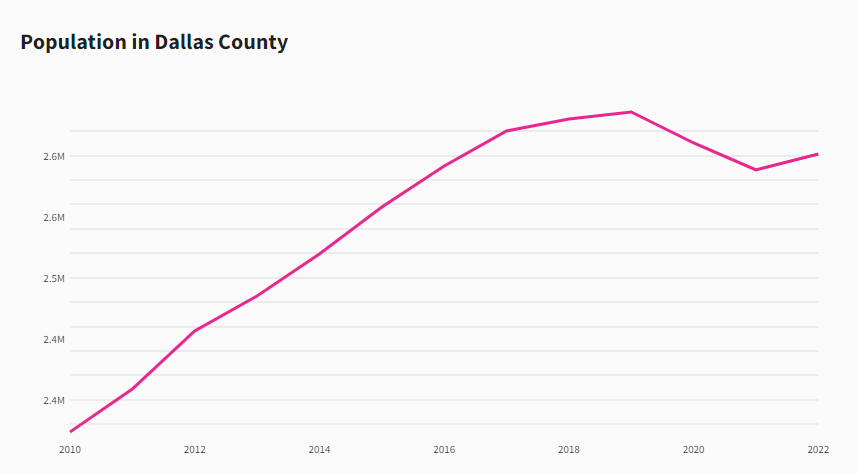
The Dallas metropolitan area is one of the fastest-growing regions in the United States. Over the past decade, the region added more than 1.2 million residents, boosting its population by 20% since 2010.
This significant surge positions Dallas as a key urban center that continues to attract new residents. Notably, between 2010 and 2022, Dallas County grew by an average of 0.8% per year, with some years seeing increments as high as 2% according to USAFACTS.
Age Distribution
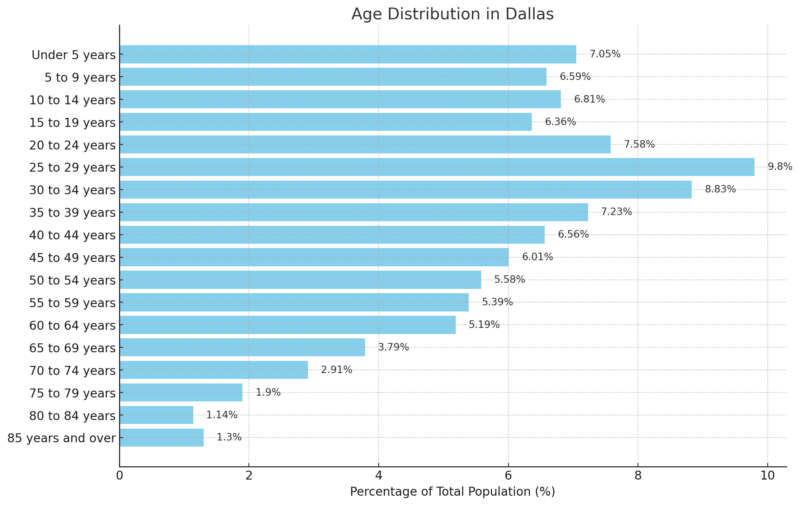
- Young Adult Population (25–34 years): The age groups 25–29 and 30–34 years represent a significant portion of the population (9.8% and 8.83%, respectively). This highlights a youthful, potentially mobile workforce, which could be attracted by DFW’s employment growth and relatively high demand for apartments.
- Aging Population (65+ years): Age groups 65 and over comprise 10% of the population, indicating a growing demographic that may drive demand for senior housing and healthcare services.
- School-Aged Population: Age groups under 19 make up about 26.81% of the total, suggesting ongoing demand for educational infrastructure and family housing options in DFW.
Migration Patterns and Diversity Increase
Migratory trends have also played a crucial role in Dallas’s demographic evolution.
Data reveals that the area has seen a shift in racial and ethnic composition, with Hispanics now outnumbering whites in Dallas reflecting on a Dallas News article.
This increase in diversity brings various cultural influences and enriches the community.
Additionally, Texas’s status as a state with double-digit population growth from 2010 to 2020 emphasizes the attractiveness of the Dallas region to different ethnic groups and communities as per gov officials.
Dallas Immigration and Diversity Statistics (2025)
Statistic
Value
Estimated Population
1,317,210
Annual Growth Rate
0.68%
Population Density
3,877.20 per sq. mile
Foreign-Born Population
Over 25%
Non-Hispanic Whites
Less than 33%
Main Immigrant Origins
Latin America, Asia, Africa
With more than a quarter of residents being foreign-born, Dallas is a major hub for immigration. This diverse composition promotes cultural variety and contributes to the workforce, particularly in industries benefiting from bilingual skills.
Non-Hispanic whites constitute less than a third of the population, indicating a significant ethnic diversity that may enhance the city’s cultural landscape and economic engagement through varied businesses and services.
Demographics by Race/Ethnicity in Dallas
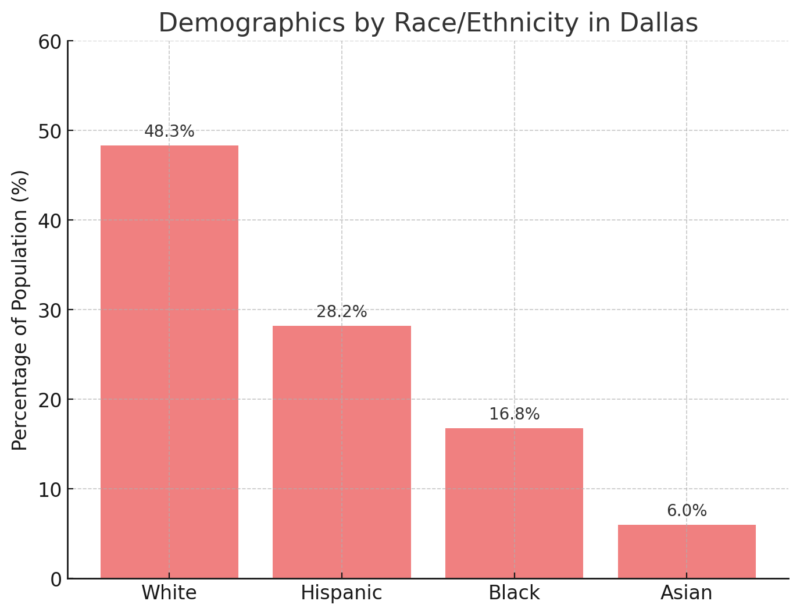
Historical shifts, such as immigration and suburban race group formations, have diversified the Dallas area, notably increasing the Hispanic and Black populations. The presence of Asian communities further diversifies the metroplex, especially in suburbs like Arlington and Irving according to Attlaw.
This diversity necessitates multilingual services, cultural organizations, and culturally adaptive education systems, and provides Dallas with a unique blend of cultural assets that benefit community integration and tourism.
Languages Spoken in Dallas
Language Groups
Examples
Austronesian Languages
Samoan, Native Hawaiian
Afro-Asiatic Languages
Somali, Amharic
Western African Languages
Yoruba, Igbo
Central/Eastern/Southern African Languages
Swahili
Slavic Languages
Russian, Ukrainian
With a broad range of languages spoken, from Western African to Austronesian and Slavic languages, Dallas reflects a highly international community. This linguistic variety supports cultural businesses, multilingual educational needs, and diverse social networks, particularly in areas with high immigrant populations.
Linguistic services are crucial in government, healthcare, and education to accommodate non-English speakers, promoting inclusive communication and community cohesion.
Immigration Statistics by Origin
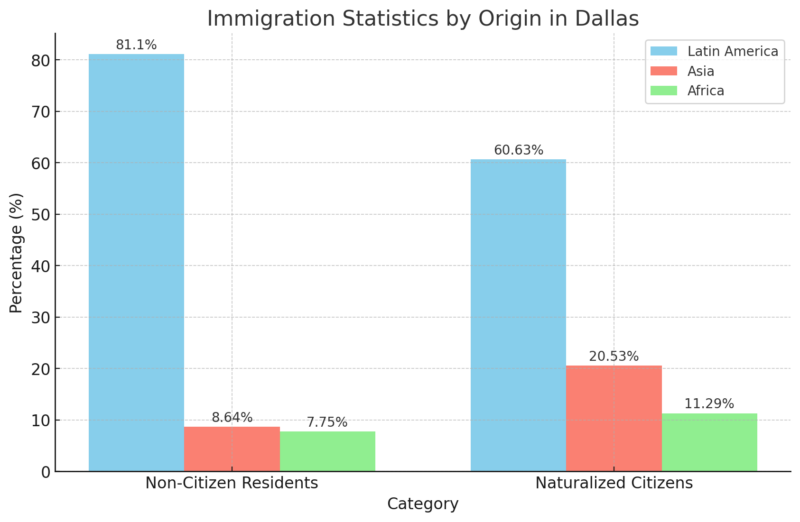
A significant percentage of both non-citizen and naturalized populations originate from Latin America, shaping the cultural influence in neighborhoods and business sectors.
A notable portion of naturalized citizens come from Asian and African countries, which is indicative of recent immigration trends and the growth of these communities in Dallas.
Infrastructure and Urban Living
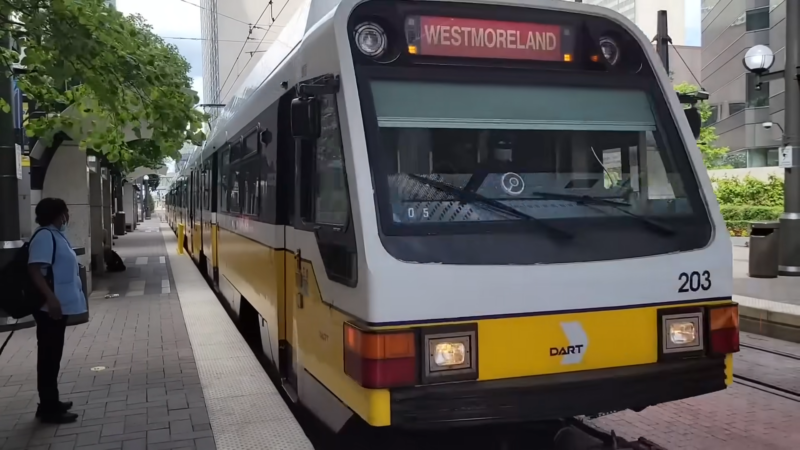
The influx of residents has led to a surge in housing demand. New residential areas, particularly in Collin County, are booming, with developers focusing on modern, mixed-use communities.
Housing prices have increased, making affordability a critical issue. Developers are now incorporating more multi-family units to cater to diverse economic backgrounds. Affordable housing initiatives are also gaining momentum to tackle the disparity in living standards.
Public Transportation and Accessibility
Public transportation in Dallas is undergoing significant improvements to accommodate the growing population.
The expansion of DART (Dallas Area Rapid Transit) is a top priority, aiming to connect more neighborhoods efficiently.
New light rail lines and bus routes are being introduced, improving accessibility. Enhanced public transportation infrastructure reduces traffic congestion and promotes a more environmentally friendly urban environment.
Economic Implications

Dallas’ expanding population is driving robust employment growth across various sectors. New job opportunities are particularly notable in technology, healthcare, and finance.
This diverse job market helps maintain relatively low unemployment rates. In August, the economy expanded, with employment growth continuing at a brisk pace and unemployment remaining low.
Employment Data for Dallas-Fort Worth Area (Aug 2023 – Aug 2024)
Industry
Employment (Thousands) Aug 2024
Change from Aug 2023 (Thousands)
Percent Change (%)
Total Nonfarm
4,296.2
58.7
1.4
Mining, Logging, and Construction
259.2
10.1
4.1
Manufacturing
317.7
8.8
2.8
Trade, Transportation, and Utilities
904.5
9.0
1.0
Information
91.8
0.0
0.0
Financial Activities
379.7
10.7
2.9
Professional and Business Services
774.2
-10.3
-1.3
Education and Health Services
519.4
14.6
2.9
Leisure and Hospitality
436.3
5.2
1.2
Other Services
143.9
5.7
4.1
Government
469.5
4.9
1.1
Overall employment in the Dallas-Fort Worth area increased by 1.4%, with growth in sectors such as education and health services (2.9%) and financial activities (2.9%). These sectors may attract job seekers, supporting population growth. However, declines in professional and business services (-1.3%) could lead to some out-migration according to BLS.
Unemployment Rates Data (Aug 2023 vs. Aug 2024)
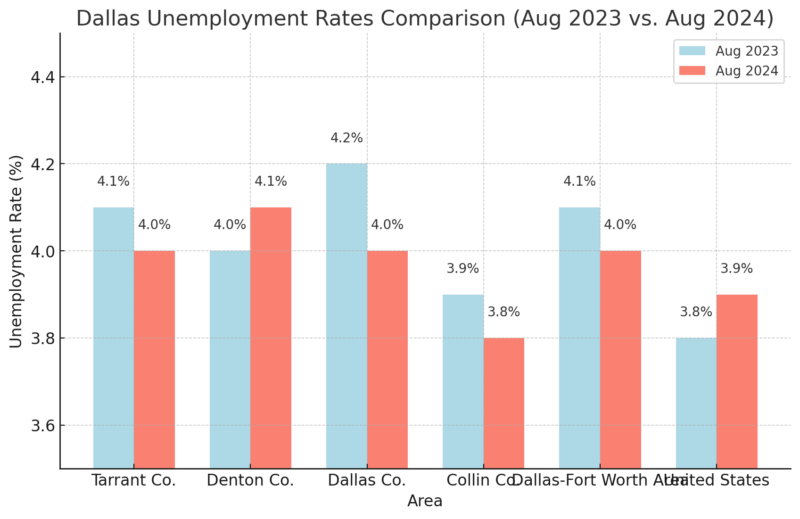
Unemployment rates showed a slight decrease or remained stable across counties, with Dallas County’s rate dropping from 4.2% to 4.0%. Lower unemployment typically indicates economic stability, making the area more attractive to residents, thus positively impacting population retention and attraction.
Average Hourly Wages for Selected Occupations
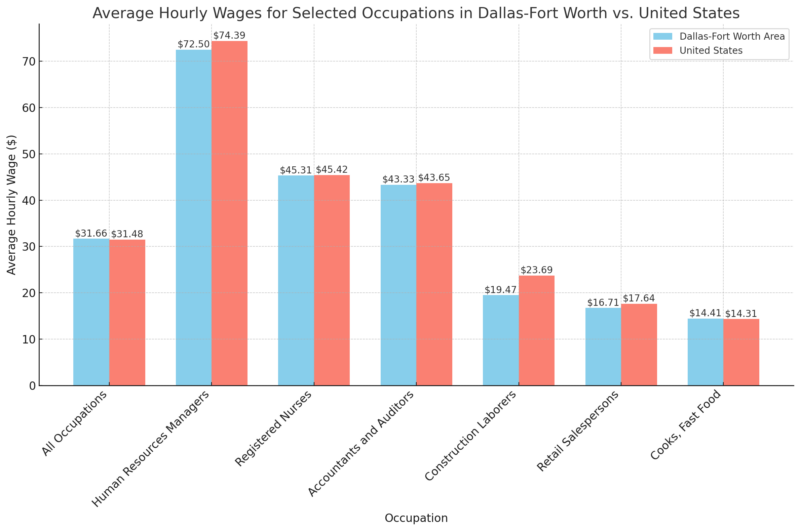
Dallas-Fort Worth wages are competitive with national averages, especially for high-skill roles. The slightly lower average wage for labor-intensive roles (like construction laborers) may influence those who weigh salary alongside cost of living, though stable wages generally support population maintenance.
Compensation and Benefits Data for Private Industry (June 2024)
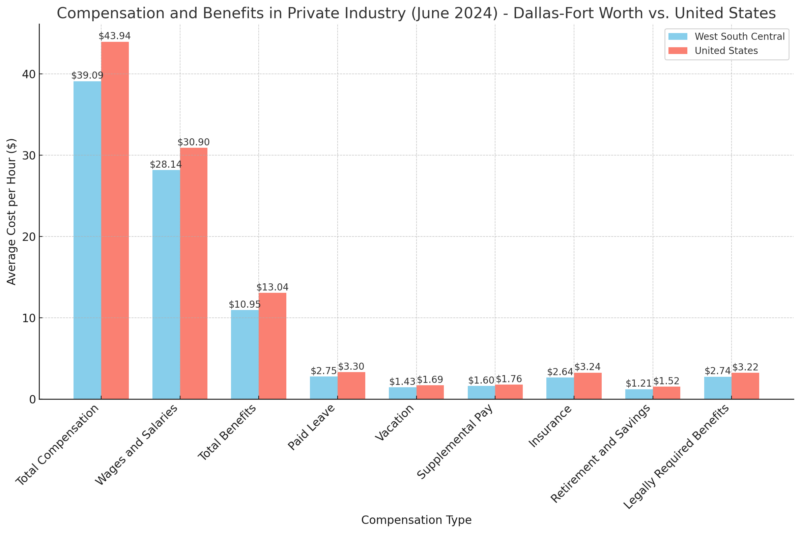
Total compensation in the Dallas-Fort Worth area is somewhat lower than the national average, with reduced benefits costs, like paid leave and insurance. This lower compensation might deter some potential residents but offers employers a cost advantage, supporting job creation in the area.
Impact on Local Businesses and Services
An increasing population translates into greater demand for local businesses and services. Retailers, restaurants, healthcare providers, and educational institutions are scaling up to meet the needs of the growing community. Infrastructure projects, including transportation and utilities, are essential to support this expansion.
The notable rise in economic activities stimulates small business growth and invites larger corporations to establish a footprint in Dallas. As the consumer base expands, so does the variety and quality of services available to residents, contributing to a dynamic urban experience.
Real Estate Dynamics
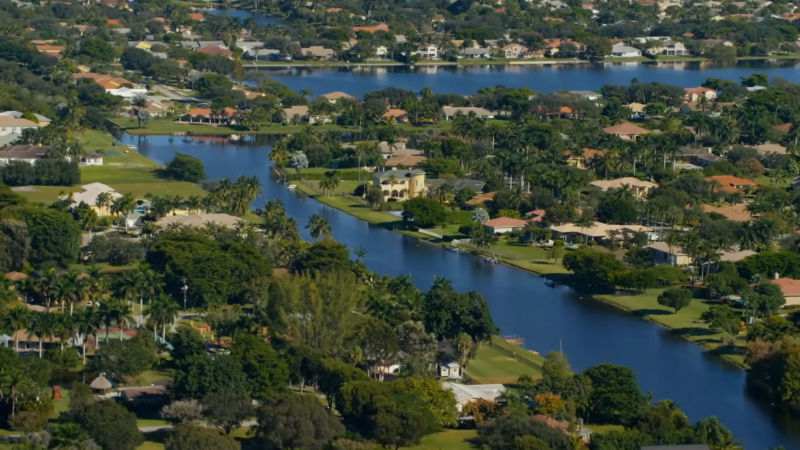
The housing market in Dallas is experiencing significant transformations due to the population boom. There is a marked increase in both single-family and apartment demand. For example, in October, the median sales price reached an all-time high of $396,300.
This demand surge pressures housing availability, leading to construction booms in residential areas. However, stricter credit conditions and higher financing costs are challenging multifamily permits. These dynamics influence housing affordability and the landscape of urban development in Dallas.
Housing Permit Issuance in DFW (August 2024)
Type of Housing
Permit Issuance Change (%)
Year-to-Date Change (%)
Single-Family
5.5
-19.8
Multifamily
-26.4
Elevated historically
- Single-Family Construction: The 5.5% monthly increase indicates rising demand, but the year-to-date drop of nearly 20% suggests that supply is lagging. Reduced availability of single-family homes might push more residents toward renting according to FED Dallas.
- Multifamily Permit Decline: A significant reduction in multifamily permits (26.4%) may strain the rental market in the future. While DFW remains one of the busiest U.S. metros for apartment construction, limited new permits could eventually impact housing availability, affecting population growth among younger or lower-income residents reliant on rental housing.
Apartment Market Trends in DFW (Summer 2024)
Metric
Value
Net Absorption (June-August)
4,600 units
Effective Monthly Rent
$1,518 per unit
Occupancy Rate
91.1%
- Steady Demand: Strong net absorption (4,600 units over three months) suggests sustained demand, supporting population growth among renters.
- Occupancy and Rent Stability: Occupancy at 91.1% and stable rents indicate a healthy rental market, but high completion rates for new apartments could cap rent growth. This may make renting more accessible for new residents, aiding population growth among those seeking affordable housing options.
Housing Affordability (Second Quarter 2024)
Area
Median-Income Affordability (%)
Dallas
28.1
Fort Worth
34.8
United States
40.5
DFW Median Home Price (Aug 2024)
$396,300
- Decreasing Affordability: With only 28.1% of homes affordable for median-income households in Dallas, housing accessibility is limited, which could deter population growth among middle-income families and new buyers.
- Higher Cost: The median home price of $396,300, while stable year-over-year, remains high relative to incomes, potentially encouraging more people to rent rather than buy.
Governmental and Policy Responses
Dallas has revised its zoning regulations to address the rapid growth.
The ForwardDallas plan seeks public input to help shape these regulations. It involves community workshops to gather feedback.
Key elements include:
- Mixed-use developments: Encouraging residential and commercial integration.
- Affordable housing: Allocating zones for lower-income residents.
- Environmental considerations: Incorporating green spaces and sustainable practices.
These measures aim to balance density with quality of life.
Investments in Public Infrastructure
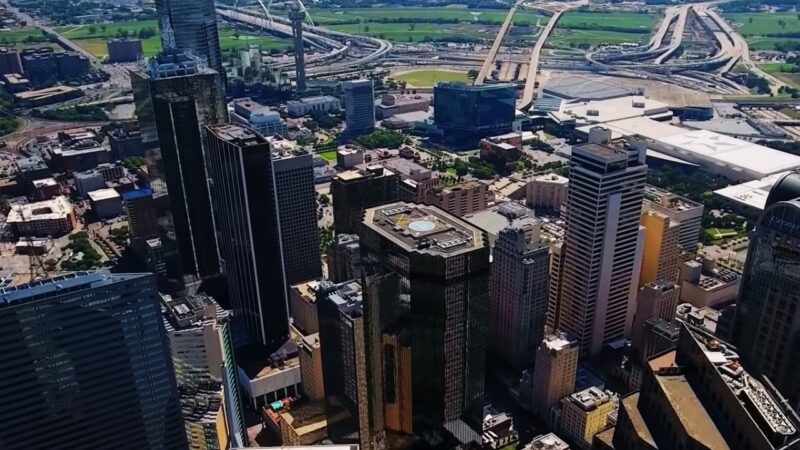
To support its growing population, Dallas is investing in public infrastructure. This includes upgrading transportation systems, enhancing water management, and expanding public amenities.
Key projects involve:
- Public transit: Expanding rail and bus networks to reduce traffic congestion.
- Utilities: Improving water and sewage systems to handle increased demand.
- Community facilities: Building schools, parks, and healthcare centers.
These initiatives are designed to improve overall accessibility and quality of life for Dallas residents.
Future Outlook
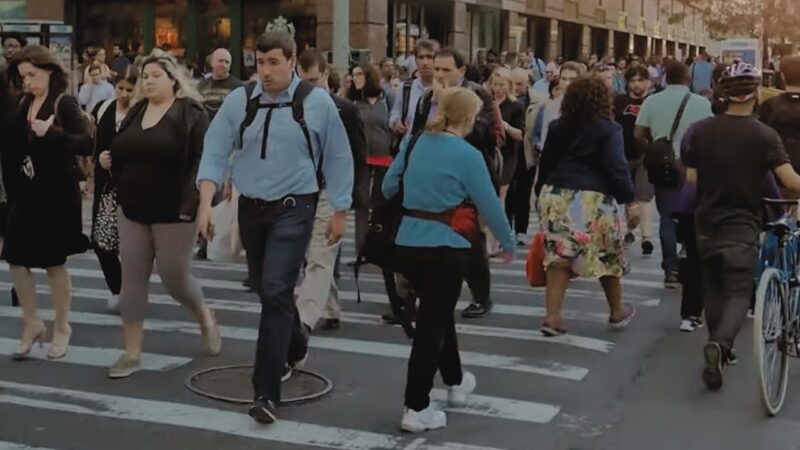
Dallas-Fort Worth’s population is forecast to reach approximately 8.5 million by 2028, indicating a substantial increase from the current 7.8 million. This growth necessitates extensive urban planning initiatives.
Similarly, Detroit’s population growth in 2023 has garnered significant attention, highlighting the broader trend of urban expansion in major U.S. cities.
To handle this surge, Dallas may explore various innovative solutions. One approach is to enhance public transportation, reducing traffic congestion and lowering carbon emissions. The development of green spaces and parks can improve urban living conditions, promoting a healthier environment.
The use of smart city technologies can streamline city services and improve efficiency. For example, integrating IoT (Internet of Things) can aid in real-time traffic management and better resource allocation.
Investment in affordable housing projects is also crucial to ensure that the growing population has access to necessary resources without exacerbating housing shortages.
Methodology
The article was crafted by first analyzing available data and reports from reputable sources on Dallas-Fort Worth’s population growth, demographics, and economic trends.
We organized key information into concise tables for clarity, drawing from resources like the U.S. Census Bureau, local news outlets, and government data.
The data was then used to explore how population trends, housing, and employment affect the city’s development.
We incorporated expert insights on migration patterns, housing affordability, and employment to offer a comprehensive overview.
Lastly, policy responses and future outlooks were evaluated to address the city’s urban planning needs.
References
-
- World Population Review – Dallas Population 2024
- Axios.com – How Dallas-Fort Worth became America’s boomtown
- Usafacts.org – How has the population changed in Dallas County?
- Dallasnews.com – Booming Texas population growth, demographic changes set stage for redistricting battle
- Attlaw.com – Dallas Immigration Statistics in 2024
- Localprofile.com – 5 Reasons Why Dallas Residents Are Moving To Collin County
- Railjournal.com – Dart light rail expansion continues
- Dallasfed.org – At the heart of Texas: Cities’ industry clusters drive growth, Dallas-Fort Worth Economic Indicators
- Hoodline.com – Dallas Invites Residents to Shape the City’s Future Growth Through ForwardDallas Workshops
- Dallas.culturemap.com – Dallas-Fort Worth population headed toward jaw-dropping milestone by 2028
- BLS – Dallas-Fort Worth Area Economic Summary
Related Posts:
- Washington State Population Boom in 2025 - Key Stats…
- Wyoming Population and How Is It Changing in 2025
- Puerto Rico Population in 2025 - Is It Changing?
- Medical Billing Is Changing Fast — What You’ll Be…
- How AI Is Changing College Majors In 2026 - Computer…
- Weight Loss Without Injections? Wegovy’s New Pill Is…


