Situated in the northwestern region of the United States, Idaho is one of the larger states in terms of land area, ranking 14th in size among U.S. states.
Its population growth over the years has been notable.
According to the 2010 Census, Idaho had a population of 1,567,582, reflecting a significant increase of over 20% compared to the figures recorded in 2000.
By 2011, updated estimates suggested that the population had risen to 1,584,985, positioning Idaho as the 39th most populous state in the country.
Further estimates from 2015 placed the population at 1,654,930.
In comparison to its neighbors, Idaho’s population is smaller than that of Washington and Oregon, both of which are more densely populated and urbanized.
However, Idaho’s population surpasses that of neighboring Montana and Wyoming, making it a dynamic region that balances expansive rural landscapes with steady population growth.
As of 2025, Idaho’s population is estimated to be approximately 1,990,460 according to World Population Review.
But in last couple of days Idaho’s population has reached approximately 2,001,619 people according to some estimates making it a little bigger part of the great U.S.
Key Takeaways
Population by Age
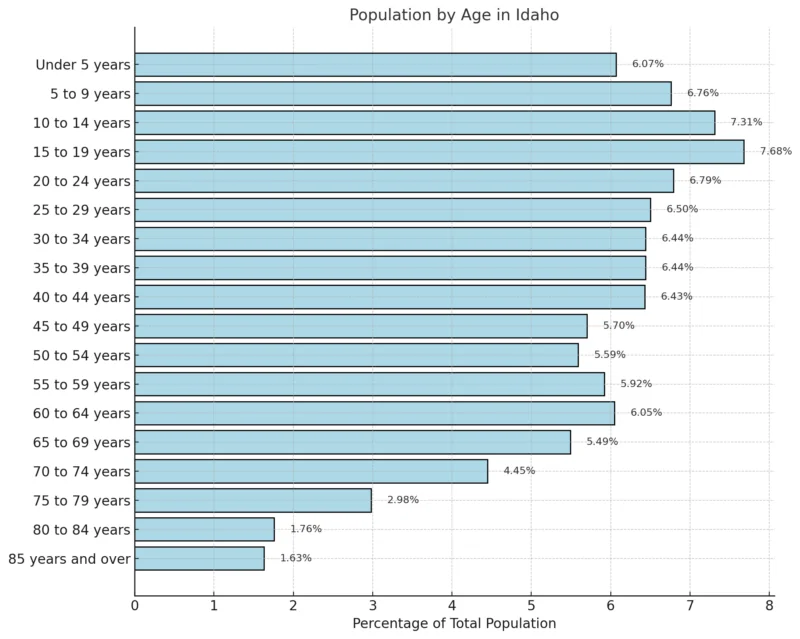
According to the 2018-2022 ACS 5-Year Estimates, the median age in Idaho is 36.9 years. The population distribution by age groups is as follows: 20.14% are under 15 years old, 20.97% are between 15 and 29 years, 42.57% fall within the 30 to 64 age range, 14.68% are aged 65 to 84, and 1
Idaho Population by Age Cohort
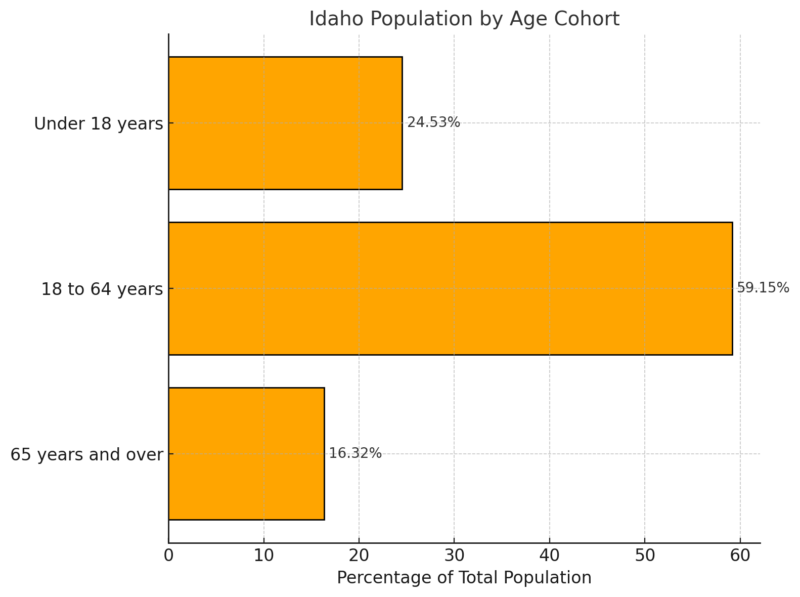
Breaking the population into broad cohorts reveals that nearly 60% of Idaho’s residents fall within the working-age group (18-64 years), demonstrating a strong labor force.
Meanwhile, 24.53% of the population under 18 indicates a high youth dependency ratio, which may demand greater investment in education and related services.
Seniors, comprising 16.32%, reflect a consistent national trend toward an aging population, posing potential challenges for healthcare and social support systems.
Population Pyramid Dependency Ratios
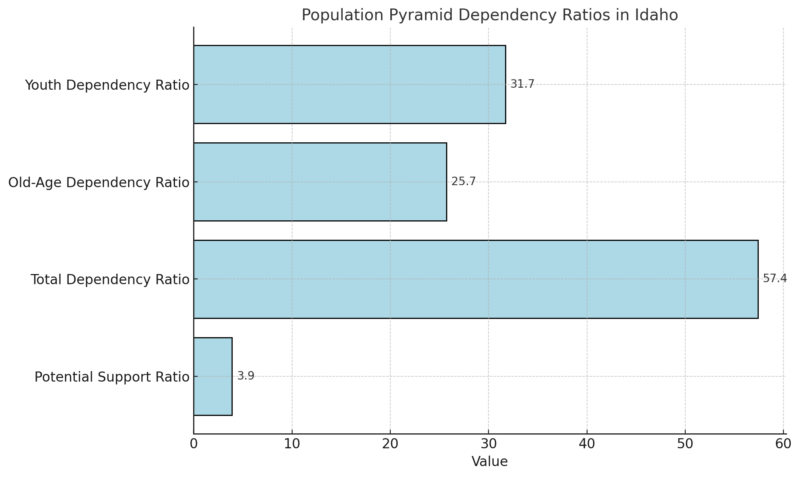
The youth dependency ratio of 31.7 indicates a significant number of dependents under 15 years for every 100 working-age individuals, signaling a demand for resources in education and childcare.
The old-age dependency ratio of 25.7 suggests that for every 100 working-age individuals, 25.7 are seniors.
The total dependency ratio of 57.4 reflects an overall moderate level of dependency on the working population, while a potential support ratio of 3.9 underscores the pressure on the labor force to sustain the aging segment of the population.
Racial Composition
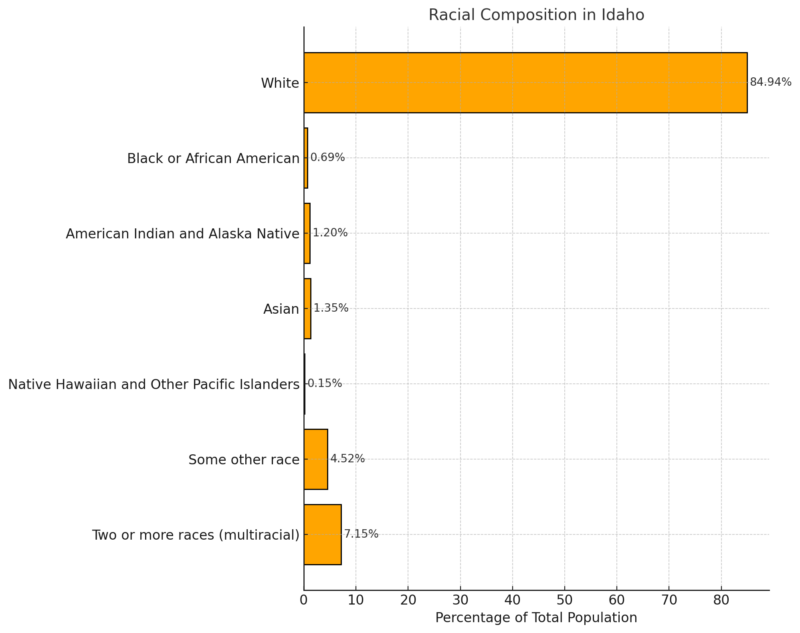
The racial composition of Idaho’s population reveals a predominantly White demographic, making up 84.94% of the total according to Neilsberg.
This significant majority reflects the state’s historical and cultural development. The multiracial population, at 7.15%, is the second-largest group, indicating increasing diversity.
Minority racial groups such as Asian (1.35%), American Indian and Alaska Native (1.20%), and Black or African American (0.69%) constitute smaller yet important parts of the population, highlighting Idaho’s growing multicultural identity.
Additionally, 4.52% identify as “Some other race”, which underscores diversity that may include emerging or less traditionally categorized racial identities.
Employment and Unemployment
Data Series
May 2024
June 2024
July 2024
Aug 2024
Sept 2024
Oct 2024 (p)
Civilian Labor Force
975.7
977.9
981.9
985.7
989.7
993.4
Employment
943.1
944.8
947.8
950.8
953.9
957.0
Unemployment
32.6
33.2
34.1
34.9
35.8
36.5
Unemployment Rate (%)
3.3%
3.4%
3.5%
3.5%
3.6%
3.7%
Idaho’s labor force data from May to October 2024 shows a steady increase across all metrics. The civilian labor force expanded from 975.7K in May to 993.4K in October, indicating growing participation in the workforce. Employment numbers followed a similar upward trend, rising from 943.1K to 957.0K, reflecting a healthy job market according to BLS.
Idaho’s October unemployment rate increases to 3.7%https://t.co/oLpa9lFid9 pic.twitter.com/Qm3fiEh8Lh
— Idaho Dept. of Labor (@IdahoLabor) November 15, 2024
Unemployment also rose slightly, from 32.6K to 36.5K, with the unemployment rate ticking up from 3.3% to 3.7%. While the unemployment rate remains relatively low, the increase suggests a slight lag in job creation compared to labor force growth.
Housing Market Trends
Metric
Value
Year-Over-Year Growth
Median Sale Price
$492,200
+1.6%
Number of Homes Sold
2,584
+27.5%
Median Days on Market
52 days
+8 days
Redfin notes that Idaho’s housing market in October 2024 reflects a slight increase in home prices, with a median sale price of $492,200, up 1.6% year-over-year.
The number of homes sold saw a significant jump of 27.5%, suggesting robust buyer activity.
View this post on Instagram
However, the median days on the market increased by 8 days, indicating that while homes are selling, they are taking slightly longer to close.
This mix of increased sales volume and price growth signals a resilient market with steady demand.
Top 10 Idaho Metros with Fastest-Growing Sales Prices
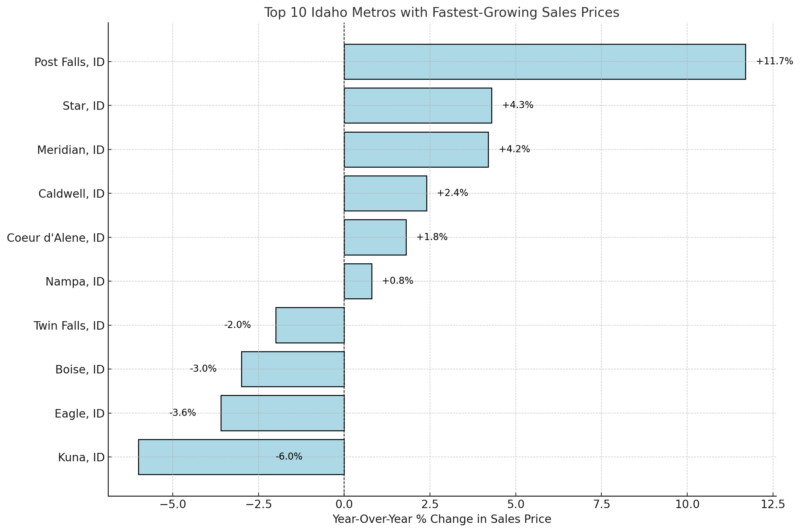
Sales prices are increasing in smaller cities like Post Falls (+11.7%) and Star (+4.3%), while larger markets like Boise (-3.0%) and Eagle (-3.6%) have experienced declines.
This suggests shifting demand toward less expensive or suburban areas, potentially driven by affordability concerns or changing buyer preferences.
Housing Supply (October 2024)
Metric
Value
Year-Over-Year Growth
Number of Homes for Sale
10,076
+2.9%
Number of Newly Listed Homes
2,354
+2.6%
Months of Supply
3 months
-1 month
The housing supply in Idaho has modestly increased, with a 2.9% year-over-year rise in homes for sale and a 2.6% increase in newly listed properties.
However, the months of supply decreased by one month, indicating strong buyer demand relative to inventory.
This tightening supply could put upward pressure on prices if the trend continues.
Idaho Housing Demand
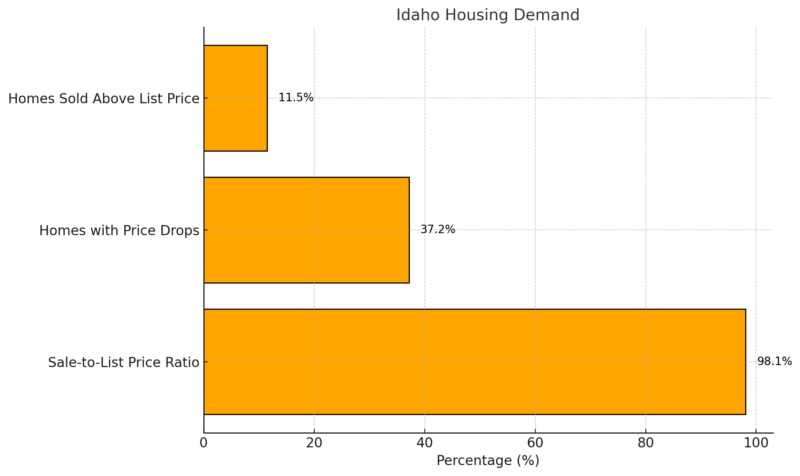
The demand in Idaho’s housing market remains competitive, with 11.5% of homes selling above the list price—a slight increase from last year.
However, 37.2% of homes experienced price drops, reflecting sellers adjusting expectations in some segments.
The sale-to-list price ratio at 98.1% indicates that homes are generally selling near their asking price, showing sustained buyer interest.
Population By Counties 2025
County
Population
% of Total Population
Growth %
Ada County
530,342
6.43%
19.48%
Canyon County
264,456
13.49%
18.03%
Kootenai County
186,730
8.07%
16.31%
Bonneville County
133,189
6.78%
11.25%
Twin Falls County
96,491
6.77%
10.02%
Bannock County
91,175
4.47%
9.50%
Madison County
54,136
2.28%
11.85%
Bonner County
53,687
13.26%
8.12%
Bingham County
50,817
5.66%
7.50%
Nez Perce County
43,065
2.18%
5.25%
Latah County
41,678
5.15%
6.45%
Jefferson County
35,060
12.81%
12.27%
Elmore County
30,057
4.84%
6.78%
Payette County
27,629
7.97%
7.90%
Cassia County
25,748
3.99%
6.92%
Jerome County
25,714
5.95%
6.60%
Blaine County
25,181
3.42%
5.80%
Minidoka County
22,752
5.00%
7.10%
Gem County
21,688
12.54%
9.20%
Idaho County
18,143
9.33%
7.05%
Gooding County
16,243
3.80%
5.35%
Franklin County
15,818
10.75%
9.15%
Fremont County
14,375
7.12%
6.45%
Shoshone County
14,117
6.96%
5.80%
Boundary County
13,842
14.03%
8.15%
Valley County
12,838
8.41%
12.80%
Owyhee County
12,799
6.69%
6.75%
Teton County
12,579
7.19%
14.67%
Washington County
11,703
10.84%
7.45%
Benewah County
10,447
9.10%
5.95%
Clearwater County
9,393
7.35%
5.80%
Boise County
8,674
13.18%
6.95%
Lemhi County
8,598
7.99%
6.70%
Power County
8,370
6.23%
5.95%
Caribou County
7,238
3.21%
6.30%
Bear Lake County
6,802
6.83%
5.85%
Lincoln County
5,515
7.42%
5.60%
Oneida County
5,166
13.14%
6.75%
Adams County
5,015
13.26%
7.27%
Custer County
4,528
6.02%
5.25%
Lewis County
3,753
6.41%
5.10%
Butte County
2,818
9.06%
-10.43%
Camas County
1,295
19.46%
3.50%
Clark County
792
0.00%
-13.06%
Ada County leads with 530,342 residents, representing 6.43% of the total population, followed by Canyon and Kootenai counties according to WPR.
Clark County has the smallest population (792), with significant population decline (-13.06%).
Ada County (19.48%), Canyon County (18.03%), and Teton County (14.67%) experienced the most rapid growth.
Counties like Clark and Butte are experiencing notable population declines, highlighting economic or infrastructure challenges.
Counties host annual celebrations highlighting local history and traditional crafts, ensuring these aspects continue to enrich the state’s identity amidst change.
Income Levels
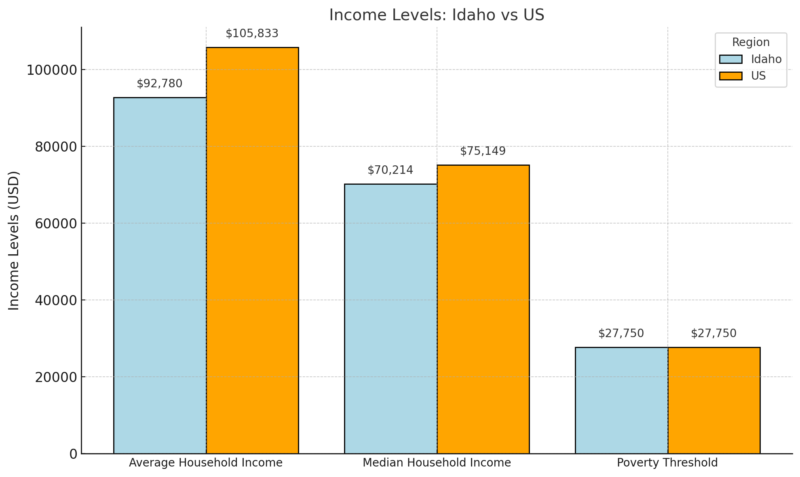
Idaho’s average household income is $92,780, which is 12% lower than the national average, reflecting its more rural and cost-effective economy.
The median household income of $70,214 is closer to the national median but still 7% lower according to Income By Zip Code.
This gap indicates that Idaho households tend to earn less overall than the average U.S. household, although the state’s cost of living is also typically lower.
Richest Zip Codes in Idaho (2025)
Rank
Zip Code
Population
Mean Income
Median Income
1
83616
33,860
$161,100
$114,021
2
83353
1,373
$160,400
$66,818
3
83712
9,217
$153,085
$100,625
4
83716
21,092
$141,873
$121,626
5
83702
23,113
$136,312
$77,115
The richest zip code in Idaho, 83616, boasts a mean income of $161,100, significantly surpassing the state and national averages.
Median incomes, such as $114,021 in this zip code, reflect the area’s affluence.
Other high-income areas, such as 83712 and 83716, are similarly prosperous, highlighting regional concentrations of wealth in the state.
Salary Data (2025)
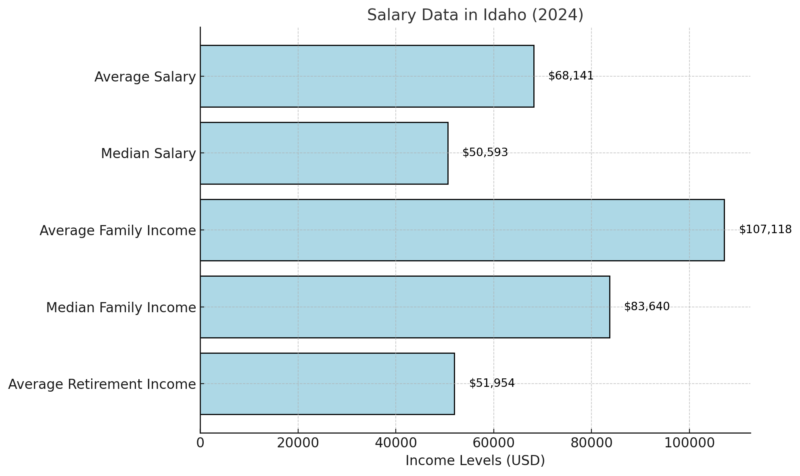
The average salary for full-time workers in Idaho is $68,141, reflecting earnings from various sectors, including agriculture, manufacturing, and technology.
The median salary of $50,593 is more representative of what most individuals earn.
Family incomes tend to be higher due to combined earnings, with an average family income of $107,118.
Retirement incomes, at $51,954 on average, reflect a mix of savings and Social Security benefits, demonstrating modest post-work income levels.
Income Levels or Distribution
Income Range
Households
% of Total Households
Less than $10,000
24,860
4%
$10,000 to $14,999
22,606
3%
$15,000 to $19,999
22,733
3%
$20,000 to $24,999
26,200
4%
$25,000 to $29,999
25,776
4%
$30,000 to $34,999
27,370
4%
$35,000 to $39,999
26,194
4%
$40,000 to $44,999
26,552
4%
$45,000 to $49,999
28,215
4%
$50,000 to $59,999
55,645
8%
$60,000 to $74,999
73,753
11%
$75,000 to $99,999
100,706
15%
$100,000 to $124,999
68,799
10%
$125,000 to $149,999
48,926
7%
$150,000 to $199,999
48,016
7%
$200,000 or more
48,972
7%
The largest share of Idaho households (15%) earns between $75,000 and $99,999 annually.
Lower-income households are concentrated in the ranges under $50,000, while 31% of households earn above $100,000, showcasing an income disparity.
Median Income by Age of Householder
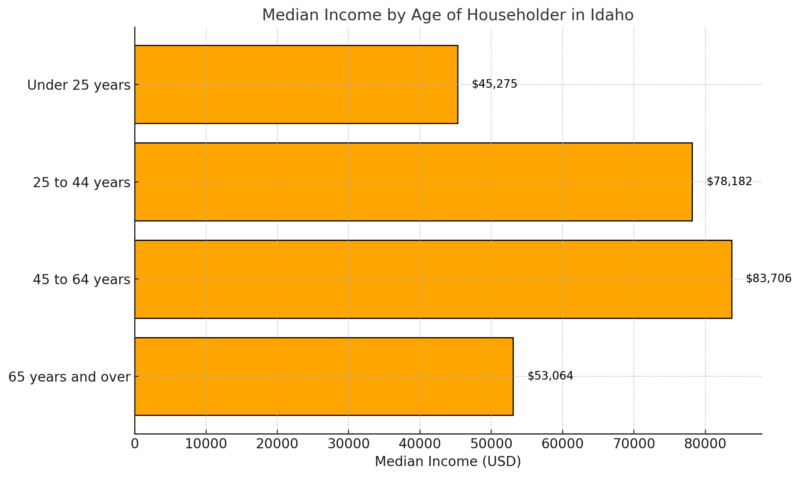
Income levels in Idaho rise significantly during the working years (25-64 years), peaking at $83,706 for householders aged 45-64.
Median income drops to $53,064 for those aged 65 and older, reflecting typical income trends as individuals transition into retirement.
Educational Attainment in Idaho vs. United States
Level of Education
Idaho (Estimate)
United States (Estimate)
Bachelor’s Degree or Higher
32.1% ± 0.6%
36.2% ± 0.1%
Idaho Educational Attainment Distribution (Population 25 Years and Older)
Level of Education
% of Population
Less than High School
Approx. 8-10%
High School Graduate
Approx. 25-27%
Some College, No Degree
Approx. 20-22%
Associate’s Degree
Approx. 10-12%
Bachelor’s Degree or Higher
32.1%
Idaho’s educational attainment for individuals aged 25 and older indicates that 32.1% have earned a bachelor’s degree or higher, slightly below the national average of 36.2% according to Census of 2020.
This gap reflects Idaho’s mix of rural and urban regions, where the workforce may be more reliant on trades or other non-degree-intensive industries.
High school graduates and those with some college education or associate’s degrees represent a significant share of the population, emphasizing a workforce with diverse educational backgrounds but fewer four-year degrees compared to the national average.
Continued investment in higher education and skill development could bridge this gap, enhancing opportunities for Idahoans in a competitive job market.
Health Stats
Disability Statistics in Idaho vs. United States
Metric
Idaho Estimate
US Estimate
Disabled Population
14.2% ± 0.4%
13.6% ± 0.1%
Hearing Difficulty
4.6%
N/A
Vision Difficulty
2.6%
N/A
Cognitive Difficulty
6.2%
N/A
Ambulatory Difficulty
6.0%
N/A
Self-Care Difficulty
2.3%
N/A
Independent Living Difficulty
5.6%
N/A
Idaho’s disabled population makes up 14.2% of its total, slightly higher than the national average of 13.6%.
Among the types of disabilities, cognitive and ambulatory difficulties are the most common at 6.2% and 6.0%, respectively.
Independent living difficulty also represents a significant share (5.6%), indicating a potential need for support services and infrastructure improvements.
The slightly higher prevalence of disabilities in Idaho may reflect its aging population or rural characteristics.
Fertility Statistics in Idaho vs. United States
Metric
Idaho Estimate
US Estimate
Women 15 to 50 years old
456,919 ± 2,382
77,984,030 ± 34,163
Women with Births in the Past Year
N/A
N/A
Births by Age Group
– 15 to 19 years
638
N/A
– 20 to 34 years
17,313
N/A
– 35 to 50 years
5,473
N/A
Idaho’s population of women aged 15-50 is 456,919, with the majority of births occurring among women aged 20-34 years (17,313 births).
This reflects the prime childbearing years. Births among younger and older age groups are significantly lower, consistent with national trends.
These data suggest that Idaho’s fertility rates align with typical age patterns for childbirth.
Health Insurance Coverage in Idaho vs. United States
Metric
Idaho Estimate
US Estimate
Population Without Health Coverage
8.9% ± 0.5%
7.9% ± 0.1%
The uninsured rate in Idaho stands at 8.9%, slightly above the national average of 7.9%.
This indicates room for improvement in access to healthcare coverage in the state.
Over the past decade, Idaho has seen a decline in its uninsured rate, but it still lags behind the U.S. average, suggesting disparities in healthcare access, especially in rural areas.
Migration Trends
In-Migration and Out-Migration (1990-2020)
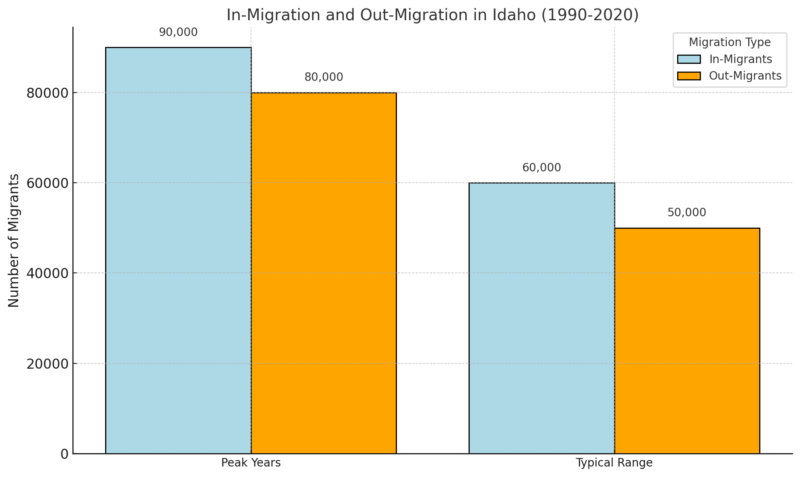
- Net migration has shown consistent growth over decades, with in-migration consistently exceeding out-migration according to Government sources.
Major Trading Partners (2019-2020):
- California: Contributed 62.7% of net migration and 22% of churn.
- Washington: Contributed 17.3% of net migration and 16.6% of churn.
- Oregon: Contributed 8.1% of net migration and 8% of churn.
Regional and Age Trends in Migration
Migration by Region
Region
Top Origin State
Top Destination State
Northern Idaho
Washington (53%)
Washington (68%)
North Central
Washington (86%)
Washington (88%)
Eastern Idaho
Utah (54%)
Utah (66%)
South-Central Idaho
California (30%)
Utah (37%)
Southeastern Idaho
Utah (63%)
Utah (64%)
Southwestern Idaho
California (33%)
Oregon (19%)
Changing Age Patterns of Migration
- Migrants in prime working ages (25-45 years) represent the majority of Idaho’s new arrivals.
- The share of prime-age migrants has consistently exceeded that of non-migrants.
Economic Impacts of Migration
Income Profile of Migrants
Year
Net Migration AGI
Non-Mover AGI
Migration Share
2011
$0B
$27.10B
-0.02%
2020
$4.31B
$50.01B
8.63%
Adjusted Gross Income (AGI) from migration has grown significantly over the past decade, with migration adding $4.31 billion to AGI in 2020, contributing nearly 9% of total income.
Net Migration Forecast (2024-2028)
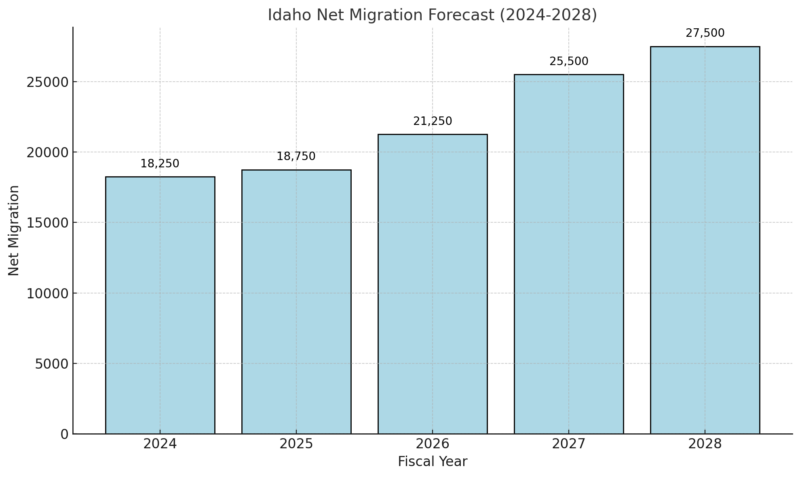
Migration rates are expected to accelerate, contributing to the state’s sustained population and economic growth.
Future Projections and Trends
View this post on Instagram
In-migration is a significant factor, contributing to nearly 88% of the population growth between 2021 and 2022. Many new residents are relocating from within the United States. This trend is anticipated to persist, further propelling Idaho’s growth.
The state’s demographic composition is also expected to change. By 2031, the population aged 65 and older is projected to grow by 30.7%. This increase is substantial compared to the 10.1% rise in those aged 15 to 64, and a modest 2.5% in residents under 15 years old.
Idaho remains one of the least diverse states in the nation, with over 90% of its population identifying as White. Yet, shifts in migration patterns may contribute to gradual demographic changes in the coming years. The diversity within the state is limited, but increasing migration might slowly alter this aspect.
Methodology
This article is crafted using the latest data from the U.S. Census Bureau, Idaho Department of Labor, and the American Community Survey.
We analyzed population trends, migration patterns, housing data, and labor market insights.
Key figures were cross-referenced with reputable sources like BLS, Redfin, and IRS Statistics of Income.
Data accuracy is ensured by focusing on reliable government datasets and professional demographic projections.
The content is structured to offer a comprehensive yet concise overview of Idaho’s growth dynamics.
References
- World Population Review – Idaho Population 2024
- Neilsberg – Idaho Population by Age
- Neilsberg – Idaho Population by Race
- Bureau of Labor Statistics (BLS) – Idaho Economic Overview
- Redfin – Idaho Housing Market Trends
- Income By Zip Code – Idaho Household Income
- Idaho Department of Labor – 2024 Population Growth Forecast
- IRS Statistics of Income – Idaho Migration and AGI
- Newsweek – Fastest Growing States: Idaho
- Census Bureau – Idaho Demographic Data
- Idaho State Legislature – Economic Outlook and Revenue Assessment Committee Report
- American Community Survey – Idaho 5-Year Estimates