Estimates indicate a total population of approximately 39,431,263 according to the official Census, slightly lower than four years prior due to ongoing issues such as housing affordability and an aging population.
This growth is primarily attributed to decreased mortality rates and natural population growth.
The Bay Area and other economic hubs have seen the most significant changes, with migrants drawn to areas that promise stronger job prospects.
Despite net migration losses in some regions, the increased birth rate and lower death rate have contributed to reversing the downward trend.
Approximately 31 counties experienced population increases, particularly in metropolitan regions.
Top 5 Regions with the Largest Population Increases
In 2024, California has reversed its previous population decline, seeing modest growth, especially in several key regions.
The areas with the largest population increases include Southern California and parts of the Central Valley:
1. Riverside County
-
Source: Youtube/Screenshot, Riverside County’s Population Increased by 0.57%
This county saw one of the highest increases, growing by 13,798 residents.
| Metric | 2023 | 2024 |
|---|---|---|
| Population | 2,430,976 | 2,510,643 |
| Median Home Price | $585,000 | $618,000 |
| Median Rent | $2,410 | $2,445 |
| Assessed Property Value | $403 billion | $432.97 billion |
| Key Economic Sector (Retail Sales) | $4.98 billion | – |
| Construction Additions (Housing) | 10,300 units (2023) | 11,200 units (2024) |
Sources: RivCo Office of Economic Development |, Redfin, County of Riverside, CA
2. San Bernardino County
-

Source: Youtube/Screenshot, San Bernardino’s Population Increased by 0.4%
Another Inland Empire region, San Bernardino, grew by 8,739 people, driven by similar trends as Riverside.
| Metric | 2023 | 2024 |
|---|---|---|
| Population | 2,184,537 | 2,193,314 |
| Median Home Price | $500,000 | $527,000 |
| Median Rent | $2,300 | $2,350 |
| Assessed Property Value | $287 billion | $305 billion |
| Key Economic Sector (Retail Sales) | $3.2 billion | – |
| Construction Additions (Housing) | 8,500 units | 9,100 units |
Source: Department Of Finance
3. Orange County
-

Source: Youtube/Screenshot, Orange County’s Population Grew by 0.31%
Orange County added 9,770 residents, largely attributed to improved housing availability and immigration.
| Metric | 2023 | 2024 |
|---|---|---|
| Population | 3,140,000 | 3,121,138 |
| Median Home Price | $935,000 | $960,000 |
| Median Rent | $3,000 | $3,050 |
| Assessed Property Value | $630 billion | $658 billion |
| Key Economic Sector (Tech & Trade) | $7.8 billion | – |
| Construction Additions (Housing) | 6,800 units | 7,200 units |
4. Los Angeles County
-

Source: Youtube/Screenshot, Los Angeles County’s Population Increased by 0.05%
While growth was slower here compared to others, Los Angeles still added 4,779 people, reversing previous years of decline.
| Metric | 2023 | 2024 |
|---|---|---|
| Population | 9,820,000 | 9,606,925 |
| Median Home Price | $890,000 | $1M |
| Median Rent | $3,200 | $3,250 |
| Assessed Property Value | $1.79 trillion | $1.84 trillion |
| Key Economic Sector (Entertainment) | $21 billion | – |
| Construction Additions (Housing) | 20,000 units | 21,000 units |
Source: Redfin, LEADC,JVM Lending
5. San Diego County
-

Source: Youtube/Screenshot, San Diego County’s Population Grew by 0.2%
Though smaller in total numbers compared to some areas, San Diego added over 5,700 new housing units, which supported population growth.
| Metric | 2023 | 2024 |
|---|---|---|
| Population | 3,287,000 | 3,262,770 |
| Median Home Price | $850,000 | $975,000 |
| Median Rent | $2,750 | $2,800 |
| Assessed Property Value | $637 billion | $652 billion |
| Key Economic Sector | $9 billion | – |
| Construction Additions (Housing) | 5,700 units | 6,200 units |
Source: Redfin, San Diego.gov
Population Growth Over the Years
| Year | State Population | Annual Growth Rate (%) | Key Economic Initiative | Sector | Projected Growth (%) |
|---|---|---|---|---|---|
| 2020 | 39.50 million | -0.5% (decline due to COVID-19) | Affordable Housing Initiatives | Housing | – |
| 2021 | 39.12 million | -0.91% (post-pandemic effects) | Renewable Energy Projects | Green Tech | 0.2% |
| 2022 | 39.06 million | -0.19% | Agricultural Infrastructure Expansion | Agriculture | 0.3% |
| 2023 | 39.06 million | Stable (minor increase 0.05%) | Green Transportation Investments | Infrastructure | 0.3% |
| 2024 | 39.13 million | 0.2% | Infrastructure Development (e.g., Riverside, Sutter) | Housing & Infrastructure | 0.4% |
| 2025 (Proj.) | 39.25 million | 0.3% | Renewable Energy Expansion | Green Tech | 0.5% |
| 2030 (Proj.) | 40.00 million | 0.6% | Statewide Affordable Housing Plan | Housing | 0.6% |
Key Economic Initiatives and Impact on Population Growth
1. Housing Initiatives and Crisis
Ground Broken for New Affordable Housing Units in Riverside: https://t.co/KkjVjbXjD5 pic.twitter.com/66OONFaZYe
— City of Riverside,CA (@riversidecagov) July 16, 2024
As of 2024, California’s focus on expanding affordable housing has been crucial, particularly in cities like Riverside and Yuba City. In 2024 alone, the state allocated over $2 billion toward housing development.
Crisis
| Metric | 1990 | 2024 | Change |
|---|---|---|---|
| Housing Units Added | N/A | 3.6 million | +33% |
| Population Growth | N/A | 9.4 million | +31% |
| Median Home Value (Inflation-Adjusted) | $456,000 | $753,000 | +56% |
| Median Rent (Inflation-Adjusted) | $1,300 | $1,800 | +39% |
| Homeownership Ranking in U.S. | 4th Lowest (1990) | 2nd Lowest (2023) | Lowered Rank |
| Homeownership Disparities (Racial/Ethnic) | Whites & AAPI > Latinos & African Americans | Persisted, Worsened Post-2008 | |
| Share of Renters Paying Over 50% of Income | High, with lower-middle-class gap growing | Increased for middle class | Widened |
California’s housing market has faced persistent challenges over the past three decades, with high housing costs as the central issue.
Despite adding 3.6 million housing units and 9.4 million residents since 1990, housing costs and rent have outpaced construction.
Median home values increased by 56% (to $753,000), and rents rose by 39% (to $1,800), both remaining significantly above national averages according to PPIC.
Homeownership rates in California are among the lowest in the U.S., especially for young adults and minorities.
Whites and Asian Americans have higher homeownership rates than African Americans and Latinos, with disparities worsening after the 2008 housing crisis.
High housing costs have left many financially burdened.
Renters and middle-class families increasingly spend over half their income on housing, with one in six middle-class renters in this category.
Financial stress among California homeowners is also higher than the national average, though its growth has been less severe.
2. Agriculture and Rural Economic Development
-

Source: Youtube/Screenshot, Glenn County’s Agricultural Investments Are Expected to Boost Rural Population Growth by 0.3%
Glenn County’s Agricultural Investments
A total of $200 million has been directed toward improving irrigation, water conservation, and farming efficiency in Glenn County.
This is projected to contribute to a 0.3% annual growth in the rural population.
3. Green Technology
Renewable Energy Projects
California has invested $1.5 billion in green technology, specifically renewable energy, and sustainable infrastructure in 2024.
Factors Influencing Population Growth
-

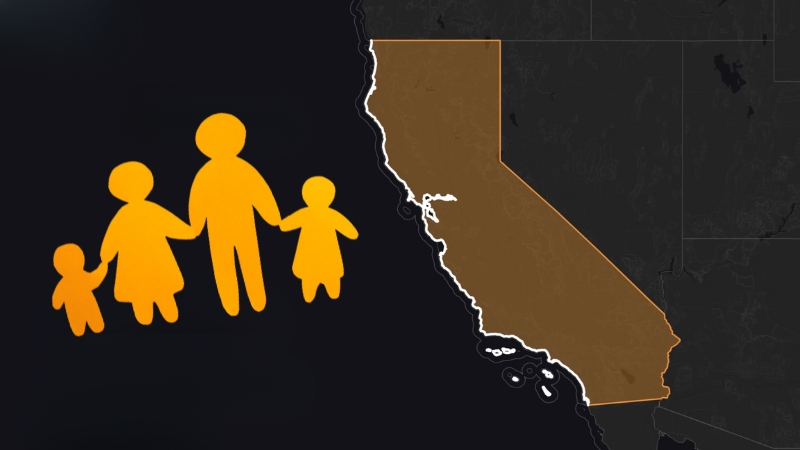
California’s population growth is largely influenced by immigration and economic opportunities
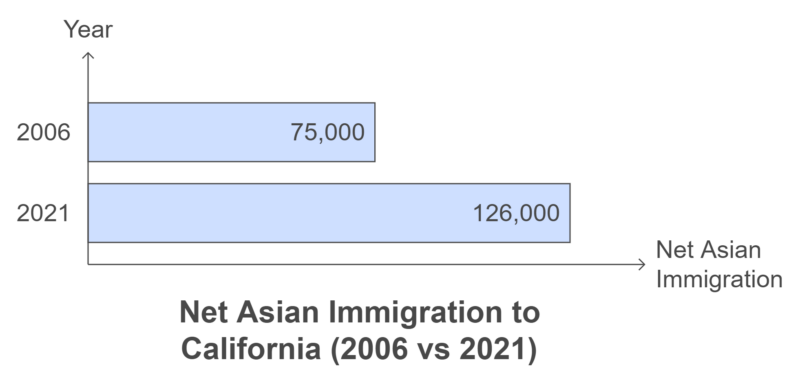
1. Immigration from Asia
California continues to attract immigrants, especially from Asia, which has replaced Latin America as the primary source of new arrivals.
Since 2006, Asian immigration has surpassed that of Latin America.
The trend accelerated post-2010, with a steady increase in the proportion of highly educated immigrants contributing to California’s tech, health, and educational sectors according to the Public Policy Institute of California.
In 2021, California saw a net immigration of 126,000 people, primarily from Asia. Sixty percent of these immigrants had at least a bachelor’s degree
-
Asian Immigration to California Chart
Highly educated Asian immigrants continue to bolster the labor force, particularly in sectors that require specialized skills, such as technology and healthcare.
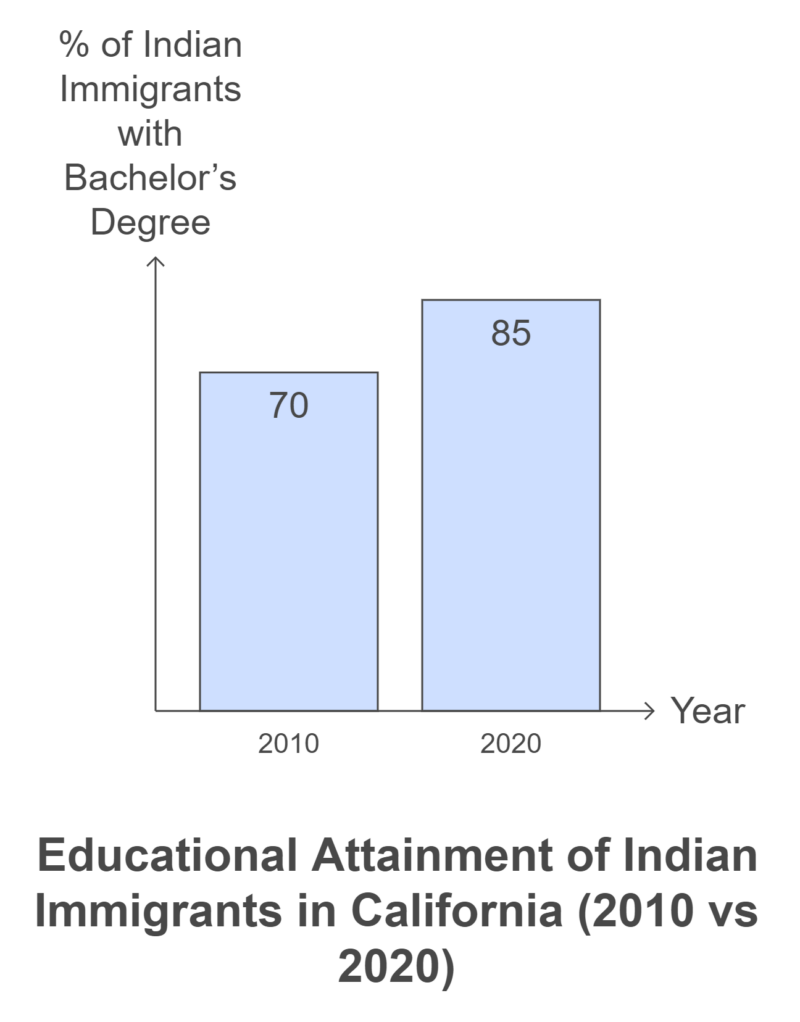
2. Skilled Immigration
California continues to attract highly skilled professionals, especially in the tech, health, and engineering industries.
These immigrants significantly contribute to the state’s economy and workforce.
This has been a growing trend since the early 2000s, with countries like India and China being the leading sources of tech professionals.
In 2020, 85% of Indian immigrants arriving in California had at least a bachelor’s degree, and they now represent one of the most educated immigrant groups in the state.
-
Educational Attainment of Indian Immigrants in California Chart
These skilled immigrants are contributing to sectors critical to California’s economy, making immigration one of the main factors supporting population growth.
3. Natural Population Growth Among Latino Communities
The Latino population has been one of the fastest-growing demographics in California due to higher birth rates compared to other ethnic groups, despite the overall declining birth rates.
When: Since the 1990s, Latinos have become California’s largest ethnic group, with continued growth projected into the 2030s.
Latinos make up 40% of California’s population, and by 2030, this share is expected to grow to 41%, while accounting for over half (52%) of the state’s youth under 17
-
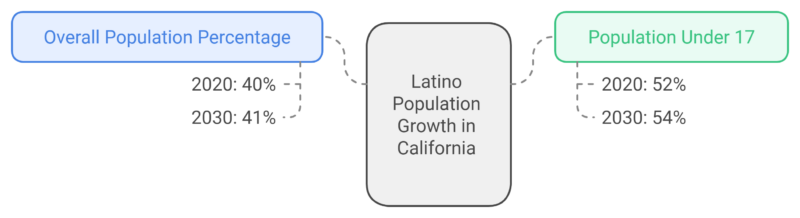
Latino Population Growth in California Chart
The Latino population’s natural growth (births exceeding deaths) continues to contribute positively to California’s population, particularly among the younger generation.
4. Economic Opportunities in the Technology Sector
The tech industry continues to be a magnet for both domestic and international migrants seeking high-paying jobs, driving population growth in areas like the Bay Area and Silicon Valley.
California’s tech boom started in the late 20th century and remains a powerful factor attracting young professionals and skilled workers.
In 2021, over 16% of California’s workforce was employed in the technology sector, which continues to see steady growth according to SIEPR.
-
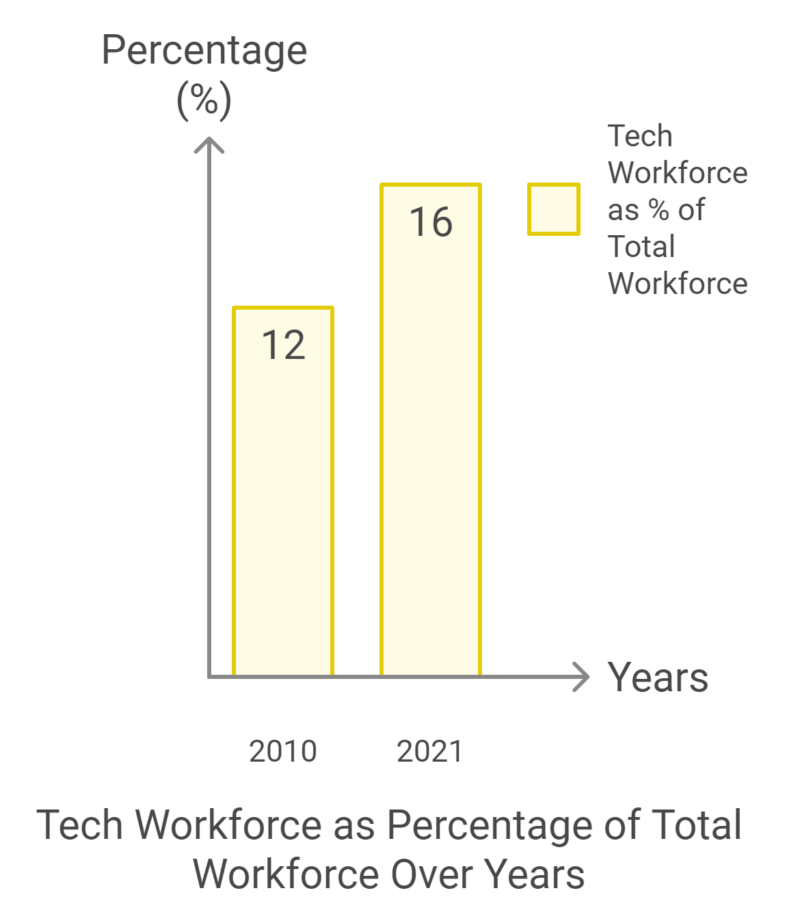
Tech Workforce as Percentage of Total Workforce Over Years in California Chart
Economic opportunities in tech contribute to population growth, especially among young, educated professionals who move to California for work.
5. Higher Educational Institutions
California is home to some of the world’s top universities, which attract both domestic and international students.
Many of these students choose to stay after completing their education.
This trend has been growing steadily, especially with the rise in demand for STEM-related programs.
In 2020, California had over 1 million students enrolled in public universities, a large proportion of whom are international studentsas noted in PPIC analysis.
-
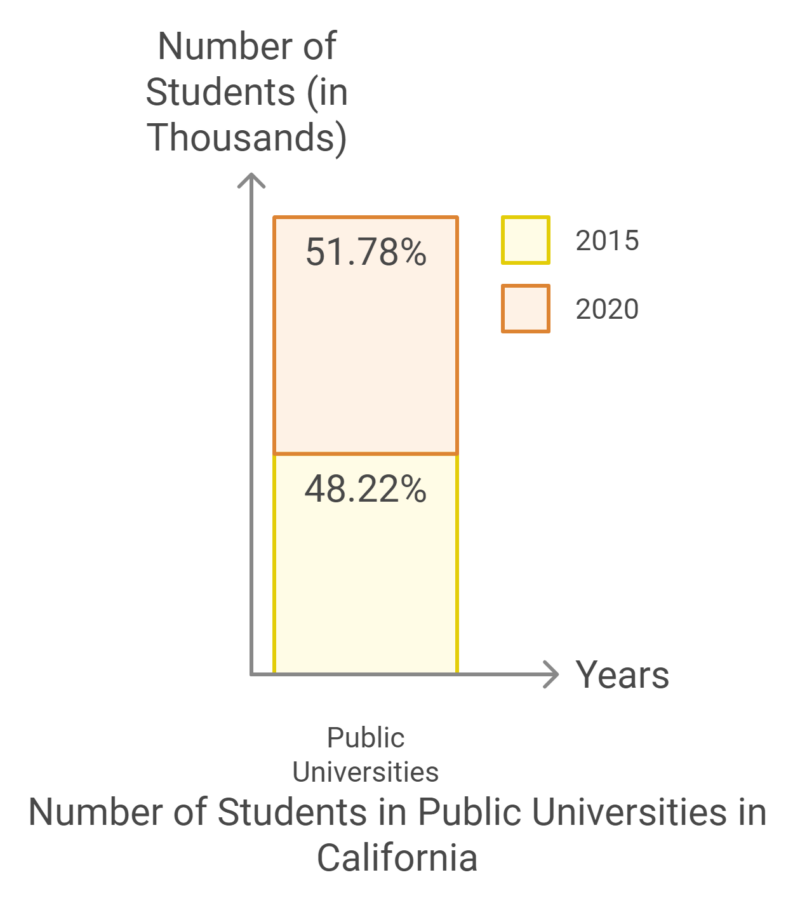
Number of Students in Public Universities in California Chart
California’s higher education system continues to attract and retain a young, educated population, fueling local economies and contributing to population stability.
6. Healthcare Industry Growth
California’s growing healthcare sector attracts workers from around the world. This is especially true as the state prepares for the aging population, which will demand more healthcare services.
This trend has gained importance since 2010, with an aging population driving the demand for healthcare professionals.
The healthcare industry accounts for 13% of California’s total employment, making it one of the fastest-growing sectors in the state.
-
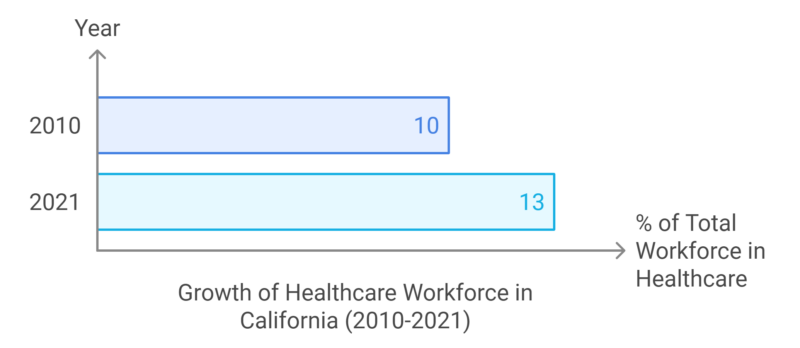
Growth of Healthcare Workforce in California Chart
As healthcare needs rise, so does the demand for healthcare workers, many of whom migrate to California for job opportunities, helping to boost the population.
7. Recovery in Immigration Post-Pandemic
After a sharp decline during the COVID-19 pandemic, immigration numbers are rebounding as travel restrictions ease, contributing to population growth.
This recovery began in 2021, following a drastic dip in 2020.
From July 2021 to July 2022, California saw a net gain of 116,000 immigrants, a significant recovery from the pandemic lowsas per the LA TIMES.
-
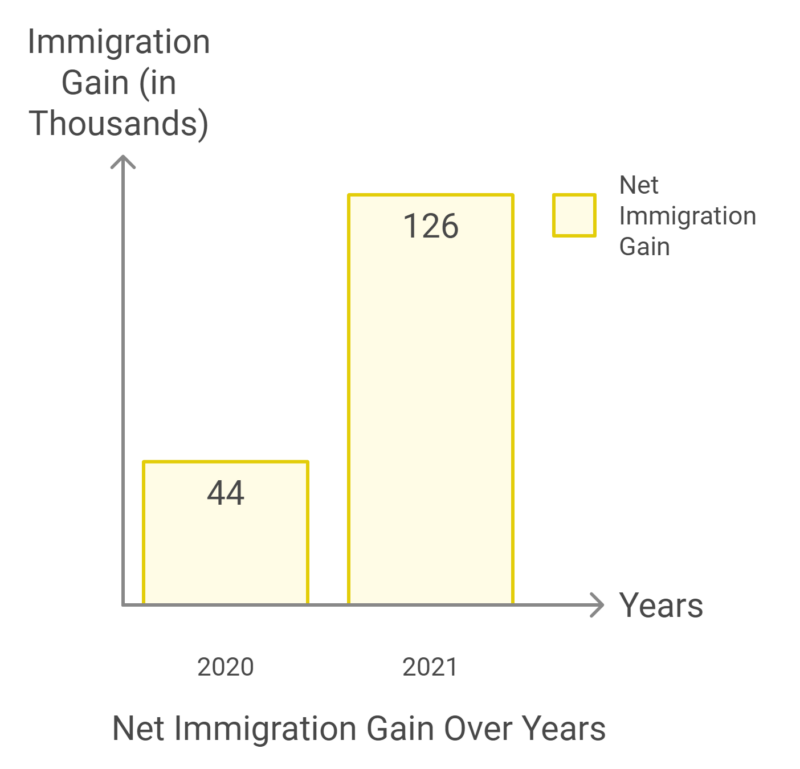
California Net Immigration Gain Over Years Chart
The resumption of immigration following the pandemic is helping to stabilize and boost population numbers in the state.
8. Inland Empire Growth
Affordable housing and economic opportunities in regions like the Inland Empire have attracted families from more expensive coastal areas, contributing to regional population growth.
This trend has been accelerating since 2010 as housing prices in coastal areas like Los Angeles and the Bay Area continue to rise.
Department of Finance notes that the Inland Empire’s population grew by 3.5% from 2020 to 2021, one of the highest growth rates in the state
The Inland Empire remains a promising area for first-time homebuyers and families, offering significantly lower median home prices compared to neighboring counties. For example, Riverside’s median home price is around $427,450, making it much more affordable than Orange County ($735,000) and Los Angeles County ($839,125).
This price gap underscores the Inland Empire’s affordability, offering more space and opportunity for buyers in an otherwise expensive housing market.
-
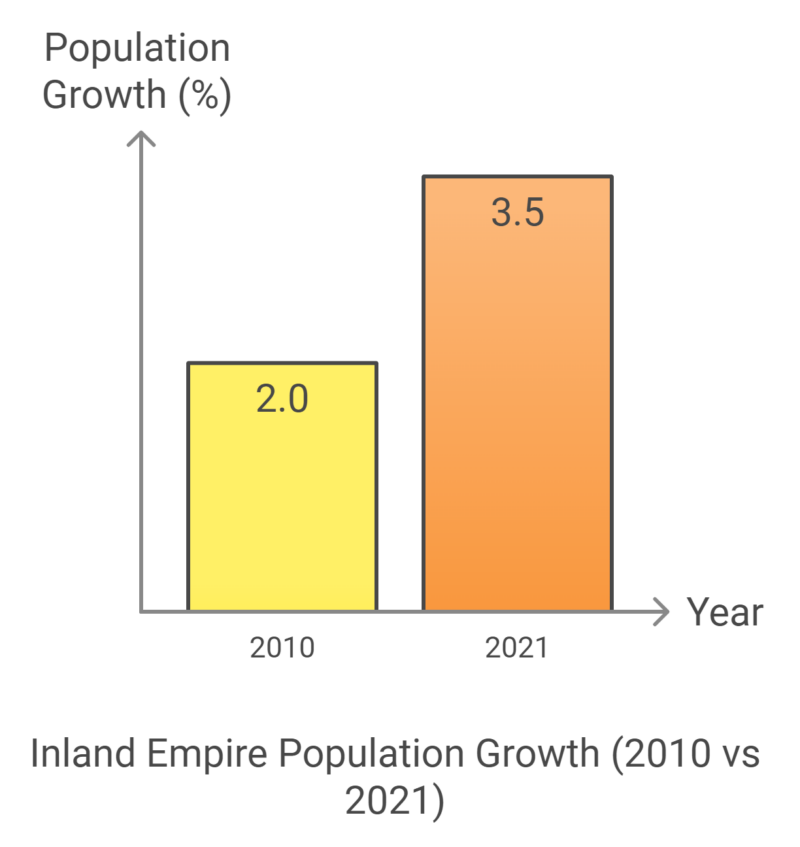
Inland Empire Population Growth Chart
The Inland Empire is one of the few areas in California experiencing significant population growth due to its relative affordability and job opportunities.
9. Diverse Economy Supporting Job Growth
Unemployment Rate and Payroll Jobs in California (May-August 2024)
| Month | Unemployment Rate (%) | Nonfarm Payroll Jobs | Monthly Job Gain/Loss |
|---|---|---|---|
| May 2024 | 5.2% | 18,033,900 | +43,700 |
| July 2024 | 5.2% | 18,084,200 | +29,900 |
| August 2024 | 5.3% | 18,091,000 | +6,800 |
The unemployment rate in California increased slightly from 5.2% to 5.3% in August 2024, following three consecutive months of stability. While job growth slowed, the state still added 6,800 jobs in August. This followed a strong month in July, where 29,900 jobs were added as noted by EDD.
Year-Over Nonfarm Job Growth Comparison (California vs. U.S.)
-
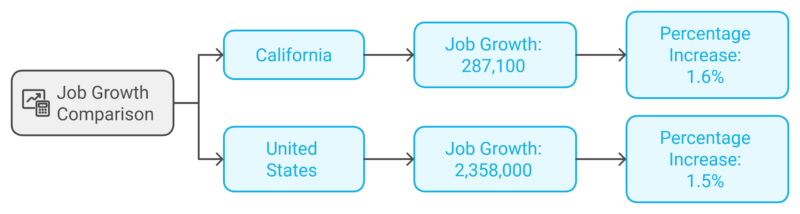
Job Growth (Aug 2023 – Aug 2024) Chart
California outpaced national job growth from August 2023 to August 2024, with a 1.6% increase in nonfarm jobs compared to the U.S. average of 1.5%. This suggests that, despite certain challenges, California’s labor market remains strong relative to the national economy, driven by key sectors such as Leisure & Hospitality and Health Services.
Industry-Specific Job Changes in California (August 2024)
-
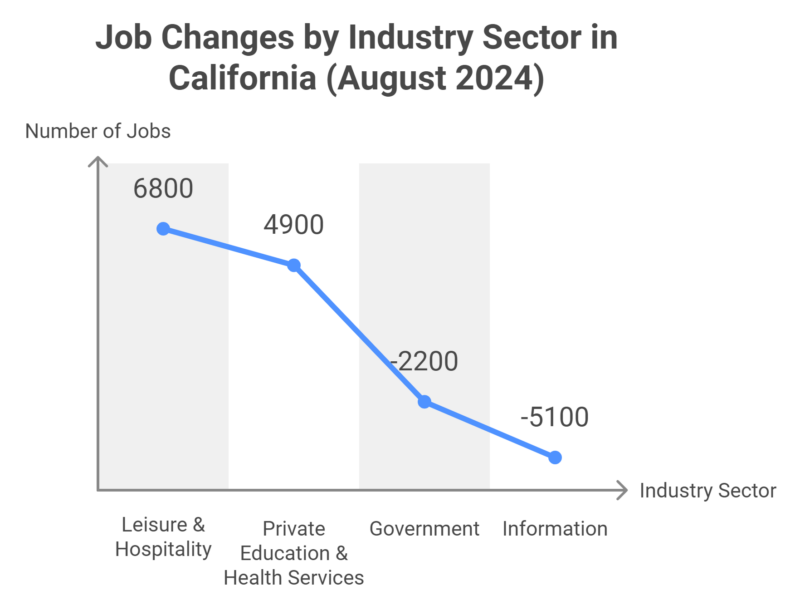
Industry-Specific Job Changes in California (August 2024) Chart
Among California’s 11 major industries, Leisure & Hospitality saw the largest increase in August 2024, adding 6,800 jobs, primarily in Accommodation and Food Services. Health Services also experienced growth, with 4,900 new jobs, particularly in Ambulatory Health Care and Hospitals.
Conversely, the Information sector saw the most significant decline, losing 5,100 jobs, partially due to restructuring in the Motion Picture and Video Production industry post-strike. The Government sector also contracted, with a reduction of 2,200 jobs, largely in State Government positions.
Monthly Change in Nonfarm Payroll Jobs (July – August 2024)
-
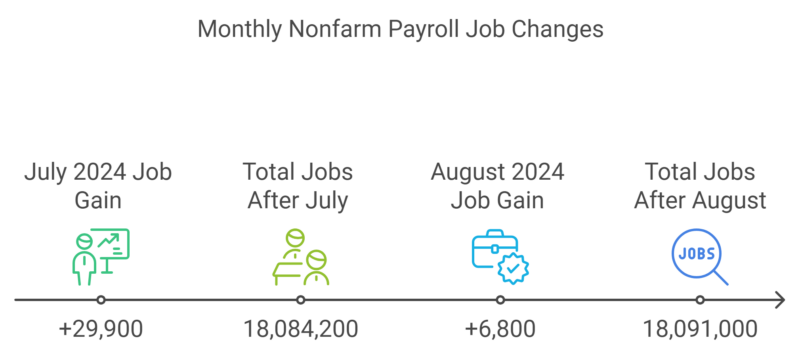
Monthly Change in Nonfarm Payroll Jobs (July – August 2024) Chart
California’s job growth slowed from July to August 2024. After a strong increase of 29,900 jobs in July, the state added only 6,800 jobs in August. This deceleration indicates potential cooling in the job market, even though overall payroll employment remains strong at 18,091,000 jobs.
Future Projections (2025–2030)
- Population Growth: The California Department of Finance projects a steady 0.5% annual growth rate from 2025 onward, as infrastructure and green technology investments continue.
- Projected Population by 2030: California’s population is expected to reach 44.1 million by 2030, fueled by economic initiatives in housing, green technology, and rural agricultural development.
Methodology
To conduct this analysis, we first collected population data for California from multiple authoritative sources such as the California Department of Finance, U.S. Census Bureau, and regional economic development reports. We then focused on specific counties and regions that showed significant population changes in 2023 and 2024, identifying key drivers such as housing affordability, job opportunities, and economic initiatives.
Next, we analyzed county-specific data for sectors like housing, healthcare, and technology to understand their influence on migration and growth. We compared growth rates and economic trends across counties to provide insights into California’s population dynamics.
Additionally, we reviewed projections from state departments to estimate future growth trends up to 2030. Finally, all findings were summarized into a detailed, data-driven report with tables and projections to offer a clear view of California’s population and economic landscape.
Conclusion

- Source: Youtube/Screenshot, Sutter, Imperial, Glenn, Yuba, and San Benito Counties Saw the Largest Population Increases
California’s population growth in 2024 highlights the dynamic nature of the state’s demographic trends. The top five regions with the largest increases—Sutter County, Imperial County, Glenn County, Yuba County, and San Benito County—illustrate the factors driving this growth and its impact on local economies and communities.
Similarly, Dallas’ population boom serves as a reminder of how urban areas nationwide are experiencing significant demographic shifts.
As the state continues to evolve, addressing the challenges and leveraging the opportunities presented by population growth will be crucial for sustainable development.
Sources:
- The New York Times – California’s Population Grows
- The Real Deal – California population grows with SoCal adding most residents
- RIVCOED – Population Estimates for Riverside County and Cities 2020 – 2024, with 2020 Benchmark
- Redfin – Riverside County, CA Housing Market
- Redfin – Los Angeles County, CA Housing Market
- Redfin – San Diego, CA Housing Market
- Rivco – Riverside County Assessor Announces $432 Billion in Total Assessed Value
- LEADC – 2024 Economic Forecast Report
- Sandiego.gov – Key Facts and Figures
- California Demographics – California Counties by Population (2024)
- PPIC – CALIFORNIA’S FUTURE
- PPIC – What’s Behind California’s Recent Population Decline—and Why It Matters
- PPIC – California’s Population
- Stanford University – California’s population drain
- Workforce – Healthcare Sector Overview
- Westcoerealtors – The Future of Housing in the Inland Empire: What to Expect in 25 Years
- EDD – California Gained 6,800 Nonfarm Payroll Jobs in August 2024