Atlanta, a major city in the southeastern United States, continues to experience significant growth in its population.
In 2025, the city of Atlanta boasts a population of over 514,465, marking a steady growth rate of 0.71% annually as per World Population Review.
But some sources like Census.gov reflect on that number to be 498,715.
As the capital of Georgia, Atlanta is not only a cultural and economic hub but also an attractive destination for new residents.
The metropolitan area of Atlanta is expanding even more rapidly.
The metro area population was around 6,193,000 in 2025, reflecting a trend that has seen the community grow consistently over recent years.
This growth highlights Atlanta’s role as a key center for business and innovation in the region.
Table of ContentsKey Takeaways
1. Half of The Population Being African American
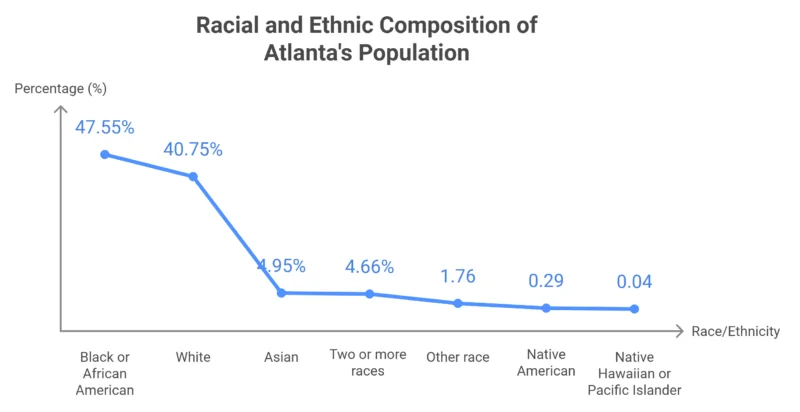
This data represents a breakdown of the population by race and ethnicity. The largest group is Black or African American, making up 47.55% of the population, followed by White individuals at 40.75%. Asian residents account for 4.95%, and those identifying with two or more races make up 4.66%.
Smaller percentages include Other race (1.76%), Native American (0.29%), and Native Hawaiian or Pacific Islander (0.04%). This breakdown highlights the diversity within the population, with significant representation among minority groups.
Demographic Breakdown

- African American Population: 48 percent
- White Population: 41 percent
- Hispanic and Latino Population: Growing segment, reflecting broader national trends.
- Asian Population: Smaller but important part of the community.
Cultural Influence
The African American community in Atlanta has a rich history and plays a central role in the city’s cultural and social life. The city is home to significant historical sites, institutions, and events that celebrate and preserve African American heritage.
Economic and Social Contributions
African Americans in Atlanta are integral to the local economy, with strong representation in various sectors, including business, arts, and education. Their contributions help shape Atlanta as a major urban center in the Southeast.
2. Atlanta’s Population Exceeds 514,465
Category
Details
Total Population
Over 514,465
Growth Rate
2.1% increase from 2023
New Residents Added
10,800
African American Population
48%
White Population
41%
Hispanic Population
Growing segment
Asian Population
Smaller but significant
Renters
54%
Homeowners
46%
Poverty Rate
17.73%
African American Poverty Rate
26.57%
Bachelor’s Degree Holders
32%
Graduate Degree Holders
25%
Atlanta has grown to over 514,465 people in 2025. The city has seen a 2.1 percent increase in its population from the previous year. This growth is driven by the city’s job opportunities, cultural appeal, and location in the Southeast.
Population Growth
The City of Atlanta’s population growth outpaced the metro area’s for the second straight year. https://t.co/SB9FzuOhxt
— Atlanta Business Chronicle (@AtlBizChron) July 11, 2024
The Atlanta region has continued to grow, with the 11-county area adding 62,700 residents between April 2023 and April 2024, bringing the total population to about 5.2 million.
This represents a 1.22% growth rate, slightly lower than the previous year’s addition of 66,730 people, reflecting a moderation in housing and job growth alongside high housing prices.
The City of Atlanta experienced the fastest growth at 2.1%, adding 10,800 new residents. Cherokee County grew by 1.88%, adding 5,400 people, while Henry County increased by 1.84%, adding 4,750. Fulton County, including Atlanta, saw the largest numeric growth with 17,400 new residents as per Atlanta Regional research.
Gwinnett County reached a milestone, surpassing 1 million in population for the first time. Douglas County also had a significant increase of 1.6%, adding 2,400 residents, a jump from its previous year’s rate of 0.9%.
The growth was primarily driven by Atlanta’s strong economy, with employment in the metro area rising by 6.4% since the start of the pandemic. In terms of residential development, 28,595 building permits were issued in 2023, a 21% decline compared to 2022, highlighting a cooling in the housing market. The City of Atlanta led in issuing permits, especially for multifamily units, followed by Gwinnett, Cobb, and DeKalb counties.
3. Housing is High
Category
Details
Median Property Value
$395,600
National Average Property Value
$281,900
Property Value Increase (2021-2022)
14.1%
Homeownership Rate
45.7%
National Homeownership Rate
64.8%
Median Household Income
$77,655
Highest Median Household Income (Tracts)
Census Tract 97: $250,001; Census Tract 102.11: $198,182; Census Tract 99: $180,500
Average Commute Time
27.5 minutes
Car Ownership per Household
Approximately 2 cars
Median Property Taxes
$3,000+ (Most Common Range)
Homeownership with Mortgage
63.8%
- Median Property Value: In 2022, the median property value in Atlanta, GA was $395,600, which was significantly higher compared to the national average of $281,900. This value increased by 14.1% between 2021 and 2022, indicating a strong rise in real estate demand and market appreciation in Atlanta as noted by DATAUSA.IO.
- Homeownership Rate: The homeownership rate in Atlanta stood at 45.7%, notably lower than the national average of 64.8%. This suggests that Atlanta has a higher proportion of renters compared to many other U.S. cities, likely due to factors like higher housing costs or a larger transient population of students and young professionals.
- Income Levels: The median household income in Atlanta was $77,655 in 2022. In certain areas, such as Census Tract 97, the median income exceeded $250,000, showing significant income disparity within the city. High-income pockets indicate neighborhoods with luxury housing and affluent residents.
- Average Commute and Car Ownership: The average commute time for Atlanta residents is 27.5 minutes, which reflects the city’s traffic and the spread-out nature of Atlanta’s metropolitan area. Households own an average of 2 cars, aligning with national averages, suggesting car dependency given Atlanta’s urban design and the availability of public transport.
- Property Taxes: Most Atlanta homeowners fall into the $3,000+ property tax bracket, highlighting relatively high property taxes compared to the national standard. This could be indicative of the rising property values and the investments made in real estate.
- Mortgages and Renting: With 63.8% of homeowners having a mortgage, it reflects that a significant proportion of owners are financing their properties, possibly due to the rising property values. The homeownership rate, at 45.7%, increased slightly from 45.2% in the previous year, indicating a slight upward trend in property purchases despite high costs.
4. The Economy is Growing
Despite the growth, the city faces challenges. About 17.73 percent of residents live in poverty. African Americans have the highest poverty rate at 26.57 percent. This shows ongoing issues with economic inequality.
The median household income in Atlanta, GA, in 2023 was reported as $83,251, which is approximately 10% higher than the median income across the state of Georgia ($72,837). This figure reflects Atlanta’s role as a thriving economic hub with salaries that slightly exceed the state’s average, driven by the presence of key industries like technology, finance, and business services.
Additionally, Atlanta’s per capita income was reported at $61,617, which is significantly above the average for the broader metro area and state, indicating a relatively high earnings capacity per individual compared to other regions in Georgia as per Census Reporter.
Employment Sector Overview (July 2024)
Industry Sector
Employment (in thousands)
% Change from Jul 2023
Total Nonfarm
3,092.1
1.7%
Mining and Logging
2.1
5.0%
Construction
146.7
1.5%
Manufacturing
183.1
0.5%
Trade, Transportation, and Utilities
656.9
0.0%
Information
94.9
-5.7%
Financial Activities
210.5
2.5%
Professional and Business Services
583.6
-1.0%
Education and Health Services
418.3
3.3%
Leisure and Hospitality
337.5
7.1%
Other Services
108.5
2.9%
Government
350.0
4.7%
The total nonfarm employment in Atlanta reached 3,092.1 thousand in July 2024, marking a 1.7% growth compared to July 2023. This growth was particularly strong in sectors such as Leisure and Hospitality (+7.1%), Education and Health Services (+3.3%), and Financial Activities (+2.5%).
However, some sectors like Professional and Business Services and Information experienced a decline, indicating a sectoral shift in employment dynamics as per the BLS report.
Occupational Wages (May 2023)
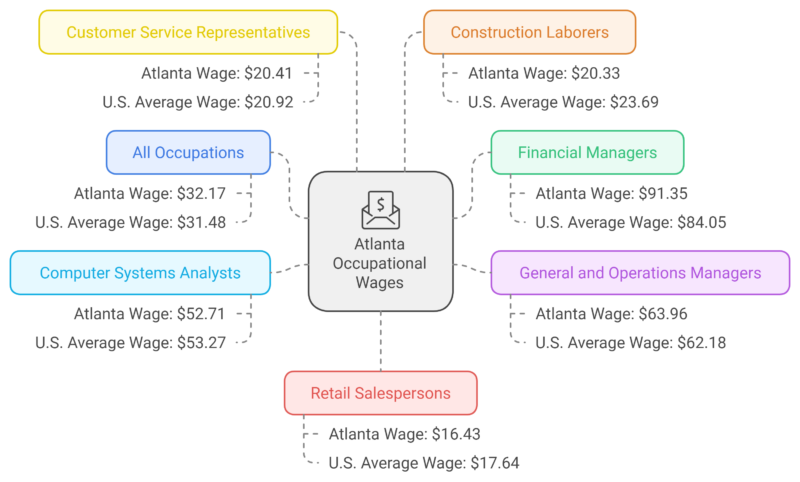
The average hourly wage across all occupations in Atlanta was $32.17, which is slightly above the national average of $31.48. Notably, Financial Managers earned substantially higher in Atlanta, with an average hourly wage of $91.35, compared to the U.S. average of $84.05.
This wage differential highlights the financial sector’s prominence in Atlanta. Conversely, occupations like Retail Salespersons and Construction Laborers tend to earn below the national average.
Cost of Living and Average Expenditures (2021-22)
Expenditure Category
Average Spending Atlanta Area ($)
U.S. Average Spending ($)
Housing
24,914
23,462
Transportation
12,354
11,645
Food
9,075
8,818
Healthcare
5,450
5,651
Personal Insurance & Pensions
9,666
8,308
All Other Items
11,078
12,168
Residents in Atlanta tend to spend slightly more on housing ($24,914) and transportation ($12,354) compared to the U.S. average. Higher costs in these categories could be attributed to the rising real estate prices and increased demand for city living.
Notably, healthcare expenditure was slightly below the national average, which might be indicative of better healthcare coverage or competitive healthcare pricing in the Atlanta region.
5. Education Is On Its Rise
School Types Breakdown
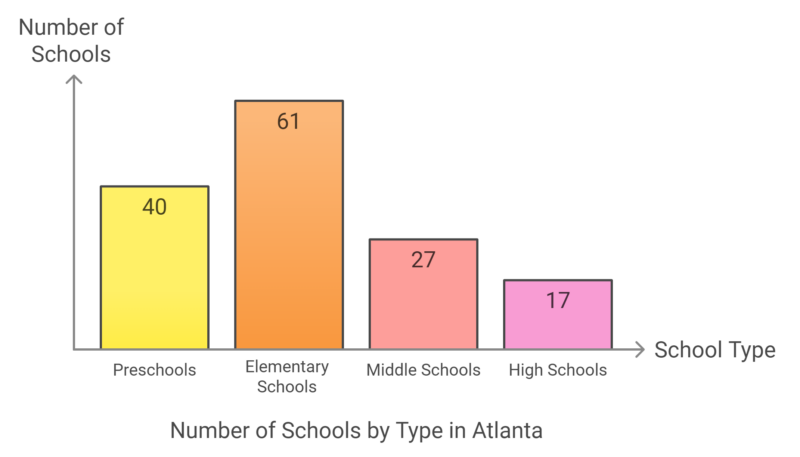
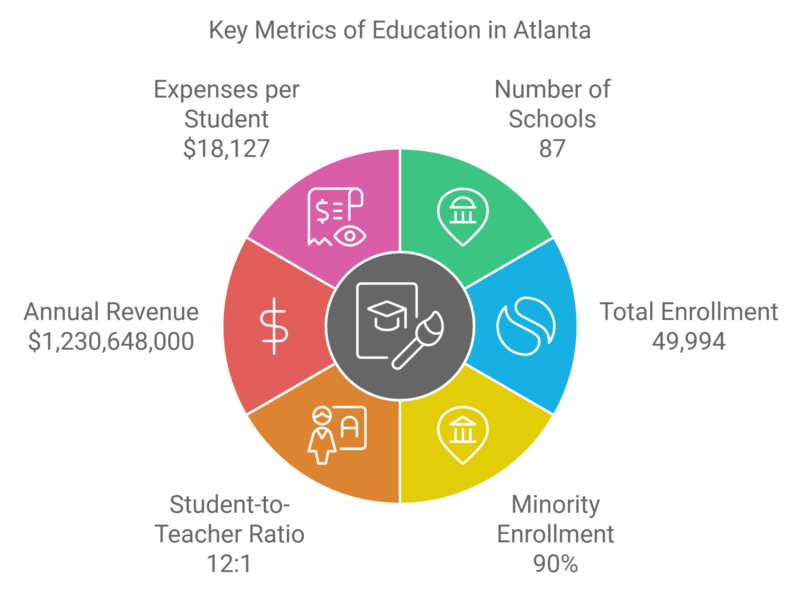
Atlanta Public Schools (APS) comprises 87 schools, including 61 elementary, 27 middle, and 17 high schools, in addition to 40 preschools.
APS serves approximately 49,994 students with a student-to-teacher ratio of 12:1, which is notably lower than the state average of 15:1.
This lower ratio may contribute to more focused student-teacher interactions.
Enrollment Demographics
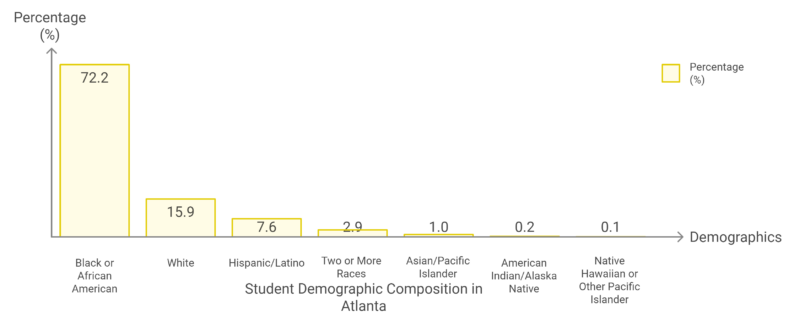
The student population in APS is 72.2% Black or African American, making up the majority of the district, followed by 15.9% White and 7.6% Hispanic/Latino.
This high level of diversity underscores APS’s mission to serve a broad spectrum of communities and cultural backgrounds.
The district also has a slightly higher proportion of males (51%) compared to females (49%).
Teacher Qualifications and Student Support
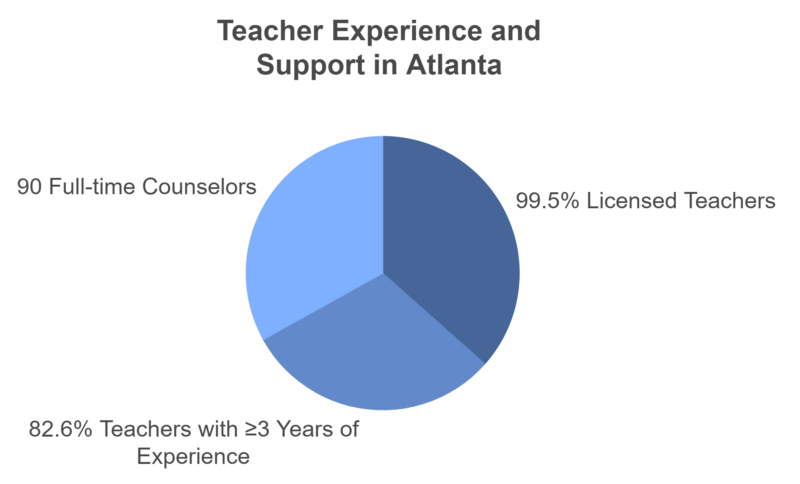
Explanation: APS boasts a highly qualified teaching workforce, with 99.5% of teachers licensed and 82.6% having three or more years of experience.
Additionally, APS employs 90 full-time counselors to provide student support, reflecting a commitment to both academic and emotional development.
Test Scores at Atlanta Public Schools

Explanation: APS struggles with student proficiency in standardized testing. Only 24% of elementary students and 25% of middle school students tested at or above the proficient level in reading, with math scores even lower. This points to challenges in achieving academic proficiency, which might be attributed to socioeconomic disparities or gaps in learning resources.
Financial Overview
Metric
Value
Total Annual Revenue
$1.23 billion
Spending per Student
$18,127
Instruction Spending
$510.2 million
Support Services
$368.4 million
Other Expenses
$27.6 million
Revenue Sources
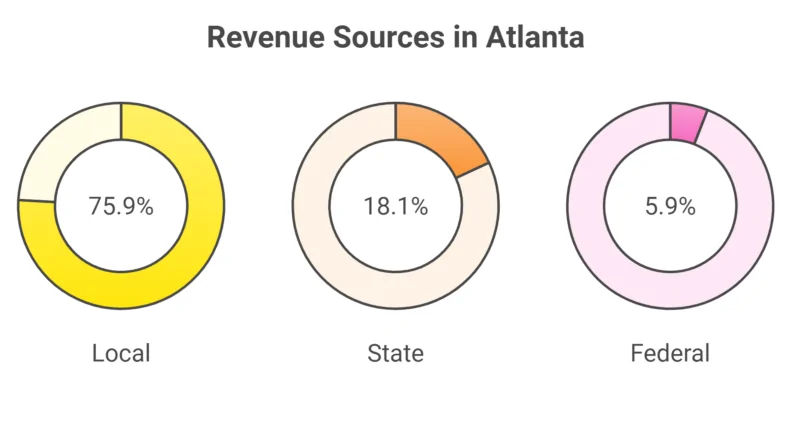
APS has an annual revenue of over $1.23 billion, primarily derived from local sources (75.9%), reflecting a reliance on property taxes and other local revenue streams.
APS spends about $18,127 per student annually, with $510.2 million directed toward instruction and $368.4 million on support services.
This allocation reflects the district’s focus on direct educational services while also ensuring that support structures are in place to enhance student learning environments.
Summary
- Atlanta Public Schools is a large district, with 87 schools and a student population of 49,994 as per US NEWS.
- The majority of the students are Black or African American (72.2%), and the minority enrollment is around 90%.
- Despite a strong teaching staff (99.5% licensed), student proficiency scores are relatively low, indicating room for improvement in educational outcomes.
- APS’s financial health is supported largely by local funding, spending around $18,127 per student, emphasizing investment in both instruction and support services.
6. Atlanta Has a Poverty Rate of 17.73%
The poverty rate in Atlanta, GA is approximately 17.7%, affecting an estimated 82,182 individuals out of a total population of around 463,513.
This rate is notably higher than both the state average for Georgia (12.7%) and the national average (12.6%).
When broken down by race, the poverty rate reveals significant disparities, with 28% of Black or African American residents in Atlanta living below the poverty line, compared to 7.3% for White residents and 15.5% for Asian residents. Among Hispanic or Latino individuals, the poverty rate stands at 13.7%.
The poverty rate also varies considerably by age, with about 27.2% of children under 18 years old living in poverty, and 24.6% for those aged 60 and over.
Interestingly, there is also a gender disparity in poverty rates, with 20.3% of women in Atlanta living in poverty compared to 15.8% of men.
These statistics highlight the economic challenges that exist in the city, with some population segments facing more significant hardships than others as per WelfareInfo notes.
Additionally, according to data from Census Reporter, the broader Atlanta-Sandy Springs-Alpharetta metro area has a poverty rate of about 10%, which is below the U.S. average.
This contrast between the city of Atlanta and its surrounding metro area underscores how poverty levels can differ even within a close geographical region.
Atlanta Mayor Andre Dickens has proposed a $60 million investment in housing as the city faces an increasing homeless population.
The proposal, which requires approval from the City Council, would use both public and private funding to support various housing projects throughout the city.
Dickens aims to create 700 affordable housing units by next year.
As a Democrat running for reelection in 2025, Dickens noted that, if approved, this would be the city’s largest-ever single investment to address homelessness.
“I believe that the lack of affordable housing has reached a crisis level, not just here in Atlanta, but in cities all across the United States of America and in every part of our region,”
Dickens said at a news conference in downtown Woodruff Park, where many homeless people often congregate.
More about that u can find on AP News article right here.
Poverty Across Demographics
- African Americans in Atlanta face the highest poverty rate, with 26.57 percent of this group living below the poverty line. This statistic underscores the ongoing struggle with economic inequality that disproportionately affects Black communities in the city.
- White residents experience a significantly lower poverty rate at 7.41 percent, indicating a substantial economic gap compared to other racial groups.
- Hispanic residents have a poverty rate of 18.27 percent, showing that this growing community also faces significant economic challenges.
- Asian residents have a poverty rate of 16.63 percent, which, while lower than that of African Americans and Hispanics, still reflects the economic difficulties some in this community face.
7. Crime Statistics for Atlanta, GA (2024)
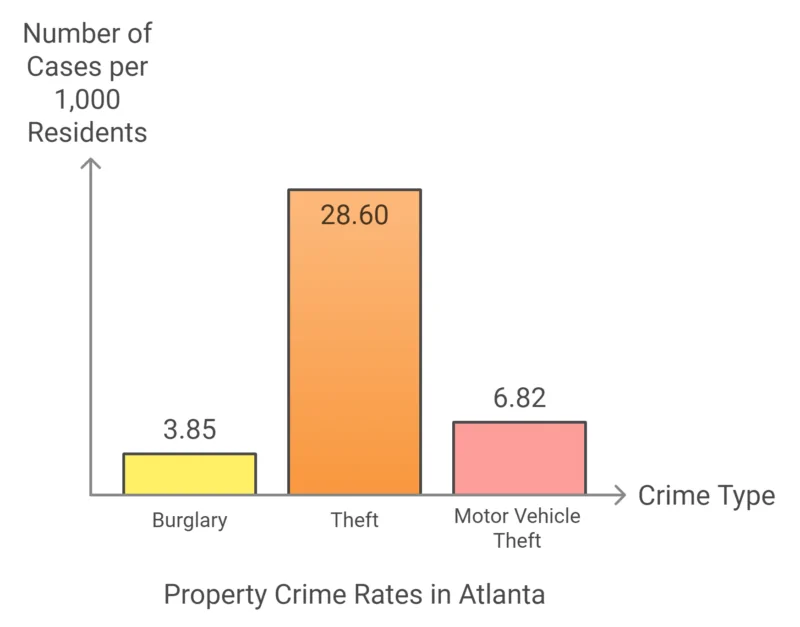
Atlanta continues to face significant crime challenges, with both violent and property crime rates much higher than national and state averages. Below is a summarized overview of crime data in Atlanta according to Neighborhood Scout.
Crime Type
Number of Crimes
Rate per 1,000 Residents
Chances of Being a Victim
Violent Crimes
4,312
8.64
1 in 116 (in Atlanta)
Property Crimes
19,600
39.27
1 in 25 (in Atlanta)
Total Crimes
23,912
47.91
Detailed Breakdown of Violent Crime
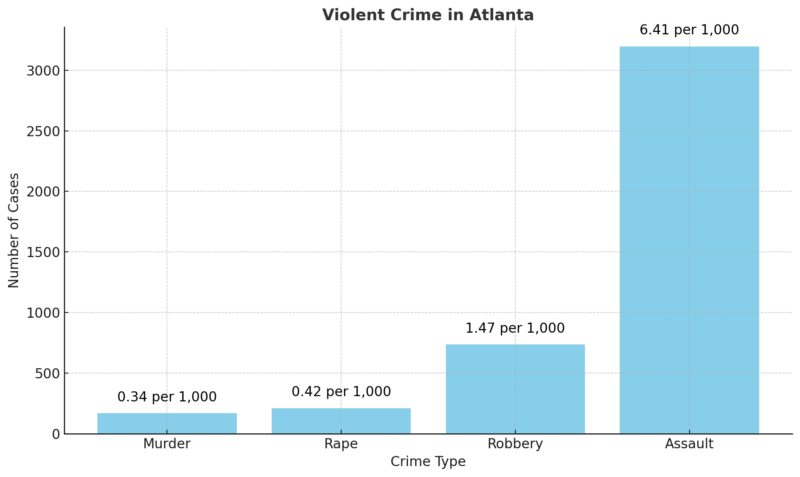
Detailed Breakdown of Property Crime
Summary
- Crime Index: Atlanta scores a crime index of 3, meaning it’s safer than only 3% of U.S. cities.
- Violent Crime: Residents face a high risk of becoming a victim of violent crime compared to the state average (1 in 116 versus 1 in 272).
- Property Crime: Atlanta has a significant property crime issue, with theft being the most prevalent type of crime, occurring at a rate of 28.6 per 1,000 residents.
Methodology
This article uses data from World Population Review, U.S. Census Bureau, Atlanta Regional Commission, Bureau of Labor Statistics, Neighborhood Scout, and U.S. News & Education to provide an overview of Atlanta’s demographics, economy, education, housing, and crime in 2024.
Reliable sources were cross-referenced for accuracy, giving a concise and data-driven analysis of the city’s key statistics.
References
- World Population Review – Atlanta, Georgia Population 2024
- Macrotrends – Atlanta Metro Area Population 1950-2024
- ARC – ARC 2024 Population Estimates Show Atlanta Region Adds 62,700 Residents in Past Year
- DATAUSA – Housing Atlanta
- Census Reporter – Atlanta, GA
- USN – Atlanta Public Schools
- Neighborhood Scout – Crime Rate Atlanta 2024


