In 2025, Louisiana’s population will be approximately 4.56 million according to the World Population Review.
Located in the southern United States, it borders Arkansas, Mississippi, Texas, and the Gulf of Mexico, covering 51,840 square miles.
The population is diverse, with the majority being White (59.45%) and African American (31.56%).
The median age is 36.2 years, and the state is evenly split by gender. Major cities include New Orleans, the largest metropolitan area, and Baton Rouge, the capital.
Louisiana is divided into 64 parishes and has a predominantly Christian population, reflecting its rich cultural and historical heritage.
Table of Contents
ToggleKey Takeaways
Population By Age
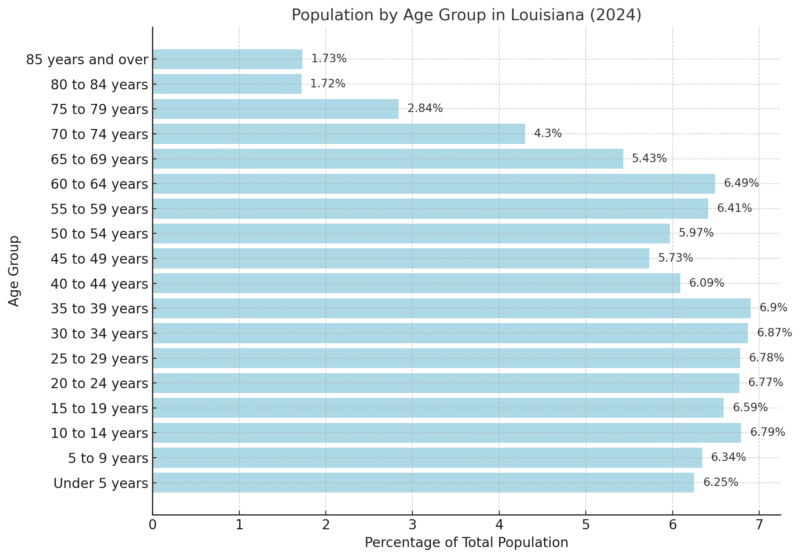
According to the 2018-2022 ACS 5-Year Estimates, Louisiana’s median age is 37.6 years. The population distribution shows that 19.38% are under 15 years old, 20.14% are between 15 and 29, 44.46% fall within the 30 to 64 age group, 14.29% are aged 65 to 84, and 1.73% are 85 years or older.
Population Distribution by Age Group
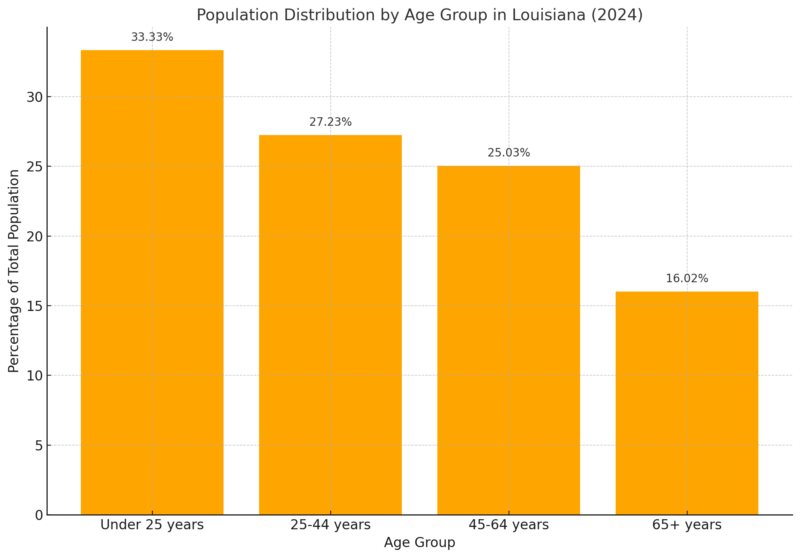
The population is predominantly in the working-age group of 25-44 years, comprising 27.23% of the total, while the elderly population aged 65 and over accounts for 16.02%. A significant portion, 33.33%, is under 25 years old, reflecting a relatively young demographic base.
Age Cohort Breakdown
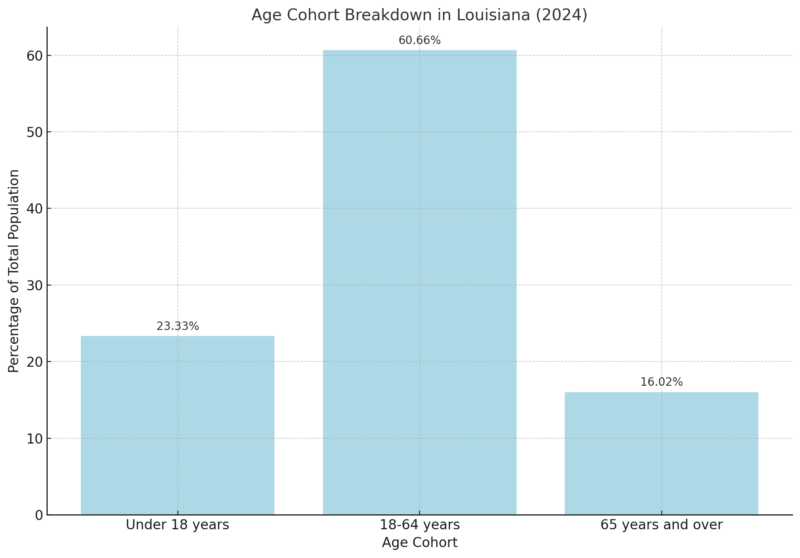
The largest cohort in Louisiana is the working-age group (18-64 years), making up 60.66% of the population. The younger cohort under 18 years accounts for 23.33%, slightly above the national average, while the elderly population (16.02%) is marginally below the national average, highlighting a younger overall state demographic.
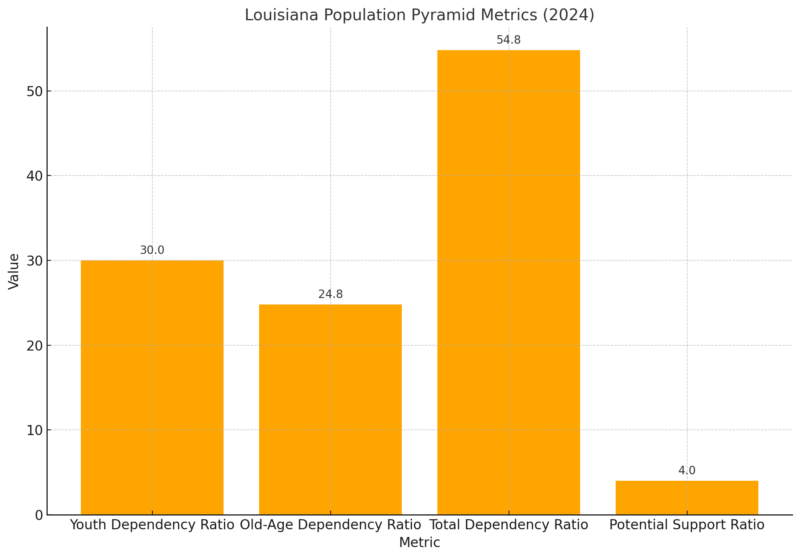
Louisiana Population Pyramid Metrics
Population Distribution by Race
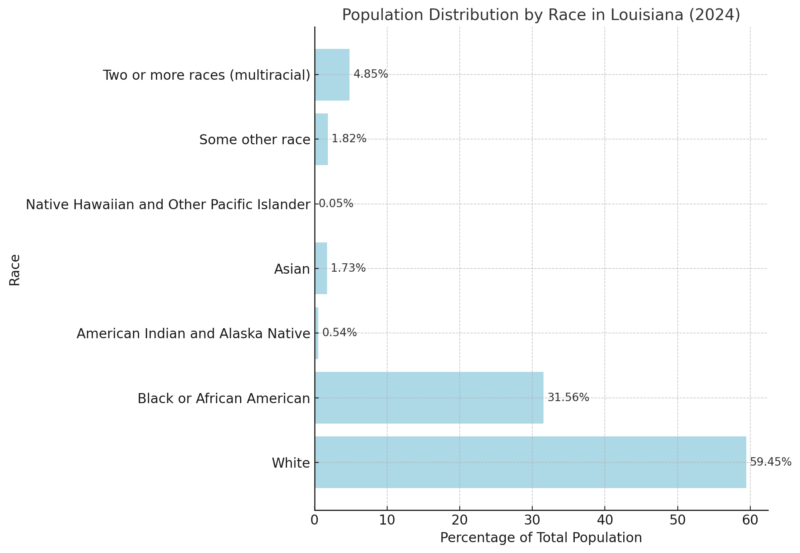
Louisiana’s racial composition is predominantly White, accounting for 59.45% of the population, followed by Black or African American individuals at 31.56% as per Neilsbergs article.
These two groups form the vast majority, reflecting the state’s historical and cultural background.
Smaller racial groups include Asians (1.73%), individuals of some other race (1.82%), and American Indian and Alaska Native populations (0.54%).
Native Hawaiian and Other Pacific Islanders make up a very small portion at 0.05%.
Louisiana Counties Population 2025
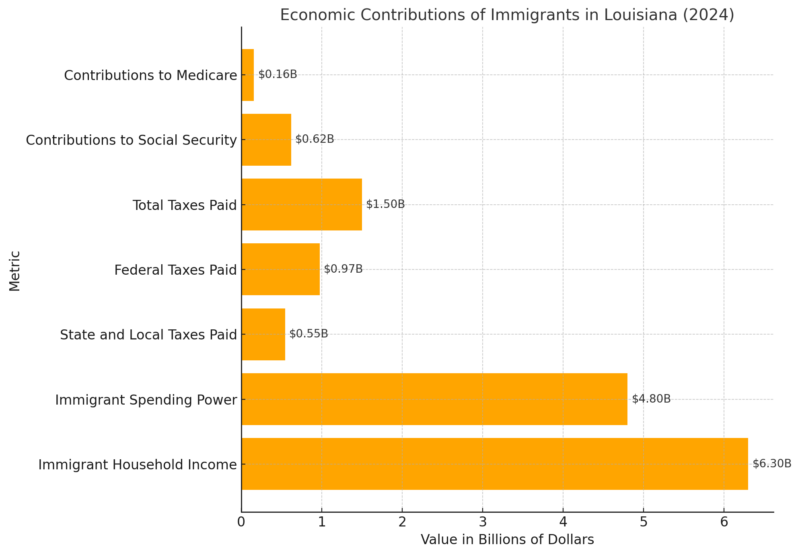
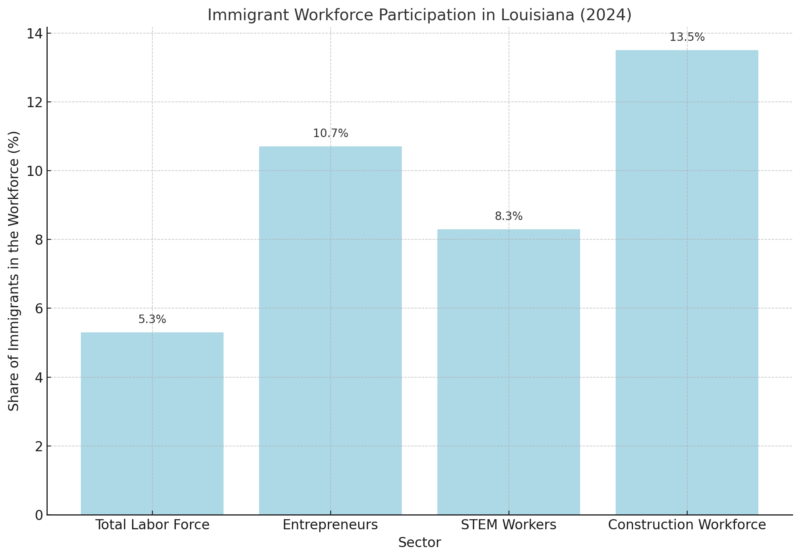
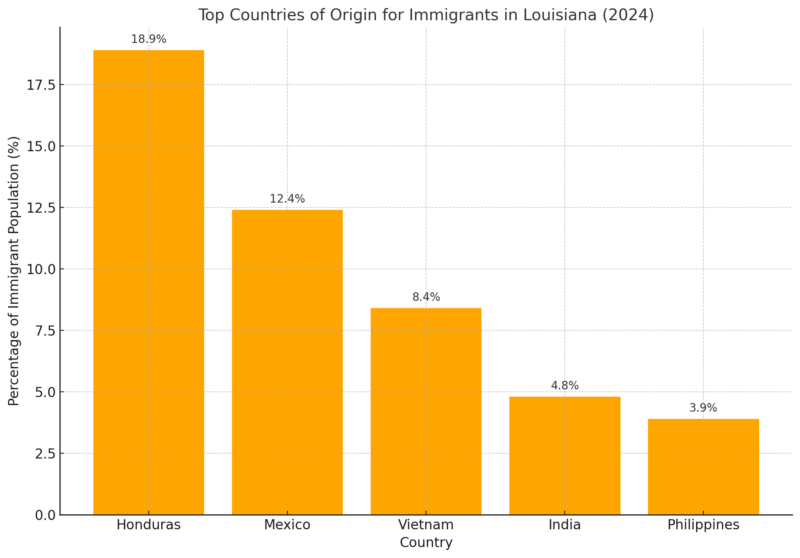
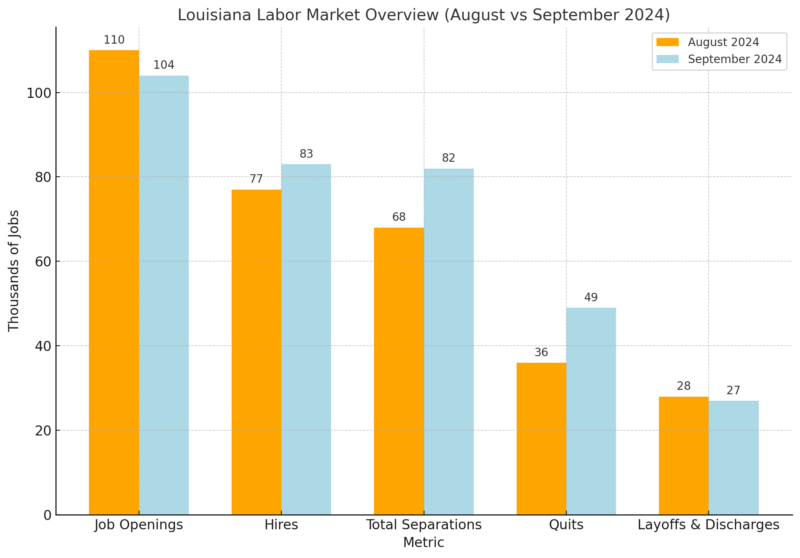
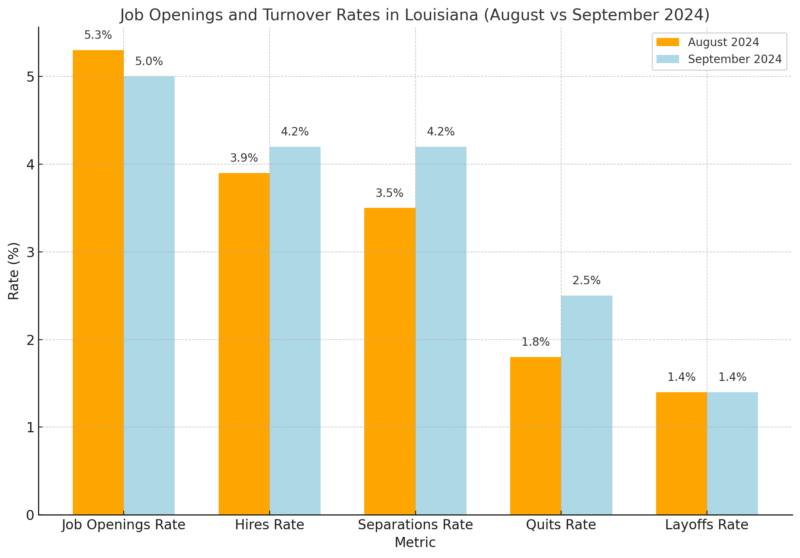
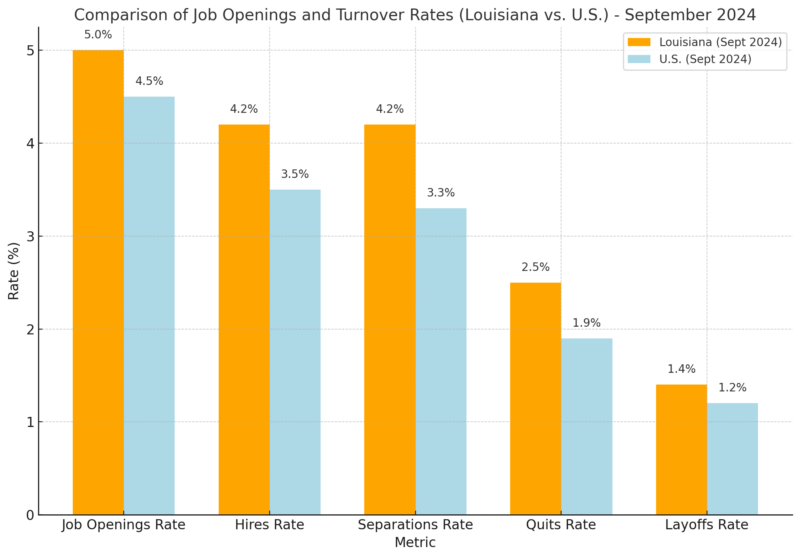
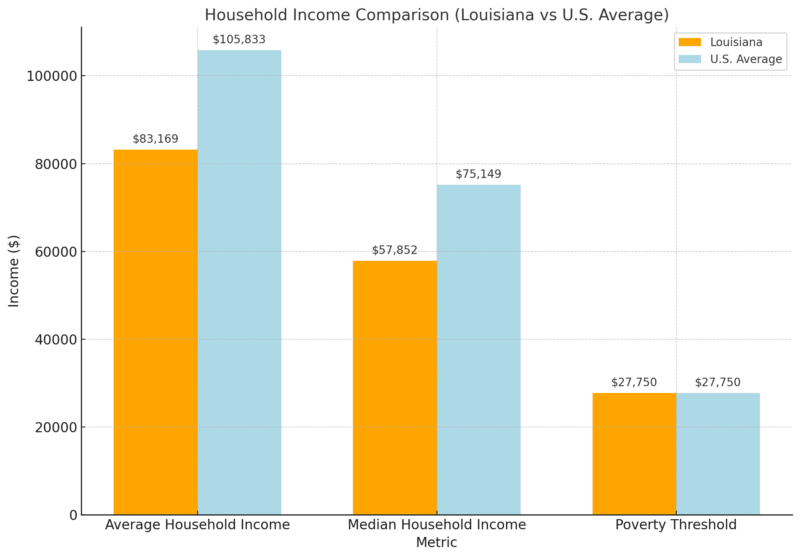
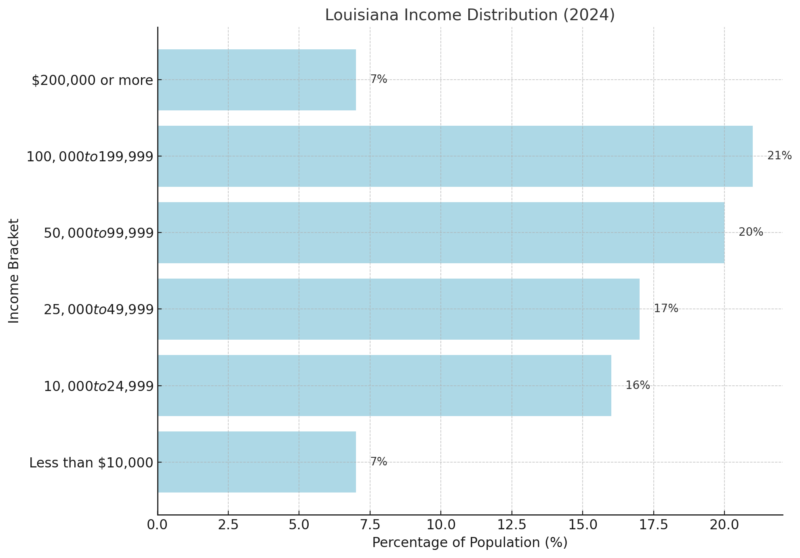
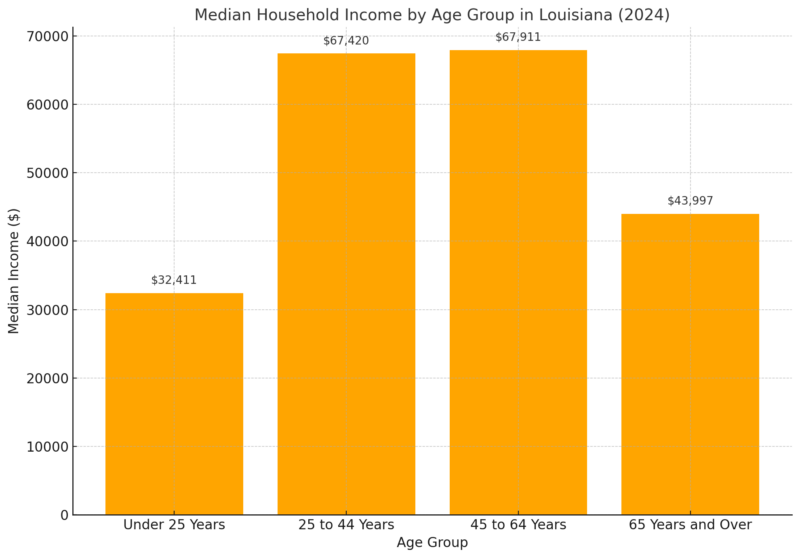
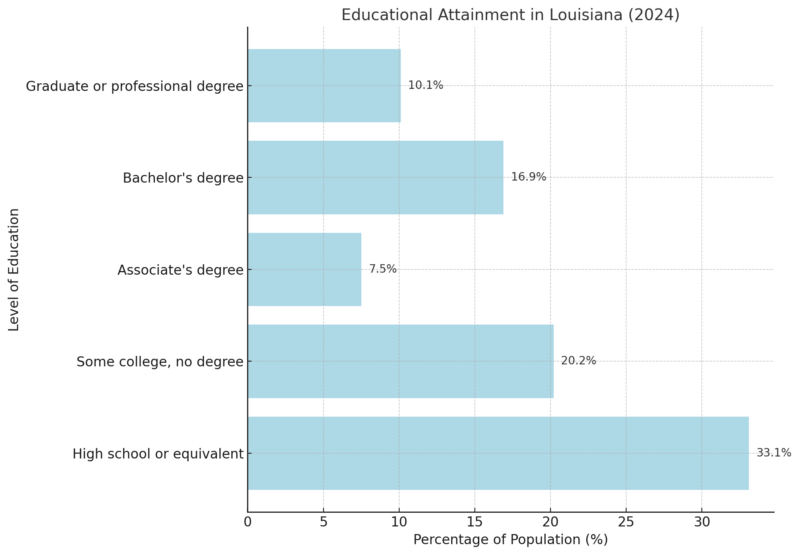
WPR notes that Louisiana has 64 parishes, with East Baton Rouge Parish being the most populous (440,956) and Tensas Parish the least (4,462). Since 2010, Orleans Parish experienced significant growth (12.43%), while Caddo Parish declined (-4.96%). St. Bernard Parish leads in growth with a 26.88% increase, while Tensas Parish saw the steepest decline (-14.7%). Many smaller parishes, including Cameron and East Carroll, have populations below 10,000, with most experiencing population decreases. Louisiana hosts a diverse and significant immigrant population, with 4.2% of the state’s residents being foreign-born and 1.8% of U.S.-born residents living with at least one immigrant parent according to the American Immigration Council. Immigrants play a vital role in the state’s economy, making up 5.3% of the labor force and contributing extensively as entrepreneurs, STEM workers, and in construction, where they represent 13.5% of the workforce. They also account for 10.7% of entrepreneurs, generating $613.6 million in business income. Immigrant households hold a combined income of $6.3 billion, with $4.8 billion in spending power, demonstrating their significant economic influence. They contribute $1.5 billion in taxes, supporting essential programs like Social Security and Medicare. These figures emphasize that immigrant contributions far outweigh any costs associated with public services they use. Immigrants are key contributors to Louisiana’s workforce, making up 5.3% overall. Their entrepreneurial spirit is evident, with 10.7% of entrepreneurs being foreign-born, generating $613.6 million in business income. They are especially prominent in STEM fields and construction, where they represent 8.3% and 13.5% of workers, respectively. Immigrants in Louisiana predominantly come from Honduras (18.9%), Mexico (12.4%), and Vietnam (8.4%), reflecting a blend of Central American and Asian influences. This diversity enriches the state’s cultural and economic landscape, fostering global connections and contributions to various industries. Louisiana had 104,000 job openings in September, down 6,000 from August. Hires increased by 6,000 to 83,000, while total separations rose sharply to 82,000 according to BLS. Quits saw a significant rise of 13,000, indicating higher voluntary turnover, while layoffs remained steady. The job openings rate declined slightly to 5.0%, aligning with reduced openings. Meanwhile, the hiring rate increased to 4.2%, and the separations rate rose sharply. The increase in the quits rate suggests growing confidence in job opportunities despite the slight cooling in openings. Louisiana’s labor market remains tighter than the national average, with a higher job openings rate (5.0% vs. 4.5%) and hires rate (4.2% vs. 3.5%). The quits rate is also higher, reflecting a more dynamic labor market in Louisiana compared to the U.S. average. Over the past year, Louisiana’s labor market has seen consistent activity with hires averaging 84,000 per month and separations at 82,000 Quits averaged 52,000, with a range from 36,000 to 59,000, indicating fluctuating voluntary turnover. Layoffs remained stable, suggesting consistent employer retention strategies. Louisiana’s average household income is 21% lower than the national average, and the median household income lags by 23% as per Income By Zip Code. These gaps reflect a state economy that faces challenges in matching national income levels, though the poverty threshold remains consistent. Family incomes are significantly higher than single-person households, which average $32,981 annually. Retirement income, averaging $48,352, is a mix of Social Security and pensions, highlighting the financial challenges faced by retirees compared to working households. The wealthiest zip code, 70124, boasts an average household income of $166,557. These affluent areas reflect pockets of economic prosperity that contrast sharply with statewide income averages. Income distribution in Louisiana reveals a concentration of households earning between $50,000 and $199,999 (41%), while 16% of households earn below $25,000. This underscores significant income disparities within the state. Median income peaks between ages 25 and 64, reflecting career maturity and higher earning potential. It declines for those under 25 and over 65, illustrating the economic impact of early career challenges and retirement. As BLS notes the civilian labor force in Louisiana remained relatively stable from May to October 2024, fluctuating slightly between 2,073,000 and 2,076,800. Employment followed a similar pattern, peaking in August at 1,995,700 before declining slightly to 1,987,800 in October. The unemployment rate remained consistent at 3.9% from July through September but rose back to 4.1% in October, aligning with an increase in the number of unemployed individuals (85,200). These trends indicate a stable but slightly tightening labor market as employment figures dipped marginally toward the end of the observed period. In Louisiana, 27% of residents aged 25 and older hold a bachelor’s degree or higher, significantly below the national average of 36.2% as per notes from the Census Bureau. The majority of residents have attained a high school diploma (33.1%) or some college education without earning a degree (20.2%). These figures highlight a gap in higher education attainment compared to national standards. School enrollment in Louisiana shows a higher percentage (69.6%) of residents enrolled in K-12 education compared to the national average of 67.8%. However, participation in graduate or professional programs (4.4%) and undergraduate college enrollment (19.0%) indicate potential areas for educational investment to align more closely with national trends. These figures reflect a strong focus on early education but highlight challenges in higher education access and attainment.
Parish Name
Population
Parish Name
Population
East Baton Rouge Parish
446,843
Avoyelles Parish
38,101
Jefferson Parish
417,524
Beauregard Parish
37,030
Orleans Parish
358,355
Natchitoches Parish
35,934
St. Tammany Parish
277,929
Webster Parish
34,949
Lafayette Parish
251,786
Evangeline Parish
31,475
Caddo Parish
223,838
Jefferson Davis Parish
31,177
Calcasieu Parish
205,234
Iberville Parish
29,621
Ouachita Parish
157,432
West Baton Rouge Parish
28,498
Livingston Parish
152,234
De Soto Parish
27,372
Tangipahoa Parish
139,329
Morehouse Parish
23,496
Ascension Parish
132,779
Plaquemines Parish
22,154
Bossier Parish
130,437
Allen Parish
21,937
Rapides Parish
125,492
Sabine Parish
21,838
Terrebonne Parish
102,600
Grant Parish
21,782
Lafourche Parish
94,361
Union Parish
20,571
St. Landry Parish
81,249
Assumption Parish
19,857
Iberia Parish
66,998
Pointe Coupee Parish
19,788
Vermilion Parish
57,031
Richland Parish
19,640
Acadia Parish
56,253
East Feliciana Parish
19,250
St. Martin Parish
50,865
Franklin Parish
19,212
St. Charles Parish
50,182
St. James Parish
18,994
Lincoln Parish
47,944
Concordia Parish
17,350
St. Mary Parish
46,291
West Feliciana Parish
15,346
Vernon Parish
45,630
LaSalle Parish
14,779
Washington Parish
44,739
Jackson Parish
14,676
St. Bernard Parish
44,507
Claiborne Parish
13,491
St. John the Baptist Parish
39,229
Winn Parish
13,181
Avoyelles Parish
38,101
Bienville Parish
12,120
Beauregard Parish
37,030
St. Helena Parish
10,759
Natchitoches Parish
35,934
Caldwell Parish
9,285
Webster Parish
34,949
West Carroll Parish
9,165
Evangeline Parish
31,475
Madison Parish
9,012
Jefferson Davis Parish
31,177
Catahoula Parish
8,224
Iberville Parish
29,621
Red River Parish
7,247
West Baton Rouge Parish
28,498
East Carroll Parish
6,719
De Soto Parish
27,372
Cameron Parish
4,640
Morehouse Parish
23,496
Tensas Parish
3,714
Migration Patterns
Metric
Value
Immigrant Share of Population
4.2%
Immigrant Residents
191,500
U.S.-Born Residents with Immigrant Parents
1.8%
Immigrant Women
47.8%
Immigrant Men
52.2%
Immigrant Children
16,600
U.S.-Born Residents with Immigrant Parents
79,400
English Proficiency among Immigrants
71.8%
Immigrant Economic Contributions
Immigrant Workforce Participation
Top Countries of Origin for Immigrants
Louisiana Labor Market Overview
Job Openings and Turnover Rates in Louisiana
Comparison of Job Openings and Turnover Rates (Louisiana vs. U.S.)
Hires and Separations in Louisiana (Monthly Averages Over Last 12 Months)
Metric
Average (000s)
Range (000s)
Hires
84
77 – 92
Total Separations
82
68 – 89
Quits
52
36 – 59
Layoffs & Discharges
25
20 – 28
Household Income
Income by Household Types
Income Type
Average Income
Median Income
Household Income
$83,169
$57,852
Family Income
$99,418
$74,911
Single-Person Household
$32,981
$29,169
Retirement Income
$48,352
N/A
Richest Zip Codes in Louisiana (2025)
Rank
Zip Code
Population
Mean Income
Median Income
1
70124
20,212
$166,557
$113,525
2
70030
3,820
$152,809
$91,574
3
70783
2,290
$149,372
$112,083
4
70503
29,469
$148,122
$90,286
5
70447
17,400
$143,692
$120,305
Louisiana Income Distribution
Median Household Income by Age Group
Labor Force Data (in thousands)
Data Series
May 2024
June 2024
July 2024
August 2024
September 2024
October 2024(p)
Civilian Labor Force
2,076.8
2,075.0
2,075.6
2,076.2
2,075.1
2,073.0
Employment
1,990.7
1,992.0
1,994.4
1,995.7
1,993.6
1,987.8
Unemployment
86.1
83.1
81.2
80.5
81.5
85.2
Educational Attainment
School Enrollment (Population 3 Years and Older)
Educational Level
Louisiana (%)
United States (%)
Nursery school, preschool
7.1
–
Kindergarten to 12th grade
69.6 ± 0.7
67.8 ± 0.1
College, undergraduate
19.0
–
Graduate or professional school
4.4
–
Health Stats
Metric
Louisiana
United States
Disabled Population (%)
17.2 ± 0.4
13.6 ± 0.1
Hearing Difficulty (%)
4.6
–
Vision Difficulty (%)
3.9
–
Cognitive Difficulty (%)
7.5
–
Ambulatory Difficulty (%)
8.8
–
Self-Care Difficulty (%)
3.1
–
Independent Living Difficulty (%)
7.2
–
Women 15-50 Years Old (Count)
1,064,921 ± 6,294
77,984,030 ± 34,163
Women with Births (15-19 years)
2,125
–
Women with Births (20-34 years)
45,720
–
Women with Births (35-50 years)
11,354
–
Census.gov notes that Louisiana has a higher disabled population (17.2%) compared to the national average (13.6%).
Among disabilities, ambulatory and cognitive difficulties are most prevalent. In terms of fertility, the majority of women giving birth are in the 20-34 age range, highlighting this as the prime childbearing period.
Health Insurance Coverage in Louisiana (2023)
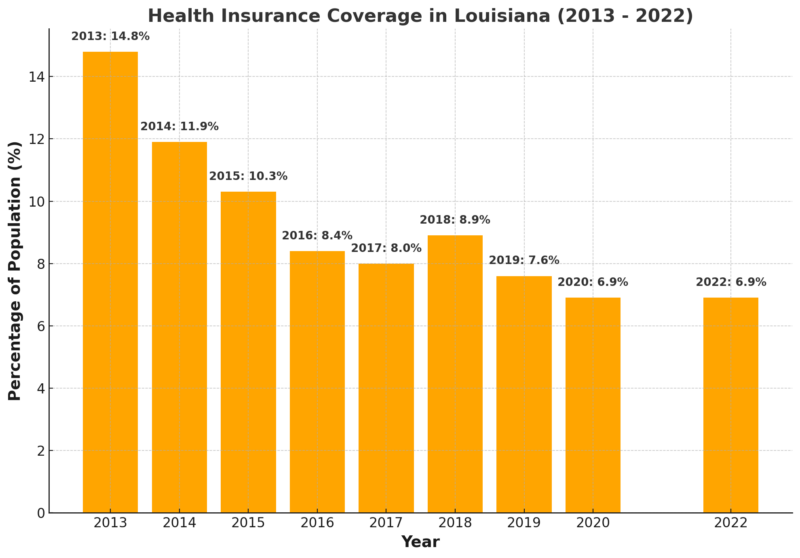
Louisiana has a lower percentage of uninsured residents (6.9%) than the national average (7.9%). Over the last decade, the uninsured rate in the state has significantly declined, reflecting improved access to health care.
Metric
Louisiana (%)
United States (%)
Without Health Care Coverage
6.9 ± 0.3
7.9 ± 0.1
Crime Rates in Louisiana
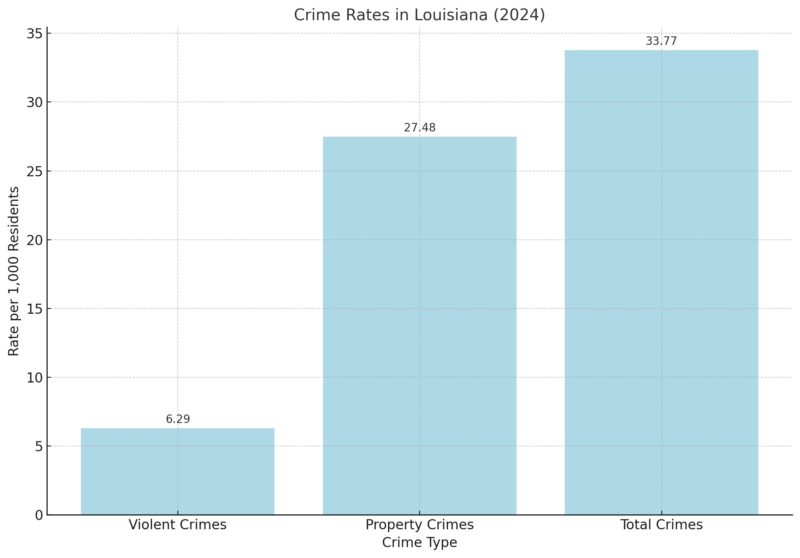
Louisiana reports a total crime rate of 33.77 per 1,000 residents, with property crimes dominating at 27.48 incidents per 1,000 according to the Neighborhood Scout.
Violent crimes occur at a rate of 6.29 per 1,000, indicating that while property crimes are significantly more common, violent crimes remain a notable concern.
This crime rate is reflective of Louisiana’s challenges in addressing public safety across its communities.
Violent Crime Breakdown (Louisiana vs. U.S.)
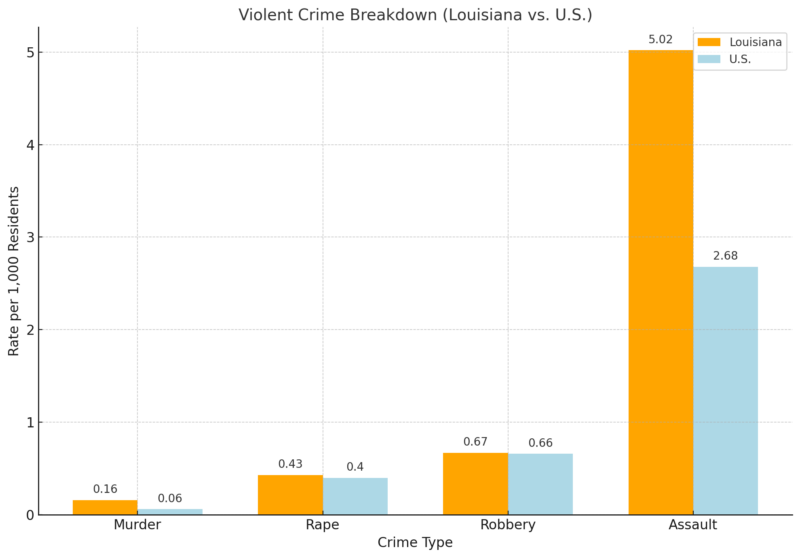
Louisiana’s violent crime rates exceed national averages in every category, particularly in assault, which occurs at a rate of 5.02 per 1,000 compared to the U.S. rate of 2.68. While murder and robbery rates are also higher than the national averages, the disparity in assault rates highlights an area for targeted intervention and law enforcement focus.
Property Crime Breakdown (Louisiana vs. U.S.)
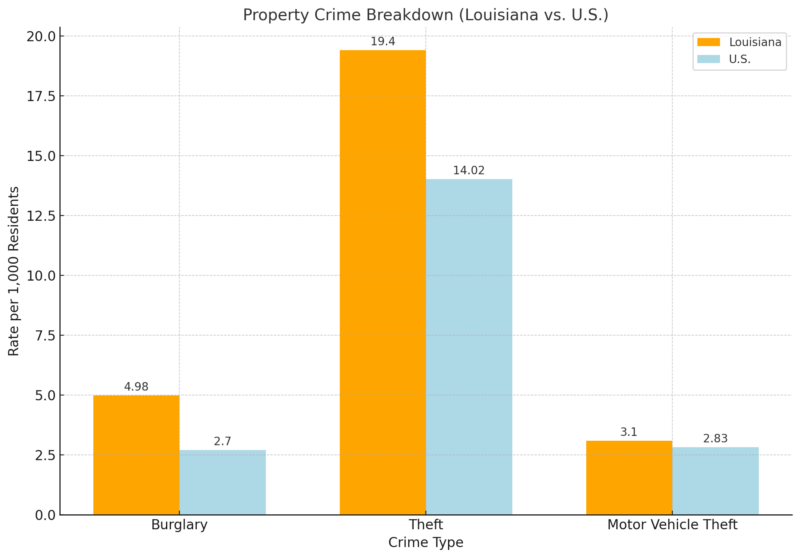
Property crime rates in Louisiana are considerably higher than national averages, particularly in theft, which occurs at a rate of 19.40 per 1,000 residents compared to the U.S. rate of 14.02.
Burglary rates are nearly double the national average, suggesting significant vulnerabilities in residential and commercial property security. Motor vehicle theft is slightly above the national rate, adding to the property crime burden.
Crime Victimization and Geographic Distribution
Metric
Louisiana
Chance of Violent Crime Victimization
1 in 159
Chance of Property Crime Victimization
1 in 36
Crimes Per Square Mile
Higher in urban areas like New Orleans, Baton Rouge
In Louisiana, residents face a 1 in 159 chance of becoming a victim of violent crime and a much higher 1 in 36 chance for property crimes. Urban areas such as New Orleans and Baton Rouge report higher crime rates per square mile, emphasizing the need for enhanced urban policing and community safety initiatives to address the concentration of crime in these regions.
Methodology
This article was crafted using a variety of data sources, including the U.S. Census Bureau, the World Population Review, and other reputable databases like the Bureau of Labor Statistics and the American Community Survey.
We gathered demographic, economic, educational, and crime data to provide a comprehensive overview of Louisiana in 2025.
The analysis focused on comparing state and national averages to highlight significant trends and disparities.
Key statistics on population, income, crime rates, and labor market performance were synthesized to give readers an insightful snapshot of Louisiana’s current state.
The article also integrates migration and health statistics to reflect the diverse social landscape of Louisiana.
References
- World Population Review – Louisiana Population 2024
- Neilsberg – Louisiana Population by Age
- American Immigration Council – Louisiana Immigration Data
- Bureau of Labor Statistics – Job Openings and Labor Turnover in Louisiana
- Income By Zip Code – Louisiana Income by Zip Code
- Census Bureau – Louisiana Education and Health Data
- Neighborhood Scout – Louisiana Crime Data
- Census Bureau – Louisiana Health Insurance Coverage Data
Related Posts:
- North Dakota’s Population Data in 2025 - Key…
- New York City Population 2025 - Key Trends and Forecasts
- Arizona Population Statistics 2025 - 12 Key Data and…
- Oregon Population in 2025 - Key Insights and Data
- Tennessee’s Population Growth in 2025 - Key Insights…
- Wisconsin’s Population Data in 2025 - Key Insights…


