

The estimated population of Tennessee in 2026 is 7.38 million. This figure is based on the latest official count and the most recent annual increase.
The U.S. Census Bureau placed the population of Tennessee at 7,315,076 on July 1, 2025. The state gained 63,785 residents during the previous year. Extending that increase into 2026 produces an estimated total of 7,378,861, rounded to 7.38 million.
The population of Tennessee has increased by 5.8% since the 2020 census, when 6,910,840 people lived in the state. More than 400,000 residents have been added in five years, with recent growth driven mainly by people moving from other parts of the United States.
Other projections, including those published by World Population Review, also place the total above 7.3 million.
Tennessee shares a border with eight states. Kentucky lies to the north and Virginia to the northeast. North Carolina is to the east. The southern border runs alongside Georgia, Alabama and Mississippi. Arkansas and Missouri are across the Mississippi River to the west.
Key Takeaways
- Population in 2026: An estimated 7.38 million.
- Latest official count: 7,315,076 on July 1, 2025.
- Growth since 2020: 5.8%, or more than 400,000 residents.
- Main source of growth: Migration from other U.S. states.
- Largest numerical gains: Davidson, Rutherford and Wilson counties.
- Median household income: $69,595.
- Unemployment rate: 3.6% in May 2026.
- Median home sale price: $383,637 in May 2026.
- Foreign-born residents: 6.1% of the population.
The Population of Tennessee Is Growing
Domestic migration remains the main reason for the increase. The Tennessee State Data Center reported that net movement from other states added 42,389 residents during the latest annual period. That accounted for about two-thirds of the total gain.
Tennessee does not tax income earned from wages, and housing remains less expensive than in many coastal states. Employment has also expanded around Nashville, Knoxville, Chattanooga, Clarksville and Murfreesboro.
Growth slowed from the record increase of more than 98,000 residents recorded one year earlier. Even so, Tennessee had the eighth-largest numerical population gain among the states during the latest official period.
The statewide total hides a regional divide. Middle Tennessee and much of East Tennessee continue to gain residents, while several western and rural counties are growing slowly or losing people.
Population by Age, Gender and Race
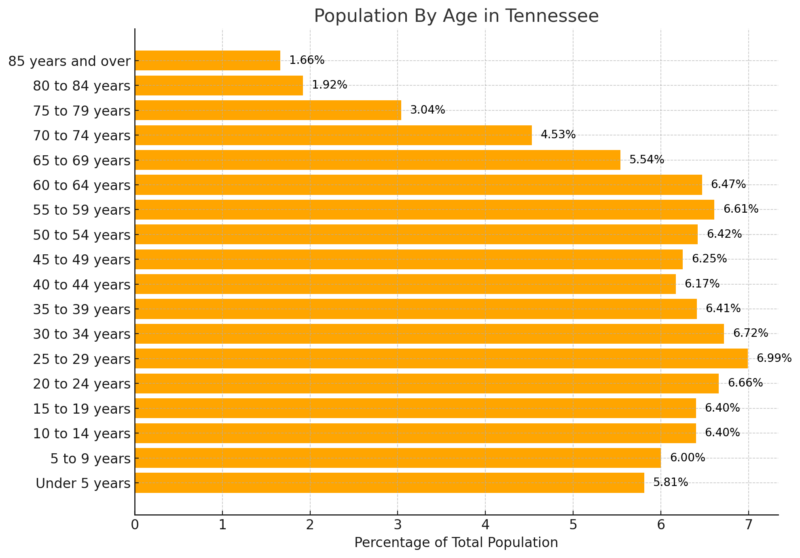
The median age is close to 39 years. Historical figures in the population-by-age profile show a large working-age population alongside a steadily increasing number of older residents.
The latest Census figures show that 21.5% of residents are younger than 18, while 18.6% are 65 or older. Children younger than five account for 5.8%.
The growing senior population will place more demand on healthcare, transportation and accessible housing. The pressure is strongest in rural communities where many younger adults leave for larger employment centers.
Population by Age Cohort
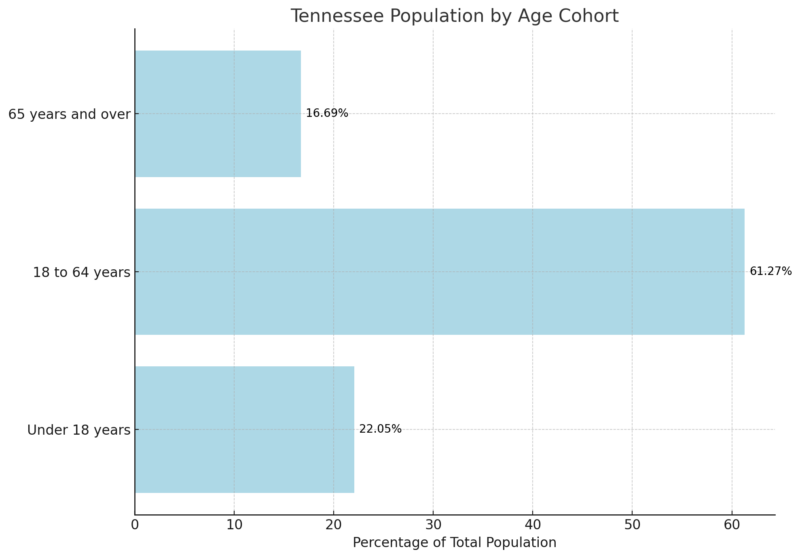
Adults between 18 and 64 remain the largest part of the population of Tennessee. Counties attracting young workers and families, including Rutherford, Montgomery, Davidson and Williamson, have a younger profile than many rural counties.
Population by Gender
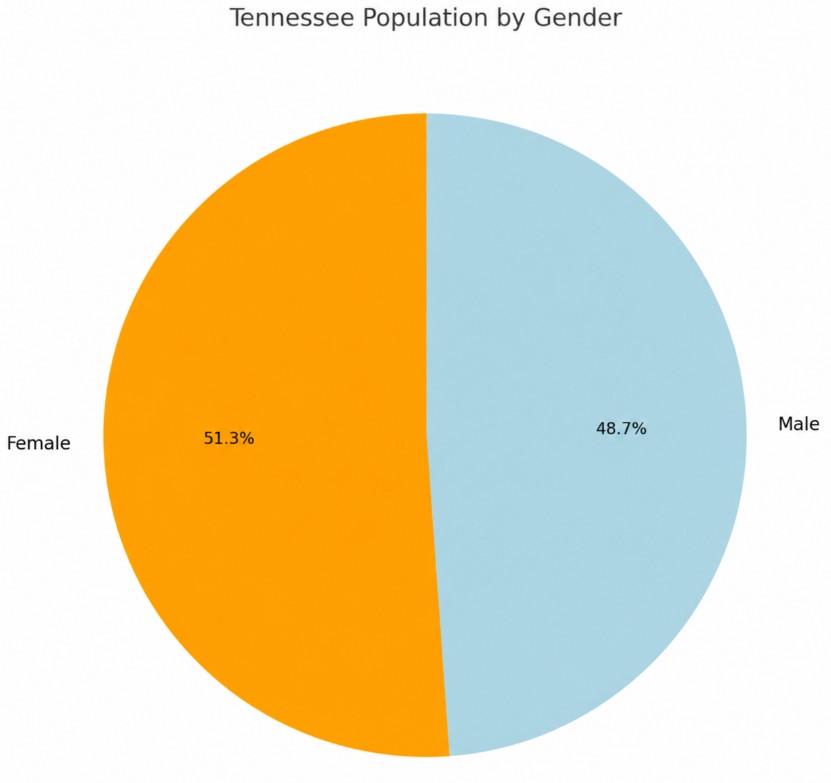
Women account for 51.3% of the population of Tennessee, while men account for 48.7%. Earlier estimates show the same pattern in the state gender profile.
Population by Race and Ethnicity
| Race or Ethnicity | Share |
|---|---|
| White alone | 76.7% |
| Black or African American alone | 15.7% |
| Asian alone | 2.4% |
| American Indian or Alaska Native alone | 0.9% |
| Native Hawaiian or Other Pacific Islander alone | 0.1% |
| Two or more races | 4.2% |
| Hispanic or Latino, of any race | 8.6% |
| White alone, not Hispanic or Latino | 70.0% |
Hispanic or Latino residents may identify with any racial group, so the Hispanic percentage should not be added to the racial categories. Historical comparisons are available in the race and population figures for Tennessee.
Where Population Growth Is Happening
Growth is concentrated around Nashville and in selected parts of East Tennessee. During the latest annual period, 81 of the state’s 95 counties gained residents.
Davidson County recorded the largest numerical increase, adding 9,281 residents and reaching 745,904. Rutherford County gained 6,266, while Wilson County added 4,693.
Domestic migration was positive in 87 counties. Shelby County recorded the largest domestic migration loss, with 11,670 more residents leaving for other parts of the country than arriving.
Most Populous Counties
| Rank | County | Population | Recent Direction |
|---|---|---|---|
| 1 | Shelby | 910,226 | Declining slightly |
| 2 | Davidson | 745,904 | Growing |
| 3 | Knox | 511,453 | Growing |
| 4 | Hamilton | 390,833 | Growing |
| 5 | Rutherford | 386,352 | Growing quickly |
| 6 | Williamson | 272,061 | Growing |
| 7 | Montgomery | 249,935 | Growing |
| 8 | Sumner | 215,538 | Growing |
| 9 | Wilson | 175,033 | Growing quickly |
| 10 | Sullivan | 163,759 | Mostly stable |
Additional figures are available in the county population tables for Tennessee. This movement also forms part of the national trend covered in our report on population growth across the United States.
Job Market in Tennessee
The Bureau of Labor Statistics reported an unemployment rate of 3.6% in May 2026. The civilian labor force contained 3.50 million people, including 3.37 million employed residents and 126,100 unemployed residents.
Healthcare, manufacturing, construction, logistics, tourism and professional services remain major sources of employment. The automotive industry also has a large presence through Nissan, Volkswagen, General Motors and their suppliers.
The job market in TennesseeAn earlier BLS job-openings report counted 167,000 vacancies in August 2024. These charts preserve that earlier labor-market snapshot for comparison.
Nearly two-thirds of Tennessee counties saw lower unemployment rates in October! ✨LEARN MORE: https://t.co/LaEHX9h716 #EconomicGrowth
— TN Dept of Labor & Workforce (@Jobs4_TN) November 21, 2024
Income in Tennessee
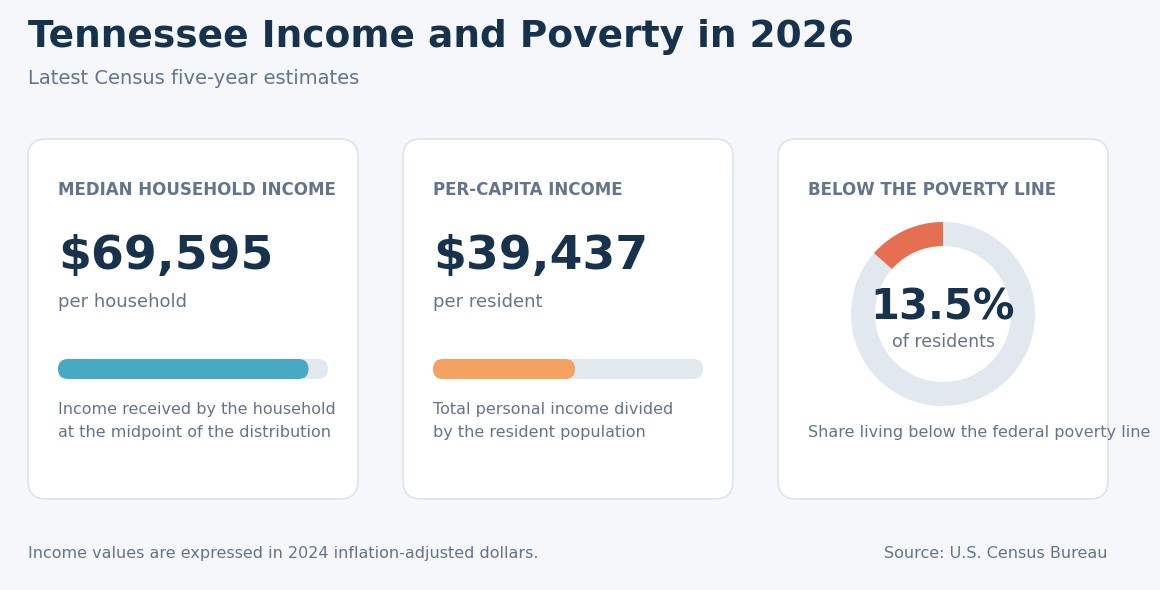
The median household income is $69,595, based on the latest Census five-year figures expressed in 2024 dollars. Per-capita income is $39,437, while 13.5% of residents live below the federal poverty line.
ZIP-level figures from Income By Zip Code show high household incomes in Lookout Mountain, Germantown, Brentwood and affluent parts of Nashville. The highest listed mean incomes range from $187,394 to $289,852.
The gap between average and median pay reflects wide differences among occupations. Healthcare, management, technology and specialist manufacturing often pay far more than retail, hospitality and personal services.
Families with two earners generally report much higher income than single-person households. The difference has become more important as rent, insurance, food and childcare consume a larger share of household budgets.
Housing Market in Tennessee
Redfin reported a median sale price of $383,637 in May 2026, up 1% from the previous year. A total of 8,421 homes were sold, an annual increase of 9.1%.
| Metric | May 2026 | Annual Change |
|---|---|---|
| Median sale price | $383,637 | +1.0% |
| Homes sold | 8,421 | +9.1% |
| Median days on market | 69 | +6 days |
| Homes for sale | 50,756 | +8.9% |
| New listings | 11,112 | +2.2% |
| Months of supply | 5 | No change |
| Sold above list price | 14.1% | Down slightly |
| Sale-to-list ratio | 97.3% | Down slightly |
Inventory increased, giving buyers more choice. Homes took a median of 69 days to sell, and the typical property sold below its final asking price.
Where Sale Prices Are Rising Fastest
Recent Redfin figures show strong price gains in Sevierville, Kingsport, Germantown, Brentwood, La Vergne and Johnson City. Monthly figures can be volatile in smaller markets because relatively few completed sales can produce a large percentage change.
Housing Supply and Demand
Only 14.1% of homes sold above list price in May 2026. Price reductions appeared on 19.2% of listings, while five months of supply moved the market closer to balance. Buyers have more negotiating room than they had during the pandemic buying rush, although mortgage payments remain high.
Immigrant Population in Tennessee
Foreign-born residents account for 6.1% of the population of Tennessee. That represents more than 430,000 people at the current population level.
International migration slowed during the latest annual period, but immigration remains important to long-term workforce growth. Foreign-born residents are concentrated in Nashville, Memphis, Knoxville, Chattanooga and several manufacturing communities.
An earlier detailed profile from the American Immigration Council identified Mexico as the leading country of origin, followed by India, Honduras, China and Egypt.
Citizenship, Language and Education
The American Immigration Council profile found that 40% of immigrants were naturalized citizens and another 60,484 were eligible for naturalization. It also found that 77% spoke English well or very well.
The immigrant population includes both highly educated professionals and workers with limited formal schooling. The earlier profile found that 34% of immigrant adults held a college degree, compared with 27% of U.S.-born adults at the time.
Participation in the Workforce
The detailed workforce profile found that immigrants represented 7% of the labor force. Their presence was especially significant in construction and in life, physical and social science occupations.
Methodology
The 2026 estimate begins with the official Census Bureau total of 7,315,076 for July 1, 2025. The latest annual increase of 63,785 residents was then carried forward for one year, producing 7,378,861.
Population, age, race, sex, income and housing characteristics come from Census Bureau estimates. County changes come from the Tennessee State Data Center’s analysis of Census county estimates. Employment figures come from the Bureau of Labor Statistics, while current housing figures come from Redfin.
References
- U.S. Census Bureau QuickFacts: Tennessee
- World Population Review: Tennessee
- Tennessee State Data Center: County Population Growth
- Tennessee Population by Age
- Tennessee Population by Gender
- Tennessee Population by Race
- Bureau of Labor Statistics: Tennessee Economy at a Glance
- Tennessee Job Openings and Labor Turnover
- Income by ZIP Code: Tennessee
- Redfin: Tennessee Housing Market
- Population of Tennessee Counties
- American Immigration Council: Immigrants in Tennessee