

Nevada population has experienced a steady growth, reaching approximately 3,210,930 people in 2023 according to World Population Review.
This represents an increase of 0.53% from the previous year.
This growth trend continues a pattern observed over the past two decades.
Looking ahead, Nevada population is projected to continue increasing steadily over the next 20 years.
The state demographer’s projections highlight the potential for further changes in Nevada’s demographic landscape, making it an exciting time for residents and stakeholders alike.
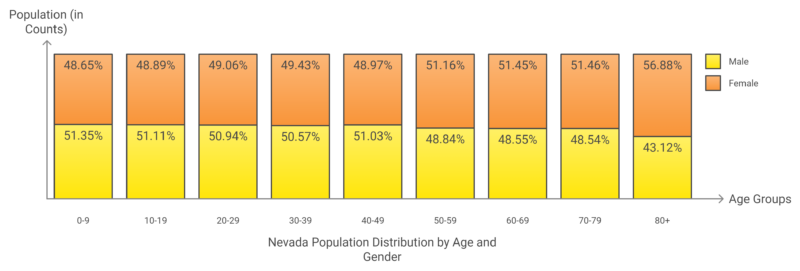
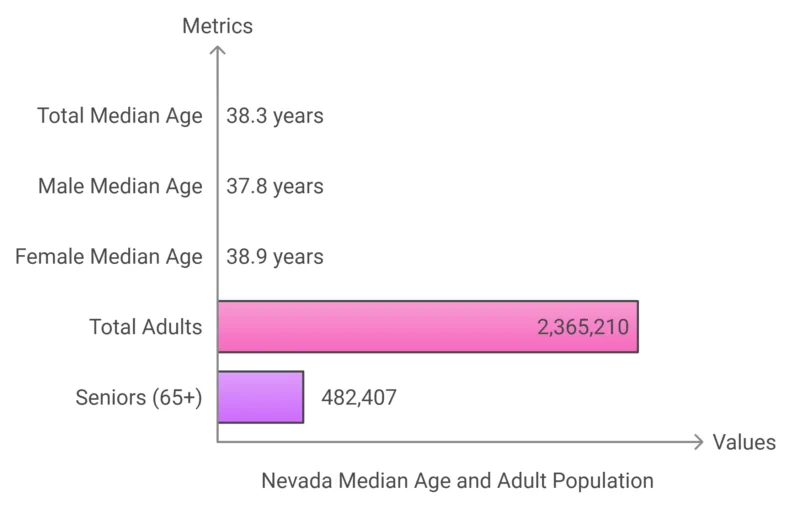
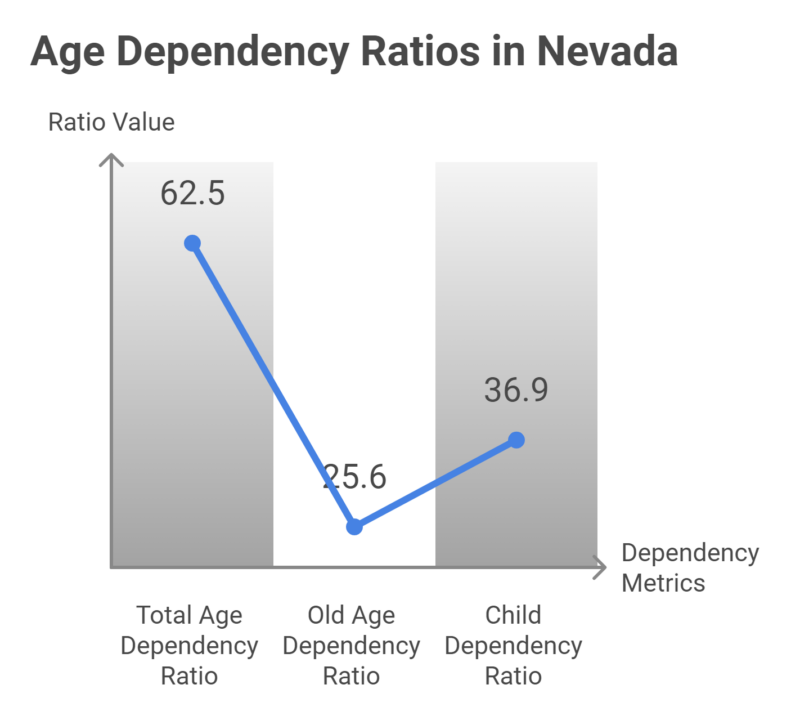
Nevada spans 110,567 square miles, making it the seventh-largest state in the U.S. by land area. Despite its size, Nevada is one of the least densely populated states—only eight states have fewer people per square mile. Much of the population is concentrated in urban areas like Las Vegas and Reno, with rural towns like Ely, West Wendover, and Tonopah sparsely populated. From 2010 to 2015, Nevada experienced one of the highest population growth rates in the nation at 7.05%, placing it 6th in growth. In the 2010 Census, the population was recorded at 2.7 million, a significant 35% increase compared to 2000. By 2012, the U.S. Census Bureau estimated Nevada’s population had grown to 2.76 million, reflecting continued growth. Cultural differences are notable between Nevada’s rural and urban areas. In rural parts of the state, many residents are native Nevadans, whereas cities like Las Vegas and Reno attract people from other states, especially California. Nevada’s male-to-female ratio is nearly balanced, with males accounting for 50.4% and females 49.6% of the total population. The 70+ population shows a higher female proportion, reflecting the tendency for women to live longer than men. Nevada’s median age is 38.3 years, indicating a slightly older population than the national median (around 38 years). A considerable proportion of the population is older, with 482,407 seniors, underscoring the need for healthcare and retirement services. The total age dependency ratio of 62.5 means that for every 100 working-age individuals (15-64 years), there are 62.5 dependents (children and seniors combined). A higher child dependency ratio (36.9) indicates a relatively young population, despite the growing number of seniors. Demographics.com notes that Clark County, home to Las Vegas, dominates with a population of 2,336,573, accounting for more than two-thirds of the state’s total population. Washoe County (Reno area) is the second-largest, with 498,022 residents, making it a significant population center in Northern Nevada. Lyon County, Carson City, and Nye County follow, each with populations between 50,000 and 60,000, reflecting medium-sized rural or suburban communities. The least populated county is Esmeralda County, with just 736 residents, highlighting Nevada’s stark urban-rural divide. On Jul 25, 2000, the Las Vegas Sun reported that Nevada’s population surpassed two million for the first time, estimated as 2,059,433 at Jul 1, 2000. https://t.co/46eB0SEdcv — HISTORY:nevada (@HistoryNevada) July 26, 2024 Nevada’s population is projected to steadily increase over the next two decades, with significant growth concentrated in its urban centers. The state is forecasted to grow from 3.3 million in 2025 to 3.94 million by 2043, reflecting a total increase of about 20% over this period according to government projections. This moderated yet consistent growth reflects Nevada’s appeal driven by economic opportunities, but challenges such as housing availability and economic uncertainties may limit future growth rates. Nevada ranks 22nd nationally for average teacher salaries at $61,719, but teacher starting salaries remain modest at $43,695. Teacher unions and educational stakeholders continue to advocate for higher pay, especially in a state with rising living costs (minimum living wage is estimated at $70,934 for an adult with one child). Although some progress has been made, per-student spending ($11,516) places Nevada near the bottom of national rankings, indicating a funding shortfall compared to other states. This financial disparity affects resources, class sizes, and extracurricular activities as per the Nevada Education Department.Key Takeaways
Population Size and Density
By Age and Gender
Nevada Median Age and Adult Population
Age Dependency Ratios in Nevada
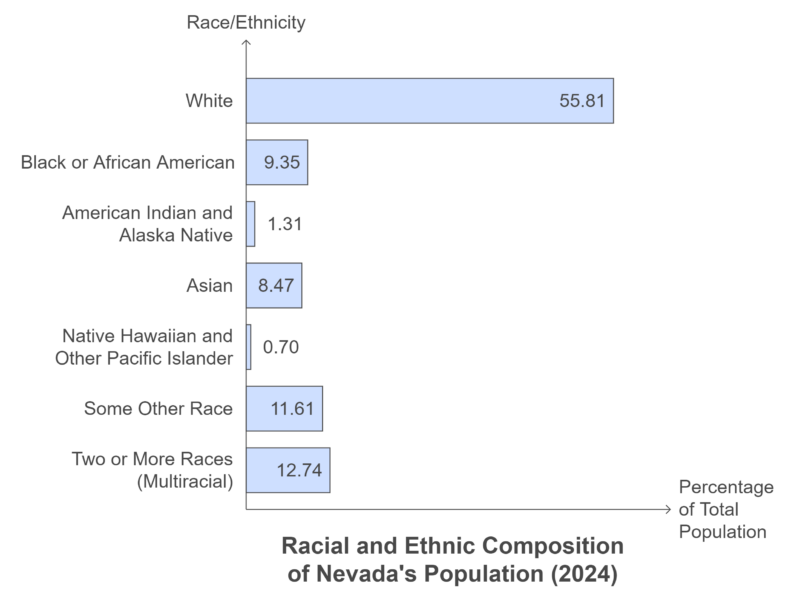
Population by Race (2024)
Population by County
Rank
County
Population
1
Clark County
2,336,573
2
Washoe County
498,022
3
Lyon County
62,583
4
Carson City/County
58,036
5
Nye County
55,720
6
Elko County
54,293
7
Douglas County
49,545
8
Churchill County
25,803
9
Humboldt County
17,136
10
White Pine County
8,522
11
Pershing County
6,364
12
Lander County
5,769
13
Mineral County
4,528
14
Lincoln County
4,452
15
Storey County
4,177
16
Eureka County
1,917
17
Esmeralda County
736
Historical Growth
Projected Growth
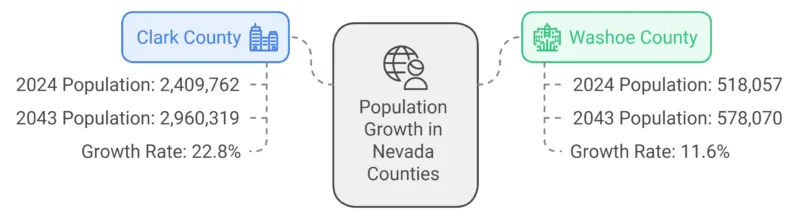
Projected Statewide Growth
Urban Concentration – Clark and Washoe Counties Lead the Growth
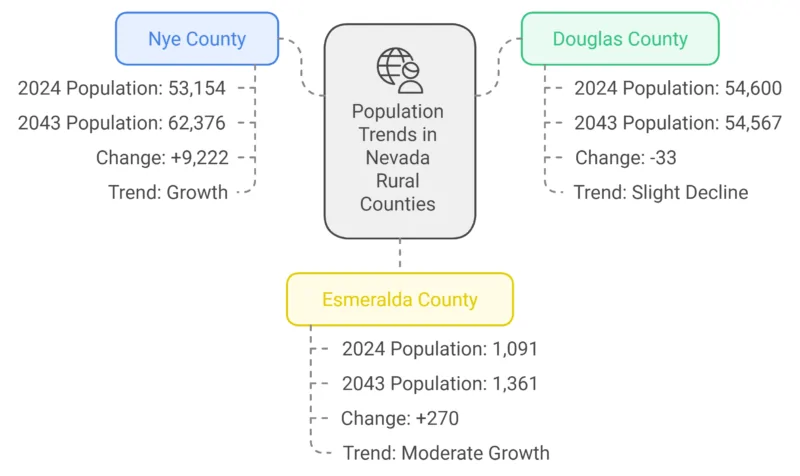
Rural Counties – Slower Growth or Decline
Drivers of Growth and Risks
Education Levels
Metric
Statistic
National Ranking
Per Student Spending
$11,516
47th
Average Teacher Salary
$61,719
22nd
Average Starting Teacher Salary
$43,695
30th
High School Graduation Rate (2023-24)*
~84% (est.)
Not available
Education Support Professional (ESP) Pay
$36,900
47th
Higher Ed Faculty Salary
$95,353
14th
Teacher Salaries and Funding Deficit
Graduation Rates and Educational Support
Nevada’s high school graduation rate stands at approximately 84%, with significant variations across counties. The state places heavy emphasis on career and technical education (CTE) programs to support workforce development, focusing on skills needed for industries such as manufacturing, healthcare, and technology as per NEA.
Additionally, higher education institutions are implementing dual-enrollment programs to give high school students early access to college courses. This initiative helps improve college readiness and retention, especially for students from disadvantaged backgrounds.
Challenges in Education
Nevada struggles with teacher shortages, leaving nearly 3,000 positions vacant across school districts. The state has also adopted co-requisite models in higher education, enabling students to take college-level courses with embedded remedial support, which has improved student success rates.
Income Statistics
Metric
Nevada
US Average
Difference
Average Household Income
$97,955
$105,833
7% lower
Median Household Income
$71,646
$75,149
5% lower
Poverty Line (for a household)
$27,750
$27,750
–
Average Family Income
$112,119
Not provided
–
Median Family Income
$85,584
Not provided
–
Average Salary (Full-Time Workers)
$70,248
Not provided
–
Median Salary (Full-Time Workers)
$51,279
Not provided
–
Per Capita Income
$37,945
Not provided
–
Nevada’s average household income in 2024 stands at $97,955, which is 7% below the national average of $105,833. Similarly, the median household income in Nevada is $71,646, falling 5% short of the national median.
With the poverty threshold set at $27,750, Nevada’s income structure reveals a gap between average incomes and affordability, especially in areas with high living costs.
Family incomes, typically higher than individual household incomes, show an average of $112,119 and a median of $85,584, reflecting the contribution of multiple earners. Full-time workers in Nevada earn an average of $70,248, and the median salary is $51,279, emphasizing disparities within wage distributions as it is noted by Income By Zip Code.
Income Distribution in Nevada Households (2025)
Income Range
Households
Percentage of Total Households
Less than $10,000
62,807
5%
$10,000 to $14,999
35,920
3%
$15,000 to $19,999
36,053
3%
$20,000 to $24,999
43,688
4%
$25,000 to $29,999
43,927
4%
$30,000 to $34,999
45,716
4%
$35,000 to $39,999
43,242
4%
$40,000 to $44,999
44,981
4%
$45,000 to $49,999
46,044
4%
$50,000 to $59,999
86,336
7%
$60,000 to $74,999
116,266
10%
$75,000 to $99,999
158,653
14%
$100,000 to $124,999
119,698
10%
$125,000 to $149,999
83,601
7%
$150,000 to $199,999
95,832
8%
$200,000 or more
100,907
9%
Total Households
1,163,671
100%
Nevada’s income distribution indicates that about 29% of households earn less than $50,000 annually, with many falling within lower-income brackets.
However, 14% of households earn between $75,000 and $99,999, and nearly 9% report incomes exceeding $200,000.
This diverse income spread suggests both economic opportunities and disparities within the state, where lower-income households may struggle to meet living costs while higher-income households enjoy significant disposable income.
Median Household Income by Age (2024)
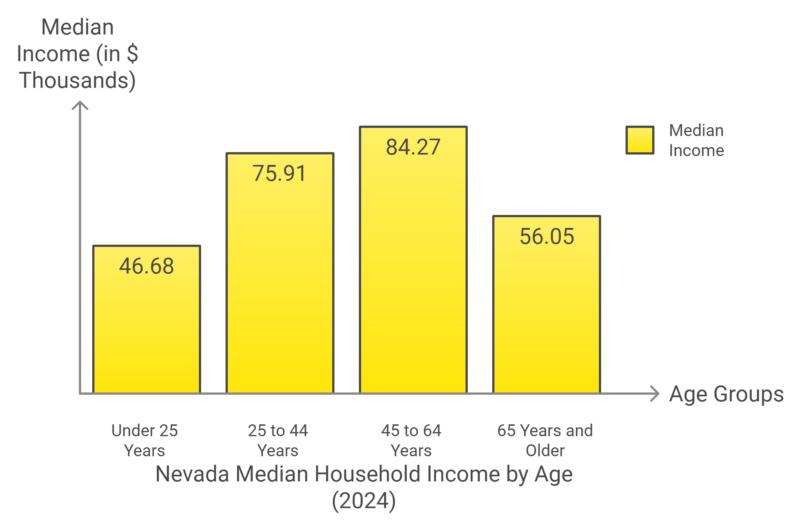
Income levels in Nevada vary substantially with the age of the householder. Householders under 25 years earn a median of $46,679, reflecting entry-level earnings and limited career experience.
Median incomes peak between the ages of 45 and 64, at $84,266, during prime earning years.
As residents transition into retirement, incomes drop to a median of $56,049, consistent with national trends where retirement and Social Security benefits replace earned income.
Employment Statistics
Month
Civilian Labor Force (in thousands)
Employment (in thousands)
Unemployment (in thousands)
Unemployment Rate (%)
March 2024
1,614.3
1,531.5
82.8
5.1
April 2024
1,615.4
1,533.3
82.1
5.1
May 2024
1,616.2
1,533.4
82.8
5.1
June 2024
1,617.8
1,533.2
84.7
5.2
July 2024
1,620.4
1,532.3
88.1
5.4
August 2024 (p)
1,620.9
1,531.1
89.7
5.5
BLS notes that Nevada’s civilian labor force expanded steadily from 1,614,300 in March to 1,620,900 by August, suggesting modest growth in the number of individuals actively participating in the workforce.
However, employment levels remained relatively stagnant, fluctuating between 1,531,000 to 1,533,000 workers, indicating a limited capacity for new job creation during this period.
The unemployment rate climbed from 5.1% in March to 5.5% in August, with unemployment peaking at 89,700 individuals. The increase in unemployment during the summer months could be due to seasonal factors or reduced demand across specific industries, such as tourism or hospitality.
These trends reflect a mixed economic environment. While the expanding labor force signals
Migration Patterns
View this post on Instagram
Immigrants form a crucial part of Nevada’s population and economy, contributing significantly as workers, entrepreneurs, and taxpayers. As of 2022, 19.0% of Nevada’s residents are foreign-born, with an additional 12.7% of U.S.-born residents living with at least one immigrant parent as noted by the American Immigration Council.
Category
Statistics
Immigrant Share of Population
19.0%
Total Immigrant Residents
604,100
Immigrant Spending Power
$18.2 billion
Immigrant Taxes Paid (Total)
$5.1 billion
Federal Taxes Paid
$3.7 billion
State & Local Taxes Paid
$1.4 billion
Immigrant Contributions to Social Security
$2.1 billion
Immigrant Contributions to Medicare
$558 million
Age Distribution of Immigrants and U.S.-Born Population
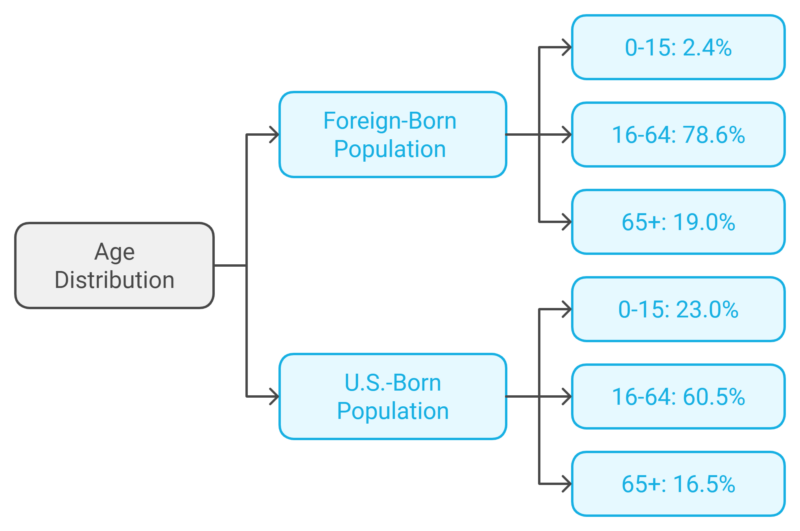
The immigrant population in Nevada skews towards working age, with 78.6% between the ages of 16 to 64, compared to 60.5% for the U.S.-born population.
This demographic advantage allows immigrants to contribute actively to the labor force and the economy, including supporting programs like Social Security and Medicare.
Economic Impact and Entrepreneurship
Immigrants account for 23.6% of the labor force, playing essential roles in sectors like STEM (17.3%), nursing (24.8%), and entrepreneurship (26.8%).
There are 38,200 immigrant entrepreneurs in the state, generating a total business income of $1.2 billion.
Top Countries of Origin for Immigrants in Nevada
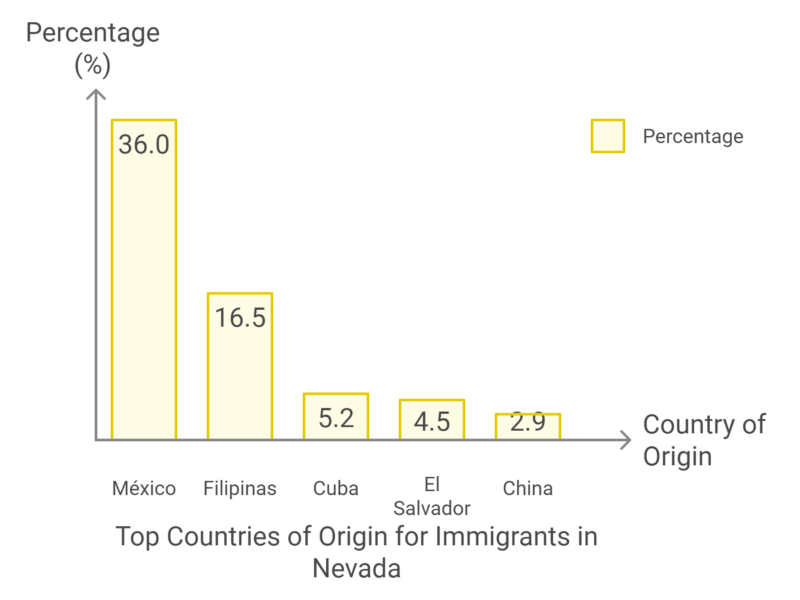
Mexican-born immigrants make up the largest share of Nevada’s immigrant population, followed by individuals from the Philippines, Cuba, and El Salvador.
Contributions to Taxes and Social Programs
Immigrant households earned $23.4 billion in total income in 2024, with a spending power of $18.2 billion. They contributed $3.7 billion in federal taxes and $1.4 billion in state and local taxes, supporting public services like education and healthcare.
In addition, they made significant contributions to Social Security ($2.1 billion) and Medicare ($558 million), further highlighting their importance to the state’s fiscal health.
Housing and Real Estate

Zillow notes that the Nevada housing market in 2025 is marked by increasing home prices and significant challenges in affordability, particularly for low-income residents. The average home price in Nevada rose to $443,203, reflecting a 5.9% year-over-year increase.
This trend is evident across both northern and southern regions, with markets in Reno and Las Vegas seeing rapid appreciation. Las Vegas alone experienced an 18.6% annual increase in home prices by mid-2024, driven by strong demand and limited supply.
Affordability and Cost Burden
Nevada faces a shortage of affordable housing, particularly for extremely low-income (ELI) households. There are 78,000 fewer rental units available than needed to meet the demand from ELI renters.
Approximately 70% of low-income renters spend more than 30% of their income on housing, classifying them as cost-burdened. Moreover, 86% of ELI renters are severely cost-burdened, meaning they spend over 50% of their income on rent, often at the expense of other necessities like food and healthcare.
Factors Influencing the Market
Migration from neighboring states, especially California, has played a significant role in driving up housing prices. New residents often bring higher incomes, making it more challenging for local buyers to compete.
In some cases, homes receive multiple cash offers above the asking price, which further drives the affordability gap. Interest rates, which remain volatile, add another layer of complexity for potential homeowners and renters trying to navigate the market.
Crime Rates in Nevada 2025
Violent Crime (2024 – Nevada)
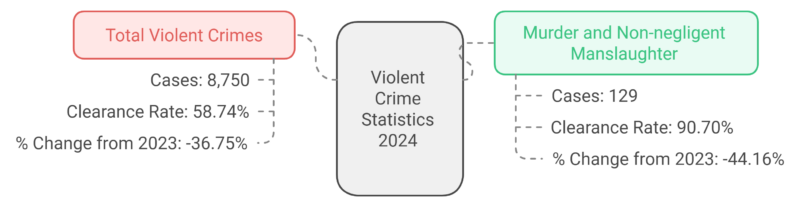
- There is a 36.75% decrease in violent crime compared to 2023, showing a significant improvement.
- Murder and Non-negligent Manslaughter decreased by 44.16%, which is a promising trend, and the clearance rate for these cases is high at 90.70%.
Offenses Breakdown – Violent Crime
Offense
Description
Clearance Rate (%)
Murder
Intentional (non-negligent) killing of another
90.70%
Aggravated Assault
Assault with severe bodily harm
Not specified
Rape
Sexual assault involving force or incapacity
Not specified
Robbery
Theft using force or fear
Not specified
Property Crime (2024 – Nevada)
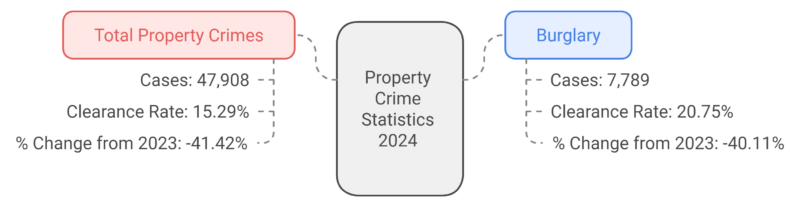
- Property crimes show a 41.42% reduction compared to 2023, indicating better enforcement or deterrence efforts.
- Burglary, a major component of property crime, decreased by 40.11%. Despite this reduction, burglary still has a relatively low clearance rate at 20.75% as noted by gov sources.
- The overall clearance rate for property crimes is low (15.29%), suggesting challenges in resolving these cases despite the decreasing trend.
Property Crime Offense Breakdown
Offense Type
Description
Clearance Rate (%)
Burglary
Unlawful entry with intent to commit felony or theft
20.75%
Methodology
This report analyzes Nevada population, economy, housing, and crime trends using reliable sources like the Census Bureau, World Population Review, BLS, and law enforcement data. Key metrics include population growth, crime rates, housing prices, and income levels.
Data is organized by categories (e.g., Crime, Economy) with tables for clarity. Year-over-year trends and percentage changes highlight progress or challenges, such as crime reductions and rising unemployment. Key insights focus on urban concentration, migration, and affordability issues.
This concise, structured approach ensures readability and quick comprehension of Nevada’s current landscape and future outlook.
Sources
- World Population Review – Nevada Population 2024
- Neilsberg – Population By Age Nevada 2024
- Demographics.com – Population By County Nevada 2024
- NV.gov – Nevada County Population Projections 2024 to 2043
- Department of Education – Nevada Report Card
- Income By Zip Code – Nevada Income Statistics
- BLS –Economy At Glance
- American Immigration Council – Nevada Immigrants
- Zillow – Housing Market Nevada
- Nevadacrimestats.nv.gov – Crime Stats 2024


