New Mexico, a landlocked state in the Mountain Division of the southwestern United States, shares borders with Colorado to the north, Oklahoma and Texas to the east, the Mexican states of Chihuahua and Sonora to the south, and Arizona to the west.
As of now, New Mexico has a population of approximately 2,115,270, with an annual growth rate of 0.64%, ranking 30th in the nation according to the World Population Review.
The 2020 U.S. Census reported a population of 2,059,179, marking the first time the state exceeded 2 million residents—a 14.5% increase from the previous census in 2000.
However, population growth across the state has been uneven, with some counties experiencing gains while others saw declines.
Table of ContentsKey Takeaways
Population by Age
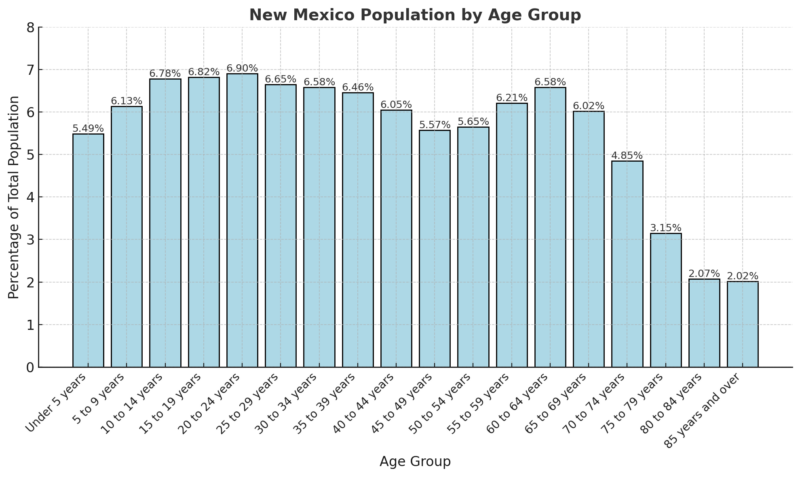
According to the 2018-2022 ACS 5-Year Estimates, the median age in New Mexico is 38.6 years.
The population is distributed as follows: 18.40% are under the age of 15, 20.37% are aged 15 to 29, 43.10% are between 30 and 64 years, 16.09% are aged 65 to 84, and 2.02% are 85 years or older.
Population by Age Cohort
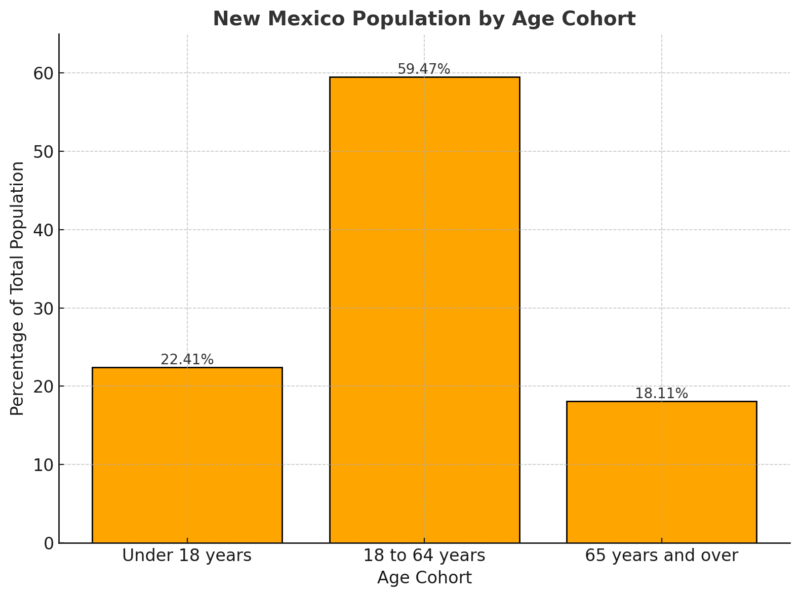
The majority of New Mexico’s population (59.47%) is of working age (18-64 years), while children (under 18) make up 22.41%, and seniors (65+) account for 18.11%.
This distribution highlights a strong working-age population supporting dependent cohorts.
Dependency Ratios
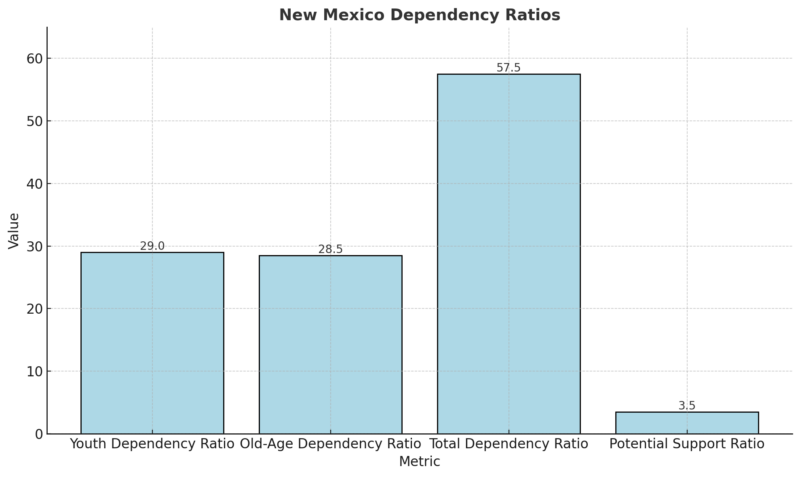
With a youth dependency ratio of 29.0 and an old-age dependency ratio of 28.5, the total dependency ratio stands at 57.5.
This indicates that for every 100 working-age individuals, there are 57.5 dependents (either children or elderly).
The potential support ratio of 3.5 shows there are 3.5 working-age adults for every senior citizen.
Population by Gender Across Age Groups
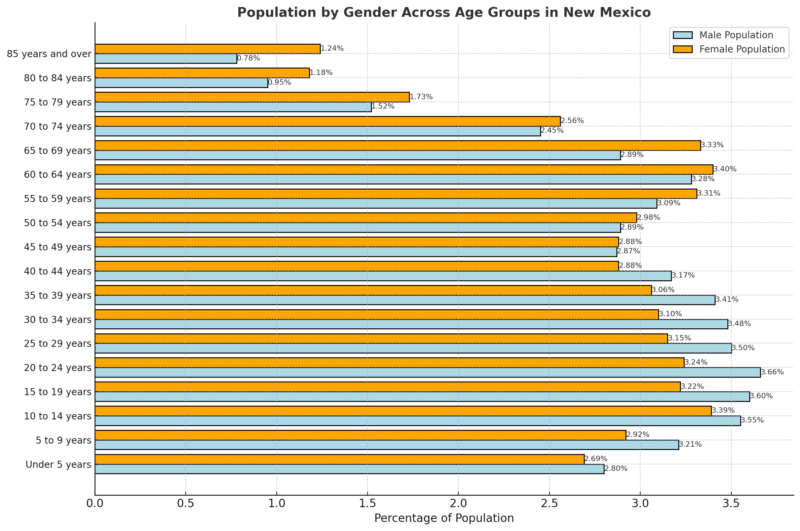
The gender distribution is relatively balanced across most age groups.
However, the female population surpasses the male population in older age groups (70+), reflecting a longer life expectancy for women in New Mexico.
Population by Race
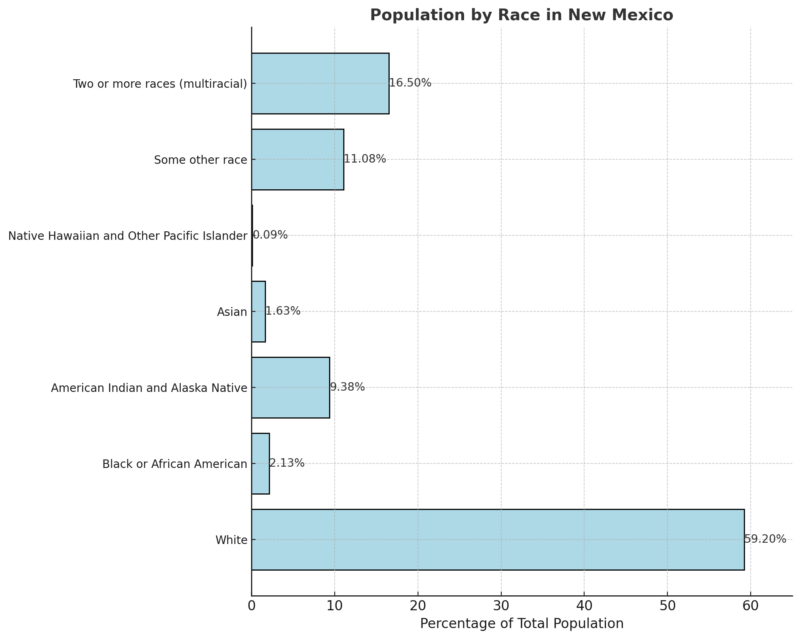
New Mexico’s population is diverse, with 59.20% identifying as White, the largest racial group according to Neilsberg article.
American Indian and Alaska Native residents represent a significant portion at 9.38%, reflecting the state’s historical and cultural ties to indigenous communities.
Multiracial individuals account for 16.50%, showcasing the increasing diversity within the state.
Other groups, including Black or African American (2.13%), Asian (1.63%), and Native Hawaiian and Other Pacific Islander (0.09%), contribute smaller but meaningful shares to the population.
The “Some other race” category, at 11.08%, highlights the complexities of racial identification in New Mexico.
Population by County
County
Population
% Change
Area (sq mi)
Population Density (per sq mi)
Bernalillo County
670,215
-0.98%
448
577
Doña Ana County
226,890
3.1%
1,500
60
Sandoval County
158,275
6.02%
1,400
43
Santa Fe County
156,151
0.71%
737
82
San Juan County
120,781
-0.49%
2,100
22
Valencia County
80,081
4.85%
412
75
Lea County
71,859
-3.73%
1,700
16
Otero County
69,153
1.9%
2,600
10
McKinley County
67,663
-6.79%
2,100
12
Chaves County
63,230
-2.95%
2,300
10
Eddy County
60,347
-3.19%
1,600
14
Curry County
47,014
-2.8%
543
33
Rio Arriba County
39,761
-1.27%
2,300
7
Taos County
34,220
-0.71%
850
16
Grant County
27,251
-3.38%
1,500
7
Cibola County
26,689
-1.52%
1,800
6
San Miguel County
26,434
-2.57%
1,800
6
Luna County
24,939
-2.04%
1,100
8
Lincoln County
19,715
-2.92%
1,900
4
Los Alamos County
19,615
1.01%
42
180
Roosevelt County
18,716
-2.26%
944
8
Torrance County
15,883
5.45%
1,300
5
Socorro County
15,815
-4.45%
2,600
2
Colfax County
12,238
-0.92%
1,500
3
Sierra County
11,502
-0.52%
1,600
3
Quay County
8,491
-2.54%
1,100
3
Guadalupe County
4,268
-3.85%
1,200
1
Mora County
4,099
-2.2%
743
2
Union County
3,946
-3.07%
1,500
1
Hidalgo County
3,919
-5.88%
1,300
1
Catron County
3,857
6.96%
2,700
1
De Baca County
1,622
-3.51%
897
1
Harding County
627
-3.98%
820
0.30
New Mexico is divided into 33 counties. The most populous is Bernalillo County, home to 678,701 residents as per WPR.
As the location of Albuquerque, the state’s largest city and primary economic center, Bernalillo County plays a key role in New Mexico.
The second most populous county is Doña Ana County with 217,522 residents, followed by Santa Fe County, home to the state capital, with 150,056 residents.
Since the 2010 Census, these counties have seen growth rates of 2.22%, 3.53%, and 3.82%, respectively.
Harding County is the least populated county in New Mexico, with just 655 residents, accounting for 0.03% of the state’s population and a density of 0.31 persons per square kilometer. De Baca County follows with 1,781 residents, or 0.08% of the population, and a density of 0.77 persons per square kilometer.
Catron County ranks third with 3,578 residents, representing 0.17% of the state’s population and a density of 0.52 persons per square kilometer.
No county in New Mexico has experienced double-digit growth since 2010. Sandoval County leads in population growth with a 9.63% increase, followed by Lea County (7.76%) and Eddy County (7.42%).
Most counties in New Mexico have seen population declines since the 2010 Census. Hidalgo County experienced the largest decrease, with a 12.83% decline, followed by De Baca County (12.22%) and Colfax County (11.82%)
Employment and Unemployment Rates 2024
Data Series
May 2024
June 2024
July 2024
Aug 2024
Sept 2024
Oct 2024 (p)
Civilian Labor Force
970.2
972.1
974.6
975.9
977.3
979.1
Employment
933.2
934.7
935.5
935.9
936.4
937.0
Unemployment
37.0
37.5
39.1
40.1
40.9
42.1
Unemployment Rate
3.8%
3.9%
4.0%
4.1%
4.2%
4.3%
The civilian labor force in New Mexico increased steadily from May 2024 (970.2K) to October 2024 (979.1K), reflecting economic activity and labor participation growth.
Employment figures also saw consistent growth, from 933.2K in May 2024 to 937.0K in October 2024. This suggests that job creation has remained steady despite rising unemployment numbers according to BLS.
NM unemployment rate goes up in September https://t.co/dvuHlIctn0
— KRQE News 13 (@krqe) October 22, 2024
Unemployment levels rose from 37.0K in May 2024 to 42.1K in October 2024, a noticeable increase that highlights challenges in fully matching labor force growth with job availability.
The unemployment rate edged up from 3.8% in May 2024 to 4.3% in October 2024. While still relatively low, this gradual increase may indicate structural issues in the job market or economic adjustments.
Median Household Income
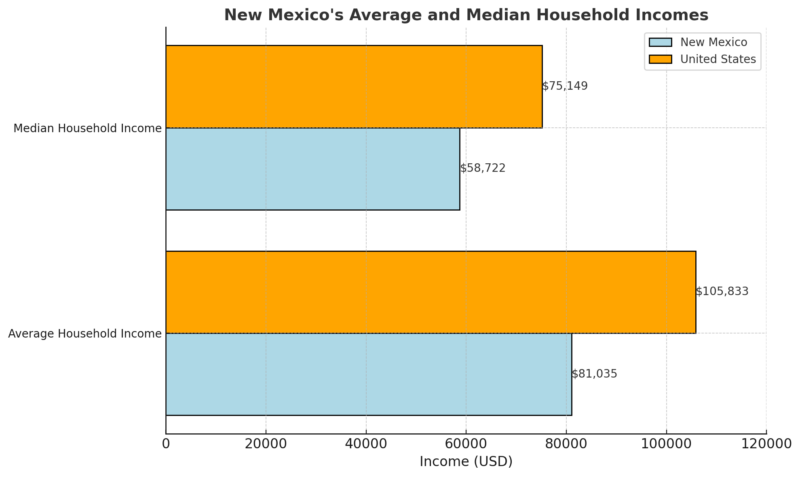
New Mexico’s average and median household incomes are significantly lower than the national averages, with a 23% and 22% gap, respectively according to Incomebyzipcode.
This highlights persistent economic challenges within the state, particularly in elevating median earnings to align with national trends.
Richest New Mexico Zip Codes (2025)
Rank
Zip Code
Population
Mean Income
Median Income
1
87122
18,592
$199,446
$152,360
2
87547
5,592
$178,226
$144,661
3
87544
13,661
$160,681
$130,368
4
87025
1,472
$159,031
$141,139
5
87048
8,839
$141,468
$94,479
The wealthiest zip code, 87122, has a mean income of $199,446 and a median income of $152,360, reflecting concentrated economic prosperity in select regions. Similar trends are observed in other high-income zip codes like 87547 and 87544, where incomes remain substantially above the state averages.
New Mexico Individual Income Statistics
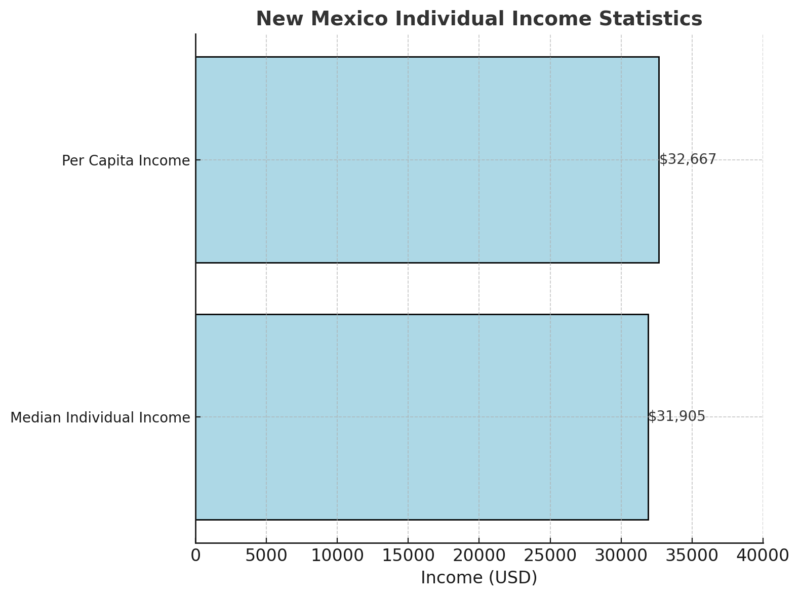
The median individual income of $31,905 and the per capita income of $32,667 are both significantly lower compared to household and family incomes.
New Mexico Family Income Statistics
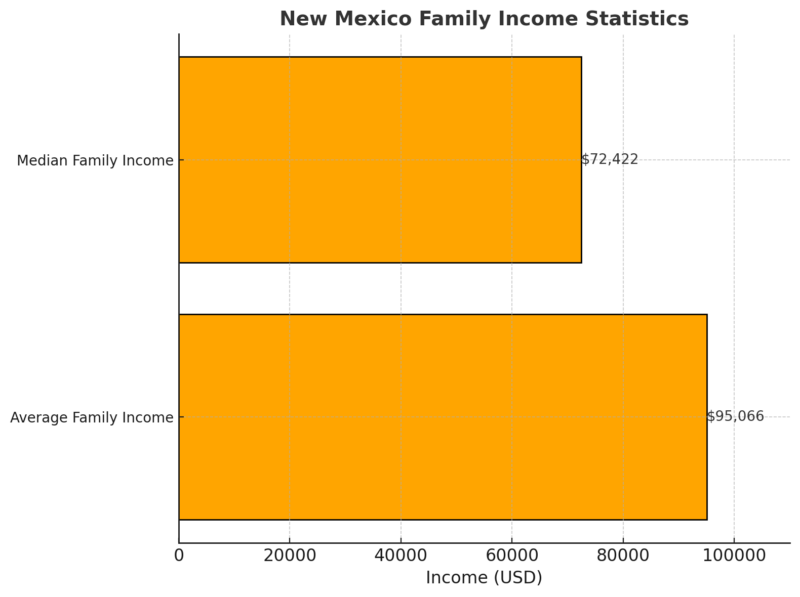
Family incomes in New Mexico are higher than individual and household incomes, with an average of $95,066 and a median of $72,422.
Poverty Levels
Essential Poverty Levels in New Mexico (2025)
Family Size
100% Poverty Level ($)
200% Poverty Level ($)
400% Poverty Level ($)
1
15,060
30,120
60,240
2
20,448
40,884
81,768
3
25,824
51,648
103,284
4
31,200
62,400
124,800
5
36,588
73,164
146,328
6
41,964
83,928
167,844
7
47,340
94,680
189,360
8
52,728
105,444
210,888
This table outlines the income thresholds for poverty levels at 100%, 200%, and 400% of the Federal Poverty Level (FPL) in New Mexico.
- For a single-person household, the poverty line is set at $15,060 annually. At 200%, this increases to $30,120, while 400% corresponds to $60,240.
- A four-person household has a 100% poverty level at $31,200, with 200% and 400% levels set at $62,400 and $124,800, respectively.
- These thresholds increase with family size, reflecting higher financial needs.
The table provides a simplified view of income benchmarks used to determine eligibility for various assistance programs. The 400% level, often used as a ceiling for subsidies, shows the gap between low-income households and middle-income families. This structure demonstrates how larger families face proportionally higher financial challenges to meet basic living standards.
Educational Attainment
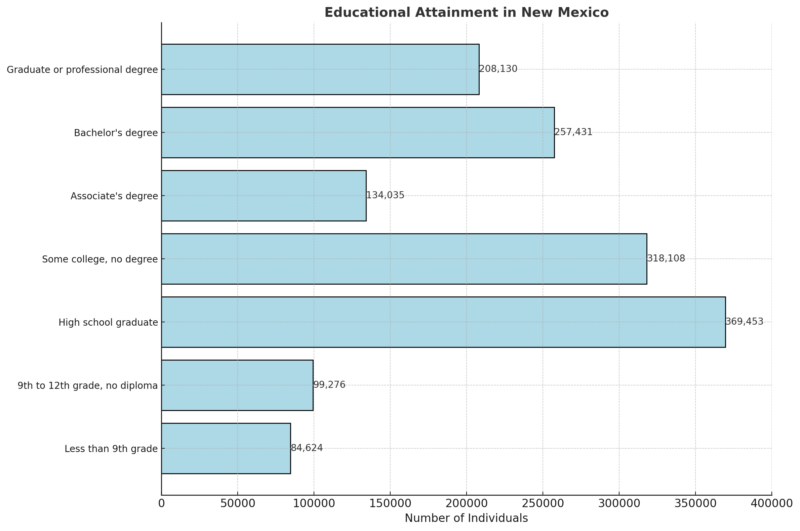
- The largest category is high school graduates, with 369,453 individuals, demonstrating that a significant portion of the population attains basic education levels.
- The “some college, no degree” group follows closely with 318,108 individuals, reflecting a common trend of incomplete higher education.
- Bachelor’s degree holders total 257,431, while graduate or professional degree holders number 208,130, showing a smaller but substantial population achieving advanced education.
- On the lower end, 99,276 individuals have some high school education but no diploma, and 84,624 individuals have less than a 9th-grade education, signaling opportunities for improvement in educational outreach and access.
Healthcare Access
In 2023, 9% of New Mexico’s population (184,800 individuals) was uninsured, slightly above the U.S. average of 8%.
About 140,000 adults in New Mexico reported having medical debt, representing 9% of the state’s adult population according to KFF.
This is marginally higher than the U.S. average of 8.6%, highlighting financial strains related to healthcare.
Medicaid and CHIP
Category
New Mexico
United States
Medicaid and CHIP Enrollment (2025)
768,344
N/A
Federal Share of Medicaid Costs
82.9%
N/A
Income Eligibility for Children
305% FPL
255% FPL
New Mexico’s Medicaid and CHIP programs play a critical role, covering over 768,000 individuals as of 2025.
Federal funding supports the majority of Medicaid expenses (82.9%).
The state has also expanded Medicaid under the Affordable Care Act (ACA) to include adults up to 138% of the FPL, with children covered up to 305% of the FPL, surpassing the U.S. benchmark of 255%.
ACA Marketplace Coverage
In 2025, 55,481 New Mexico residents enrolled in ACA marketplace plans, reflecting a 49% increase in enrollment since 2020.
Most enrollees (84%) benefited from premium tax credits, underscoring the importance of subsidies in ensuring affordable healthcare.
Employer-Sponsored Insurance
Employer-sponsored insurance remains a significant coverage source in New Mexico.
The average annual premium for family coverage was $24,207 in 2023, with an average deductible of $3,927—higher than the U.S. average of $3,811.
Medicare and Prescription Drugs
- In 2025, New Mexico had 459,784 Medicare beneficiaries, with 358,426 enrolled in Part D prescription drug coverage.
- A provision of the Inflation Reduction Act caps out-of-pocket drug expenses under Medicare Part D at $2,000 starting in 2025. Between 2017 and 2021, 15,000 New Mexico beneficiaries spent over $2,000 annually on prescription drugs.
Women’s Health Policies
Medicaid financed 55% of births in New Mexico in 2022. The state adopted the Medicaid 12-month postpartum coverage extension, with pregnant women covered up to 255% of the FPL.
New Mexico allows unrestricted access to abortion with no gestational limits and supports telehealth medication abortions.
Legal protections for contraception access are in place.
Health Status and Key Metrics
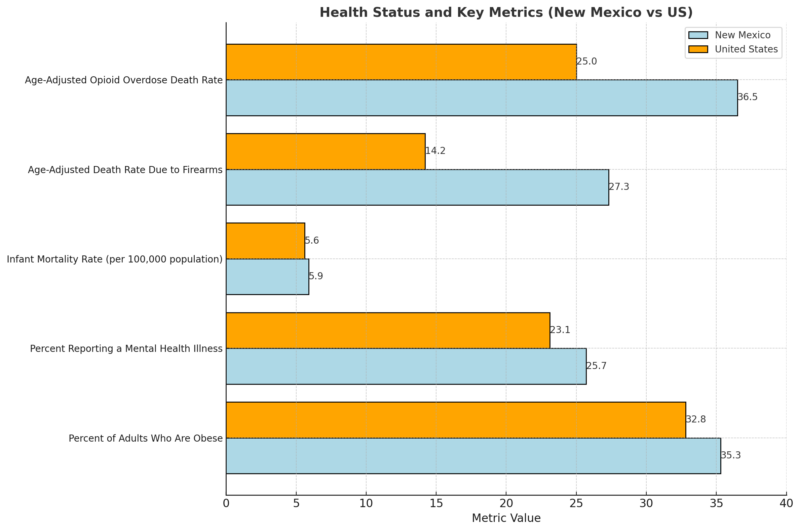
New Mexico faces significant public health challenges. Obesity and mental health illness rates are higher than national averages.
The firearm-related death rate is nearly double the U.S. average, and opioid overdose deaths are also considerably higher.
These figures emphasize the importance of targeted health initiatives to address these critical issues.
Housing Market
The median home sales price in New Mexico reached $376,700 in September 2024, marking a 3.1% increase from September 2023 when the median price was $365,200 according to Bankrate.
This highlights persistent economic disparities in a nation of over 346 million
This rise translates to an additional $11,500 in value over the year.
While New Mexico’s median price remains below the national median of $428,818, the steady increase reflects a market that is moderately appreciating.
Metric
September 2024
Change Since September 2023
Analysis
Median Home Price
$376,700
+$11,500 (+3.1%)
Moderate price appreciation reflects steady demand.
Homes for Sale
3,820
+820 (+27.3%)
Increased inventory signals a less competitive market.
Homes Sold
801
-85 (-9.6%)
Declining sales volume indicates slower market activity.
Median Days on Market
53 days
+17 days (+47.2%)
Longer selling times suggest reduced market competitiveness.
The number of homes for sale in New Mexico increased significantly to 3,820 in September 2024.
This represents a 27.3% increase compared to September 2023, when only 3,000 homes were on the market. Additionally, the inventory is up from 3,747 homes in August 2024.
The rising inventory suggests a shift toward a buyer-friendly market, with more options available.
A total of 801 homes were sold in September 2024, which is a decline of 9.6% compared to the 886 homes sold in September 2023.
Homes in New Mexico spent a median of 53 days on the market in September 2024, a notable increase from 36 days in September 2023.
This 47.2% increase highlights a slowdown in the market, with properties taking longer to sell, indicating reduced competitiveness.
Migration Patterns
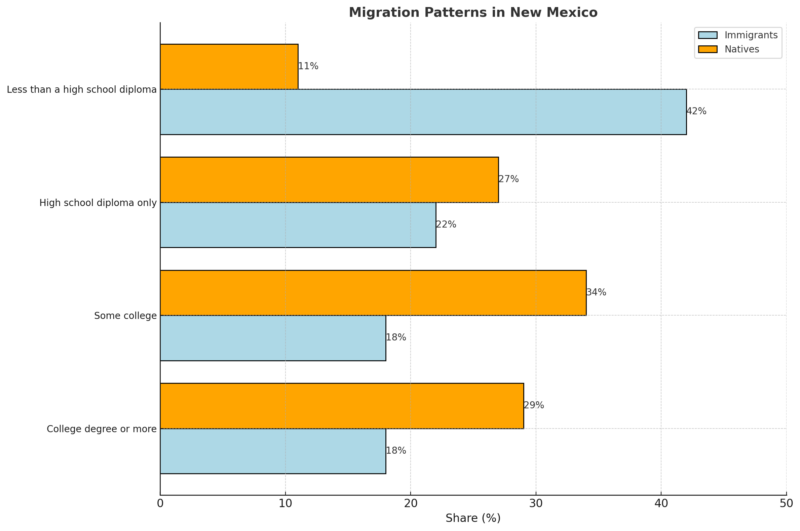
Over 40% of immigrants in New Mexico were naturalized U.S. citizens by 2018.
50,913 immigrants were eligible for naturalization in 2017, while 67% of immigrants reported speaking English “well” or “very well.”
Despite challenges, 18% of adult immigrants had a college degree or higher, though 42% had less than a high school diploma according to American Immigration Council.
Undocumented Immigrants and Family Impact
- In 2016, undocumented immigrants made up 29% of the immigrant population and 3% of New Mexico’s total population, with 60,000 individuals.
- Approximately 58,000 U.S. citizens in New Mexico live with at least one undocumented family member.
- Between 2010 and 2014, about 1 in 11 children in New Mexico was a U.S. citizen living with an undocumented family member.
Deferred Action for Childhood Arrivals (DACA)
DACA recipient wins New Mexico legislative seat and other historic 2024 election wins
https://t.co/Ot1r2OwThE— CBS News (@CBSNews) November 7, 2024
- As of 2020, 5,690 individuals in New Mexico were active DACA recipients.
- About 70% of DACA-eligible individuals in the state had applied for the program by 2019.
- An additional 2,000 residents met most DACA requirements, except for educational qualifications.
Economic Contribution of Immigrants
This article was developed by analyzing publicly available data from reliable sources such as the U.S. Census Bureau, the American Community Survey (ACS), and reports from government agencies. Population statistics, economic contributions, and demographic breakdowns were synthesized to provide a comprehensive overview. Housing data was extracted from real estate market reports, highlighting trends in prices, inventory, and sales. Healthcare coverage statistics and Medicaid details were drawn from state-level reports and national datasets. Immigration data and contributions were analyzed using reports from the American Immigration Council and federal immigration statistics. Each section was cross-referenced with relevant data to ensure accuracy and relevancy. Finally, insights were presented in a concise, data-driven format to provide clear, actionable information.
Industry
Number of Immigrant Workers
Share of All Workers (%)
Agriculture, Forestry, Fishing, Hunting
N/A
28%
Construction
17,946
22%
Accommodation and Food Services
17,588
17%
Health Care and Social Assistance
12,618
N/A
Educational Services
9,929
N/A
Occupation
Number of Immigrant Workers
Share of All Workers (%)
Farming, Fishing, and Forestry
N/A
40%
Construction and Extraction
17,815
24%
Building and Grounds Maintenance
12,251
23%
Food Preparation and Serving
13,180
17%
Methodology
References
Related Posts:


