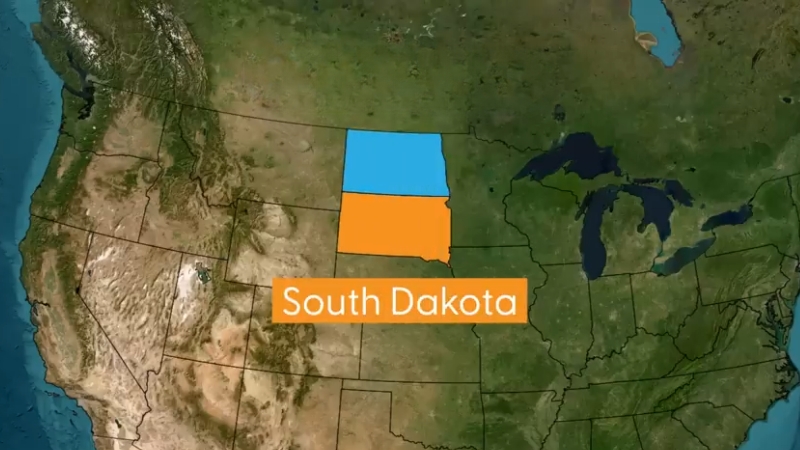
The current population of South Dakota is estimated at 928,767, reflecting steady growth since the last Census according to the World Population Review.
South Dakota’s population has been increasing at an annual rate of approximately 1.17%, making it one of the fastest-growing states in the country, ranking 11th overall.
Located in the northern Midwest, South Dakota is the 17th largest state by area but has a relatively sparse population.
Similar to its neighbor, North Dakota, the state’s geography and limited urbanization have not supported large population centers.
Additionally, fewer employment opportunities have historically led to out-migration, though recent growth suggests a reversal of this trend as more people are drawn to the region.
Table of ContentsKey Takeaways
Population Distribution by Age and Gender
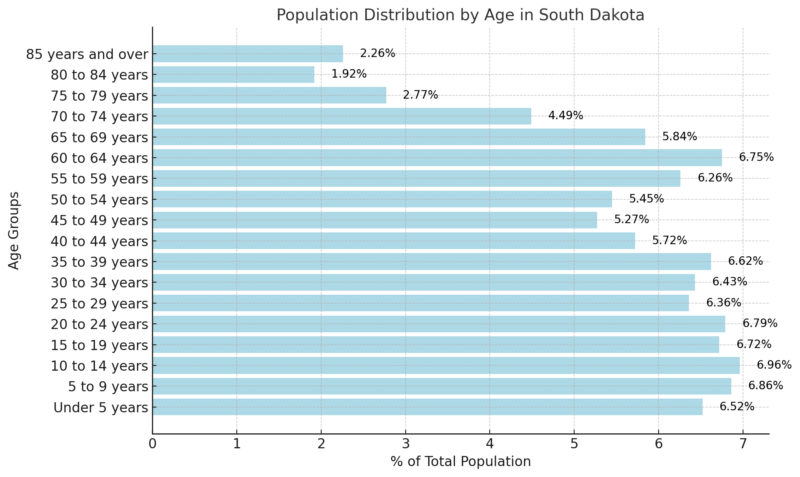
According to the 2018-2022 ACS 5-Year Estimates, the median age in South Dakota is 37.5 years. The population distribution shows that 20.34% are under the age of 15, 19.87% are between 15 and 29 years old, 42.50% fall within the 30 to 64 age range, 15.02% are aged 65 to 84, and 2.26% are 85 years or older.
Age Cohort
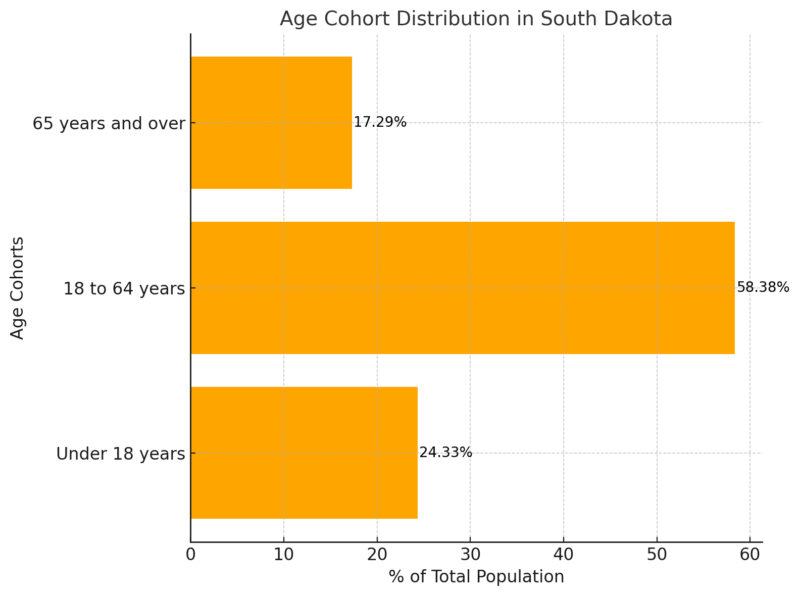
The youth population (under 18) is slightly higher than the national average, at 24.33%.
The majority of the population (58.38%) is in the working-age group (18-64 years), aligning with the state’s economic activities.
Seniors aged 65 and over make up 17.29%, indicating a steadily aging population.
South Dakota Population by Gender
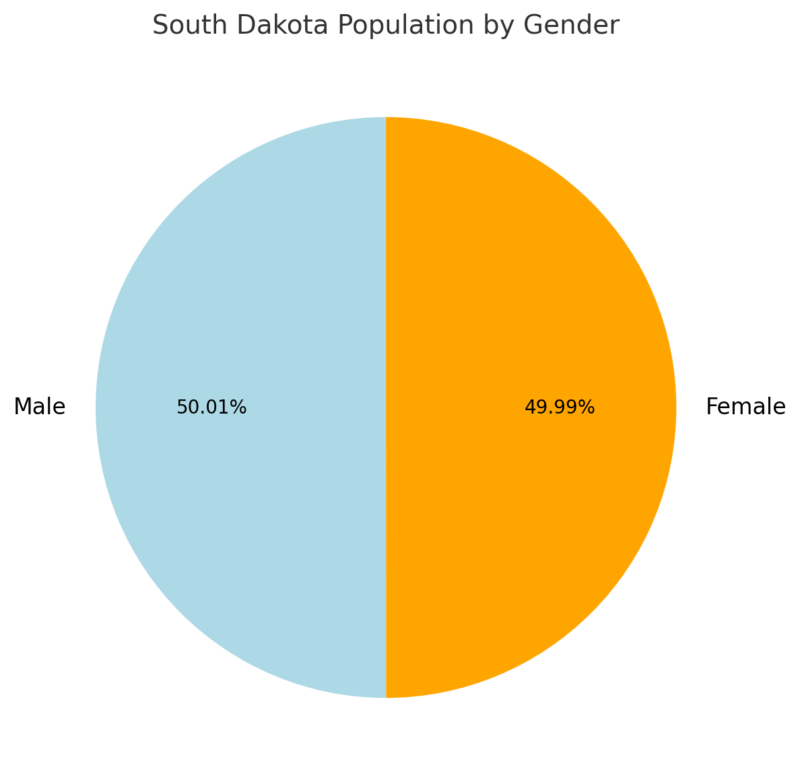
The gender distribution in South Dakota is nearly equal, with males comprising 50.01% of the population and females making up 49.99%.
This balance indicates no significant gender disparities in the state population.
Ethnic and Racial Composition
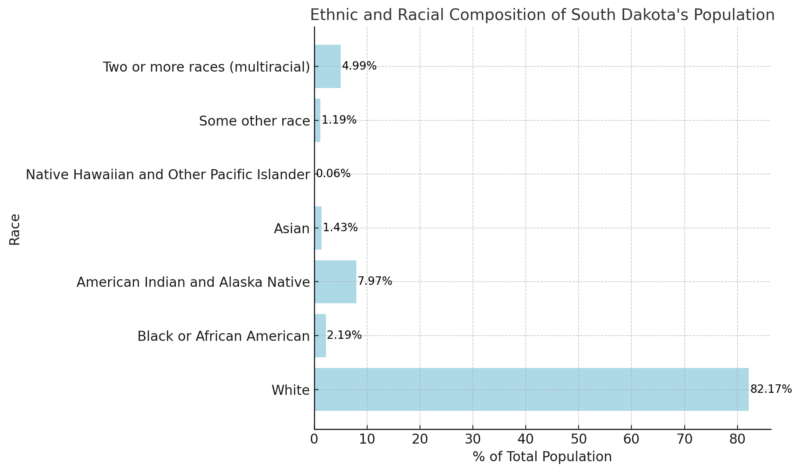
The majority of South Dakota’s population is White, comprising 82.17% of the total according to the Neilsberg.
The second-largest group is American Indian and Alaska Native at 7.97%, reflecting the state’s historical and cultural ties to Indigenous communities.
Multiracial individuals account for 4.99%, while Black or African American residents represent 2.19%. Asians and individuals of other races make up smaller portions of the population, while Native Hawaiian and Other Pacific Islander residents are the least represented group at just 0.06%.
South Dakota Population By Counties 2025
County
Population
Minnehaha County
210,015
Pennington County
117,500
Lincoln County
75,452
Brown County
37,565
Brookings County
36,469
Meade County
31,206
Codington County
29,206
Lawrence County
28,866
Yankton County
23,622
Davison County
19,937
Beadle County
19,694
Hughes County
17,567
Union County
17,303
Clay County
15,561
Oglala Lakota County
13,360
Lake County
11,122
Butte County
10,936
Roberts County
10,273
Charles Mix County
9,248
Custer County
9,213
Turner County
9,166
Todd County
9,165
Grant County
7,620
Hutchinson County
7,437
Fall River County
7,389
Bon Homme County
7,066
Moody County
6,518
Hamlin County
6,508
Spink County
6,104
McCook County
5,850
Tripp County
5,663
Day County
5,427
Brule County
5,321
Dewey County
5,274
Kingsbury County
5,273
Walworth County
5,252
Marshall County
4,417
Deuel County
4,347
Edmunds County
4,043
Gregory County
4,037
Clark County
3,973
Corson County
3,747
Lyman County
3,705
Hanson County
3,463
Bennett County
3,277
Hand County
3,102
Stanley County
3,069
Douglas County
2,889
Perkins County
2,859
Aurora County
2,802
Jackson County
2,720
Sanborn County
2,395
Potter County
2,380
Miner County
2,275
McPherson County
2,272
Ziebach County
2,250
Faulk County
2,180
Buffalo County
1,914
Haakon County
1,868
Mellette County
1,829
Jerauld County
1,658
Sully County
1,506
Campbell County
1,325
Harding County
1,309
Hyde County
1,173
Jones County
835
WPR notes that South Dakota has 66 counties, with two having populations exceeding 100,000. Minnehaha County, the most populous, has 192,876 residents, accounting for 21.86% of the state’s population. Pennington County follows with 111,729 residents (12.66%). Lincoln County, the third-most populous, has 58,807 residents.
Jones County is the least populated, with only 628 residents, making up 0.11% of the state’s population and a density of 0.96 persons per square kilometer. Harding County, with 1,249 residents, and Sully County, with 1,392 residents, are the second and third-least populous counties, respectively.
Jones County has seen an 8.21% population decline since 2010, while Harding and Sully have experienced slight growth of 0.24% and 1.09%.
Lincoln County has seen the fastest growth, increasing by 30.14% since 2010, followed by Lake County (15.76%) and Minnehaha County (13.49%). Other counties with double-digit growth include Meade (11.01%), Pennington (10.36%), Marshall (10.12%), and Brookings (10.12%).
Several counties have experienced population declines, with the most significant losses in Hyde (9.85%), Jones (8.21%), Miner (6.78%), and Campbell (6.39%).
Employment Rates and Opportunities
Data Series
May 2024
June 2024
July 2024
Aug 2024
Sept 2024
Oct 2024 (p)
Civilian Labor Force
481.5
481.7
482.6
483.2
484.0
485.1
Employment
471.9
472.2
473.0
473.6
474.6
475.9
Unemployment
9.6
9.5
9.6
9.6
9.5
9.2
Unemployment Rate (%)
2.0
2.0
2.0
2.0
2.0
1.9
The labor force in South Dakota showed steady growth, with the civilian labor force increasing from 481.5 in May to 485.1 in October 2024 according to the BLS.
Employment followed a consistent upward trend, rising from 471.9 to 475.9 over the same period.
Unemployment figures saw a slight decline from 9.6 in May to 9.2 in October, indicating improvement in the job market.
Unemployment rate 1.9 percent in Sioux Falls, South Dakota, in August 2024 https://t.co/6XG6OCoS0F #BLSdata pic.twitter.com/pXsqO4QOoH
— BLS-Labor Statistics (@BLS_gov) October 8, 2024
The unemployment rate remained stable at 2.0% from May through September before dropping to 1.9% in October, reflecting a strong and improving labor market.
Job Openings and Labor Turnover in South Dakota
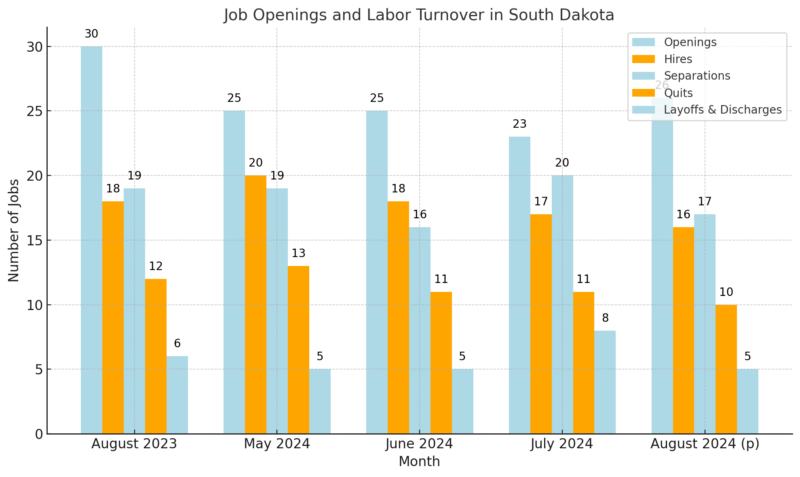
In August 2024, job openings in South Dakota rose to 26,000 from 23,000 in July, reflecting a healthy labor market.
Hires decreased slightly from 17,000 to 16,000, while separations also declined from 20,000 to 17,000 as per report from BLS.
Quits dropped by 1,000 to 10,000, and layoffs and discharges returned to 5,000 after a spike in July.
Job Openings and Labor Turnover Rates for South Dakota
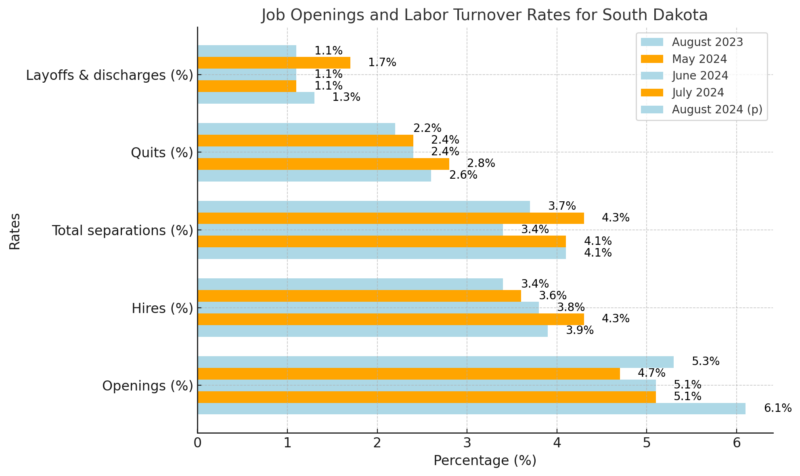
The job openings rate in South Dakota increased to 5.3% in August 2024 from 4.7% in July. The hires rate declined slightly to 3.4%, while the total separations rate dropped to 3.7%, suggesting a stabilization in workforce turnover. Quits decreased to 2.2%, indicating fewer voluntary departures, while layoffs and discharges fell back to 1.1% after an increase in July.
Job Openings and Labor Turnover Rates for the United States
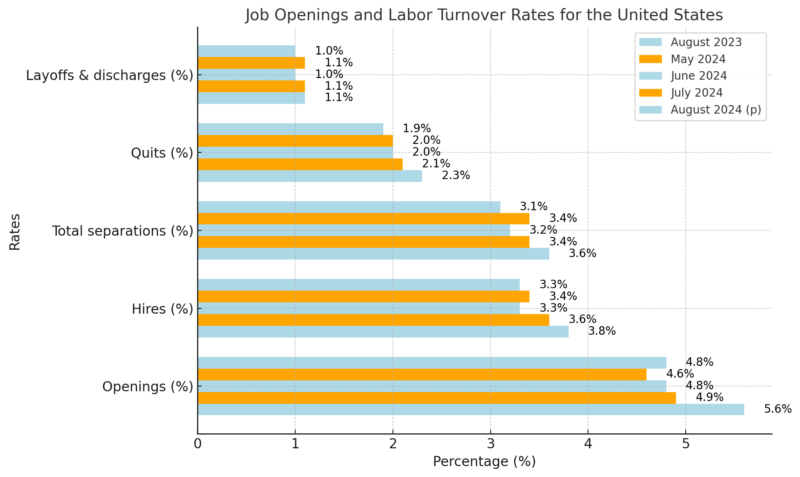
Analysis: Nationally, the job openings rate increased slightly to 4.8% in August 2024 from 4.6% in July, indicating an improving labor market. The hires rate remained stable at 3.3%, while the separations rate decreased to 3.1%. The quits rate fell marginally to 1.9%, and layoffs and discharges also dipped to 1.0%, showcasing a stable and favorable national employment environment.
Income Levels
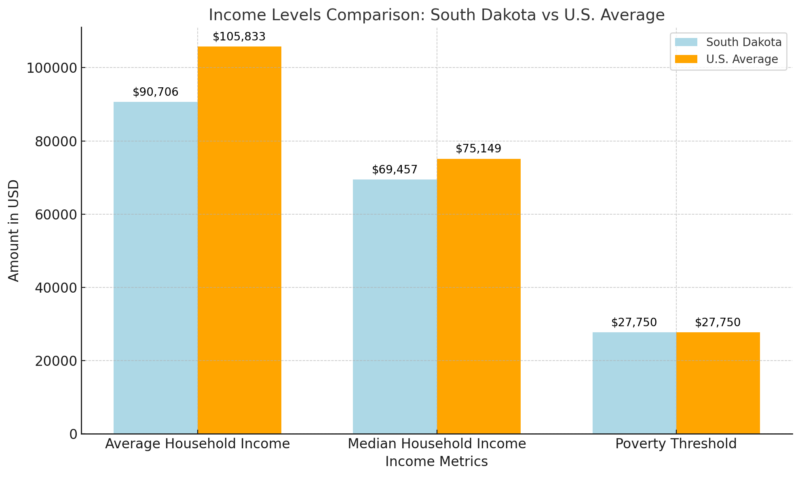
Income By Zip Code notes that the average household income in South Dakota is $90,706, 14% below the national average of $105,833. The median household income is $69,457, 8% below the U.S. median. This indicates that South Dakota households, on average, earn less than the national average, but the state’s poverty threshold aligns with the national standard.
Richest Zip Codes in South Dakota
Rank
Zip Code
Population
Mean Income
Median Household Income
1
57075
1,115
$213,977
$102,125
2
57015
846
$155,366
$112,813
3
57479
599
$151,237
$92,361
4
57020
1,885
$142,676
$114,667
5
57055
1,200
$138,844
$101,458
6
57049
7,661
$135,206
$88,948
7
57108
31,255
$132,746
$93,630
8
57005
12,169
$126,244
$105,618
9
57038
1,577
$123,342
$84,083
10
57312
673
$121,592
$85,208
The richest zip code in South Dakota is 57075, with an average household income of $213,977 and a median income of $102,125.
Other affluent areas include 57015 ($155,366 mean income) and 57479 ($151,237 mean income).
These areas have significantly higher income levels compared to the state average, reflecting regional wealth concentration.
South Dakota Salary Data
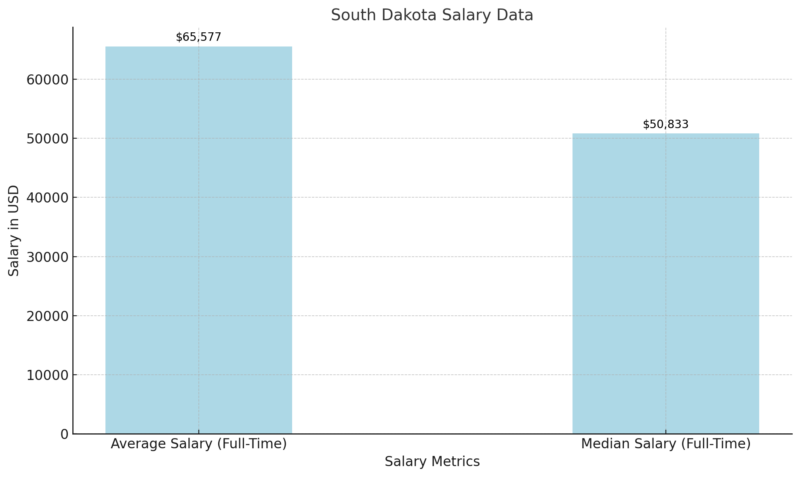
The average salary for full-time workers in South Dakota is $65,577, while the median salary is $50,833.
The gap between the average and median suggests a degree of income inequality, with higher earners pulling up the average.
Individual and Family Income in South Dakota
Income Type
Average Income
Median Income
Per Capita Income
$36,850
–
Single-Person Household Income
–
$36,557
Family Income
$110,466
$88,996
The average income per person in South Dakota is $36,850, which reflects all individuals, including non-earners.
Single-person households have a median income of $36,557, while families, which include multiple earners, have significantly higher incomes, averaging $110,466.
Retirement Income in South Dakota
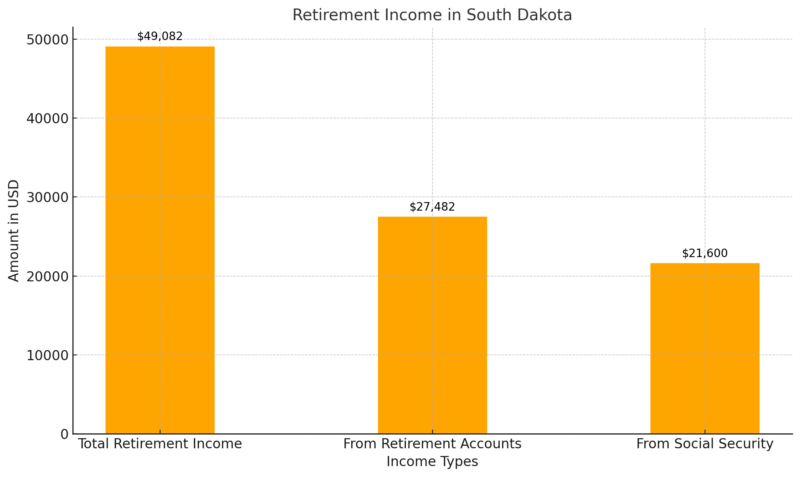
The average retirement income in South Dakota is $49,082, with $27,482 coming from retirement accounts and $21,600 from Social Security.
This indicates a balanced reliance on both personal savings and government support during retirement.
Educational Attainment Levels
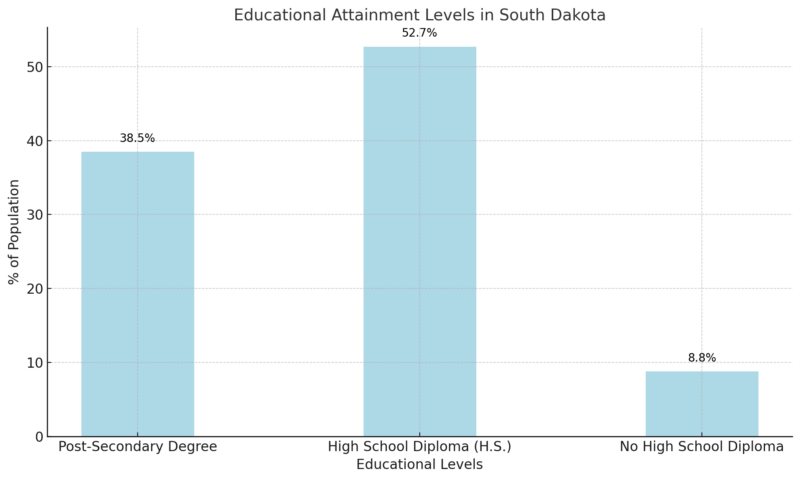
In South Dakota, 38.5% of individuals aged 25 and older have a post-secondary degree, which matches the national average according to the report of Statistical Atlas.
A significant portion, 52.7%, have completed high school as their highest level of education, which is 8.7% higher than the U.S. average.
Only 8.8% have not earned a high school diploma, reflecting a relatively high level of educational attainment compared to other states.
Health and Quality of Life
Health Indicator
Value
Fertility Rate
66.5 births per 1,000 women (15-44 years)
Teen Birth Rate
17.4 births per 1,000 females (15-19 years)
Infant Mortality Rate
7.77 infant deaths per 1,000 live births
Life Expectancy (at Birth)
76.6 years (2021)
Marriage Rate
6.4 marriages per 1,000
Divorce Rate
2.3 divorces per 1,000
Leading Cause of Death
Heart Disease
Drug Overdose Death Rate
11.3 per 100,000
Firearm Injury Death Rate
15.7 per 100,000
Homicide Rate
6.9 per 100,000
CDC’s data shows that South Dakota has a fertility rate of 66.5 births per 1,000 women aged 15-44, which is a reflection of stable reproduction trends.
The teen birth rate of 17.4 births per 1,000 females aged 15-19 is moderate compared to national trends.
The infant mortality rate is 7.77 per 1,000 live births, indicating an area for potential health improvement.
Life expectancy at birth stands at 76.6 years, which is slightly below the national average.
Heart disease is the leading cause of death, and the state experiences relatively low drug overdose death rates (11.3 per 100,000) compared to firearm injury death rates (15.7 per 100,000).
South Dakota Birth Data
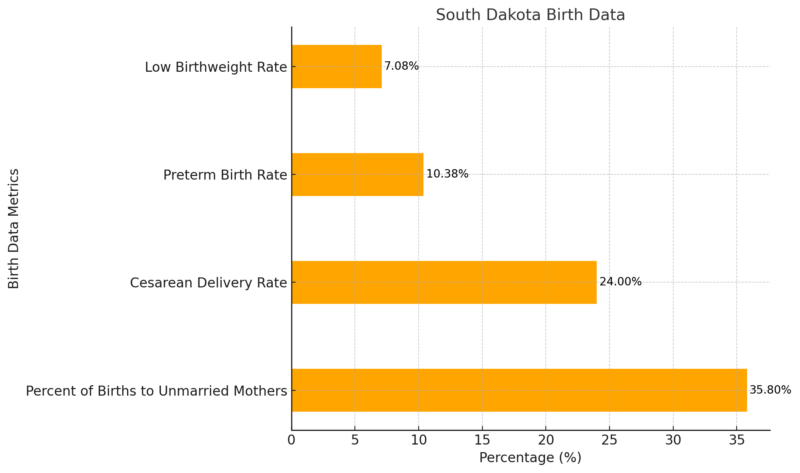
In 2022, 35.8% of births in South Dakota were to unmarried mothers, reflecting social trends in family structures.
The cesarean delivery rate was 24%, which aligns with national averages.
Preterm births occurred at a rate of 10.38%, and 7.08% of babies were born with low birthweight, both of which are critical indicators of neonatal and maternal health.
These statistics emphasize areas where prenatal care and maternal health services could be further strengthened.
Immigrants In South Dakota
Metric
Value
Total Immigrant Population
35,175
% of Total Population
4%
Native-Born Residents with Immigrant Parent(s)
33,628
Top Countries of Origin
Guatemala (8%), Philippines (7%), Mexico (7%), Sudan (6%), Ethiopia (5%)
Gender and Age Breakdown
15,647 women, 15,622 men, 3,906 children
American Immigration Council’s report shows that immigrants constitute 4% of South Dakota’s population, with a majority originating from Guatemala, the Philippines, and Mexico. Another 4% of residents are native-born citizens with at least one immigrant parent, reflecting the growing impact of immigration on the state’s demographics.
Immigrant Workforce and Industries
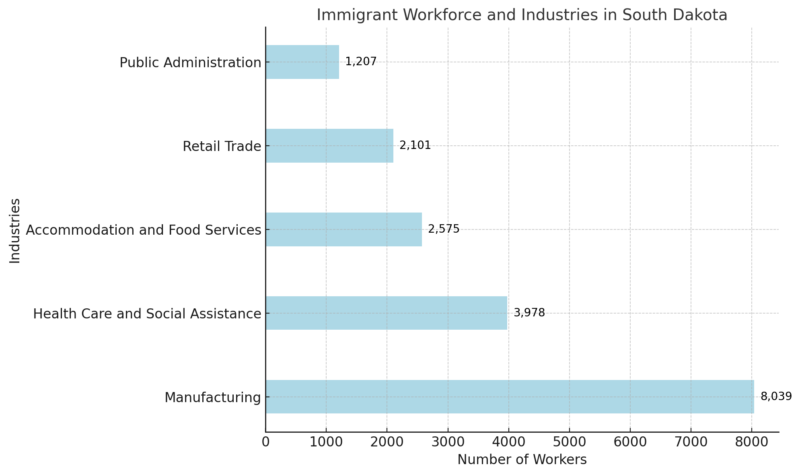
Immigrants play a crucial role in South Dakota’s labor market, particularly in manufacturing (16%) and accommodation/food services (7%).
These contributions underscore their importance to the state’s economic vitality and growth.
Immigrant Occupations
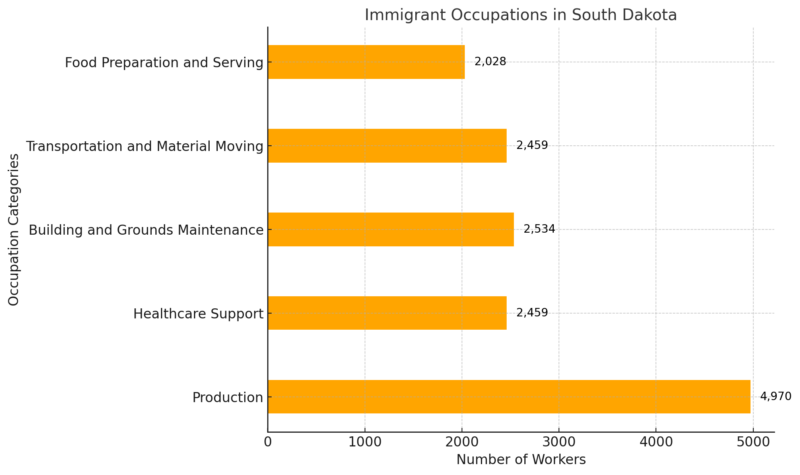
Immigrants are highly represented in production and healthcare support occupations, making them essential to key sectors.
Their labor sustains industries critical to the state’s economic infrastructure.
Economic Contributions of Immigrants
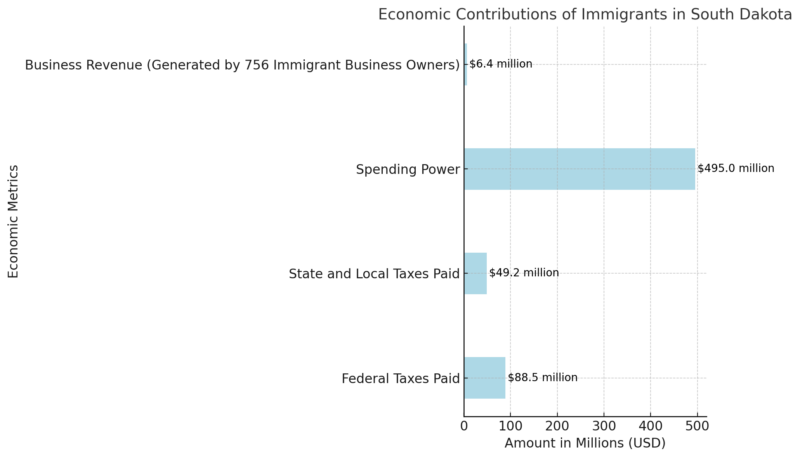
Immigrants contribute significantly to South Dakota’s economy through taxes and consumer spending, adding nearly half a billion dollars in spending power.
Additionally, immigrant entrepreneurs generate millions in business income, driving local economic growth.
Education Level of Immigrants
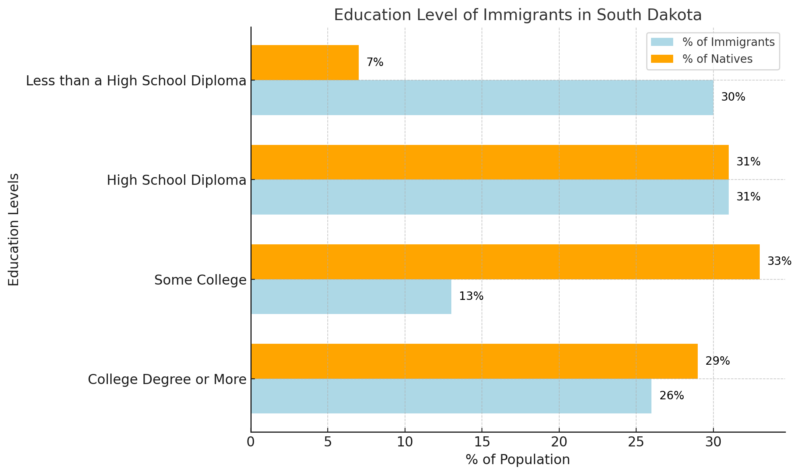
A substantial portion of immigrants in South Dakota (26%) have attained a college degree or higher, while 30% have less than a high school education.
This indicates a diverse range of educational backgrounds, with opportunities for further integration into higher-skilled occupations.
Undocumented Immigrants and DACA Recipients
Metric
Value
Undocumented Immigrant Population
5,000
DACA Recipients (Active as of 2020)
190
State and Local Taxes Paid by DACA Recipients
$510,000
Undocumented immigrants and DACA recipients contribute to South Dakota’s labor force and tax revenues.
The presence of DACA recipients highlights the state’s engagement in national immigration policies.
Methodology
- This article is crafted using verified data from reliable sources such as the U.S. Census Bureau, American Community Survey, and BLS reports.
- We analyzed key indicators such as population, income, employment, health statistics, and immigration trends for South Dakota.
- County-level data was reviewed to identify the fastest-growing and declining regions.
- Immigration contributions and economic impacts were quantified from 2020 American Immigration Council reports.
- Comparisons to national averages were drawn to highlight relative strengths and challenges.
- All data points were cross-referenced to ensure accuracy and relevancy, emphasizing recent trends and developments.
References
- World Population Review – South Dakota Population 2024
- Neilsberg – South Dakota Population by Age
- Statistical Atlas – South Dakota Educational Attainment
- Bureau of Labor Statistics (BLS) – Economic Overview for South Dakota
- Income by Zip Code – South Dakota Income Data
- American Immigration Council – Immigrants in South Dakota
- Centers for Disease Control and Prevention (CDC) – South Dakota Health Data
- Bureau of Labor Statistics (BLS) – Job Openings and Labor Turnover in South Dakota
- World Population Review – South Dakota Counties Population 2024


