

The leading causes of death in the United States changed so sharply during the 20th century that the 1900 ranking barely resembles the one from 1998. Pneumonia and influenza, tuberculosis and diarrheal disease dominated the beginning of the century. By the end, heart disease and cancer accounted for the largest share of deaths.
Several forces drove that shift at different times. Clean water, sewage systems, safer food and vaccination reduced exposure to infectious disease before antibiotics became widely available. Antibiotics then changed the treatment of bacterial infections from the 1940s onward, while better cardiovascular care, smoking reduction and blood-pressure treatment later pushed heart-disease mortality downward.
The main historical source used here is the National Center for Health Statistics report Leading Causes of Death, 1900-1998. Data from 1900 through 1932 cover the changing U.S. death-registration area rather than the complete country, while national coverage begins in 1933. Revisions to the International Classification of Diseases also created breaks between some cause categories.
The 1998 endpoint is intentional. It is the final year covered by the NCHS historical report used for the decade comparisons below. CDC continues the modern series from 1999 onward through its current leading causes of death datasets.
How the Leading Causes Changed Between 1900 and 1998
| Year | Leading Cause | Crude Rate per 100,000 | Second Cause | Crude Rate per 100,000 | Third Cause | Crude Rate per 100,000 |
|---|---|---|---|---|---|---|
| 1900 | Pneumonia and influenza | 202.2 | Tuberculosis | 194.4 | Diarrhea and enteritis | 142.7 |
| 1950 | Heart disease | 355.5 | Cancer | 139.8 | Vascular lesions affecting the central nervous system | 104.0 |
| 1998 | Heart disease | 268.2 | Cancer | 200.3 | Cerebrovascular disease | 58.6 |
Those figures come directly from the NCHS historical mortality tables. They are crude rates, which describe the death burden in the population as it existed at the time. Age-adjusted rates answer a different question because they reduce the effect of changes in population age.
| Cause | Age-Adjusted Rate in 1950 | Age-Adjusted Rate in 1996 | Change |
|---|---|---|---|
| Heart disease | 307.4 per 100,000 | 134.6 per 100,000 | -56% |
| Stroke | 88.8 per 100,000 | 26.5 per 100,000 | -70% |
The second table comes from the CDC review Decline in Deaths from Heart Disease and Stroke, United States, 1900-1999. It shows why crude and age-adjusted figures should not be mixed casually. The population grew older during the century, yet the underlying cardiovascular death risk fell dramatically after mid-century.
1990-1998
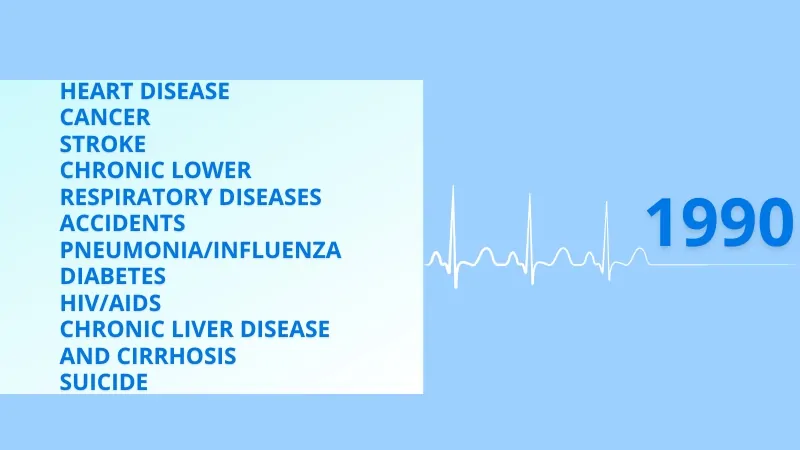
In 1998, heart disease caused 724,859 deaths at a crude rate of 268.2 per 100,000. Cancer followed with 541,532 deaths and a rate of 200.3. Comparing both figures side by side avoids the problem of switching between counts and rates depending on the decade.
HIV/AIDS created a very different mortality crisis inside that chronic-disease landscape. It hit younger adults especially hard, then declined sharply after effective combination antiretroviral therapy became available in the mid-1990s. A.K. Ghosh’s 2023 review, Four Decades of Continuing Innovations in the Development of Antiretroviral Therapy for HIV/AIDS, traces the treatment changes that turned HIV from a rapidly fatal infection into a condition many patients could survive for decades.
1980-1989
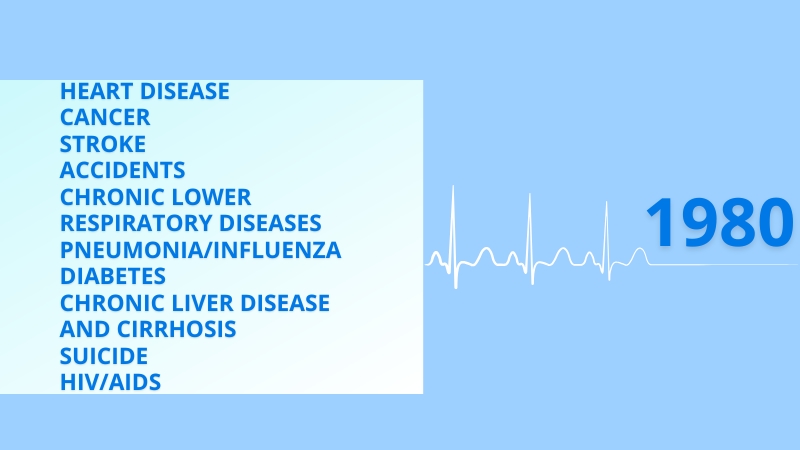
Heart disease and cancer still dominated the overall ranking, but HIV changed the age profile of infectious mortality because many of the people dying were young or middle-aged adults.
Video: TODAY, “Looking Back On 40 Years Of The AIDS Epidemic.”
Accidents and suicide remained important causes among younger Americans. Historian Frank Snowden later argued in Emerging and Reemerging Diseases: A Historical Perspective that HIV, cholera and Ebola demonstrated how urbanization, travel, poverty and antimicrobial resistance could create new epidemic risks even after decades of progress against infection.
1970-1979
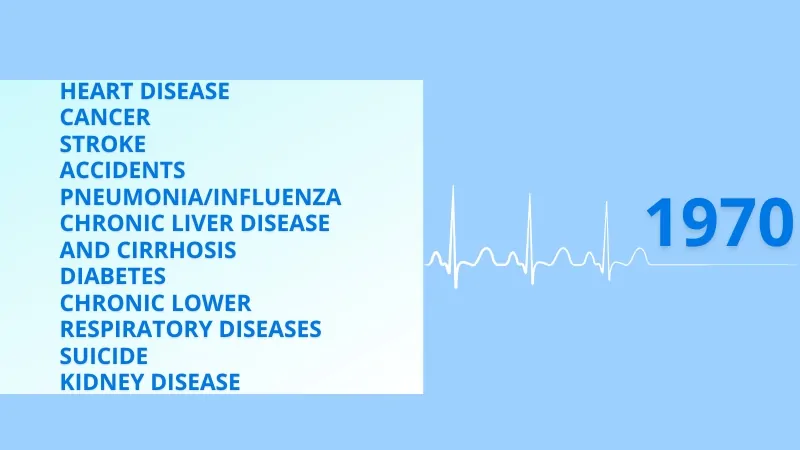
The important 1970s story is not another repetition of the ranking. Heart disease remained first and cancer second, but the risk of dying from cardiovascular disease was finally falling after its mid-century peak.
The CDC’s cardiovascular mortality review found that age-adjusted heart-disease mortality fell from 307.4 per 100,000 in 1950 to 134.6 in 1996. Better control of high blood pressure, lower smoking rates, coronary care and improvements in treatment all contributed, so the ranking changed more slowly than the underlying risk.
1960-1969
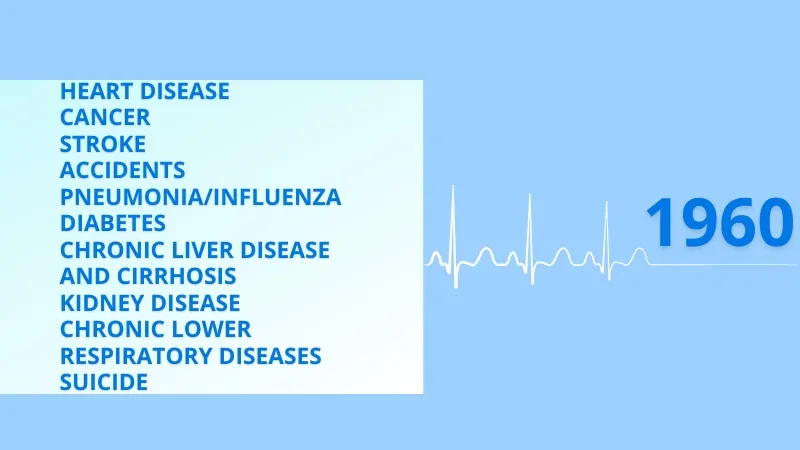
By 1960, heart disease caused more than 660,000 deaths and cancer more than 267,000, according to the NCHS historical mortality series. Infection had moved far down the national ranking, although pneumonia and influenza still killed tens of thousands of people each year.
Cardiovascular medicine was also becoming more systematic. The Framingham Heart Study and related research helped establish high blood pressure, cholesterol and smoking as major risk factors. A Circulation Research review of cardiovascular progress describes how risk-factor research, improved diagnosis and coronary care prepared the ground for the much larger mortality decline that followed.
1950-1959
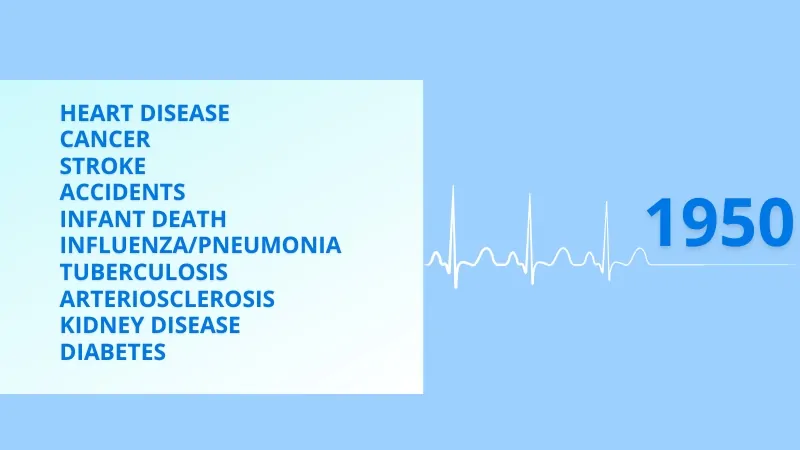
In 1950, heart disease stood at 355.5 deaths per 100,000, cancer at 139.8 and vascular lesions affecting the central nervous system at 104.0. Influenza and pneumonia had fallen to 31.3, while tuberculosis was down to 22.5.
The ranking demonstrates how much survival had changed in only half a century. Americans who would once have died from childhood infection or tuberculosis were increasingly surviving into the ages when heart disease, cancer and stroke became more likely.
1940-1949
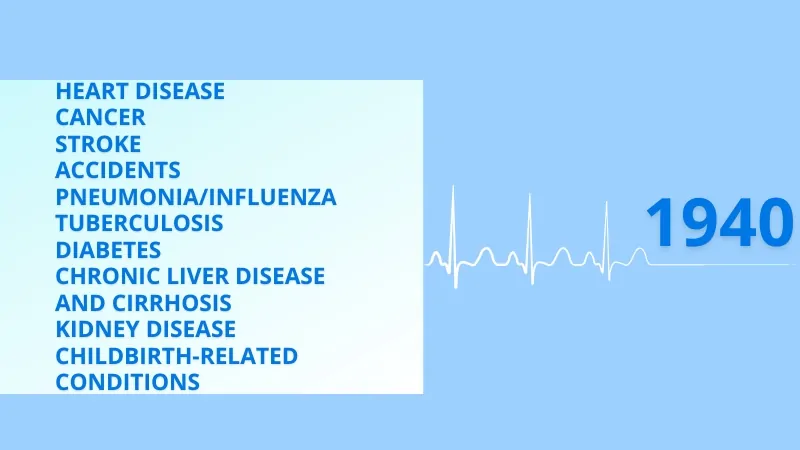
The 1940s show why public health and medicine should be treated as two stages of the same mortality transition rather than competing explanations. Sanitation, clean water and disease control had already pushed many infection rates downward before antibiotics arrived. Penicillin then made previously dangerous bacterial infections much more treatable.
A 33-year-old Connecticut woman became the first U.S. civilian saved with penicillin in 1942, but civilian supplies remained tightly rationed in 1943. The War Production Board coordinated a major production expansion, and the American Chemical Society history of penicillin records output rising from 21 billion units in 1943 to 1,663 billion in 1944 and more than 6.8 trillion in 1945. Production on that scale also drove the price down dramatically and made civilian access far easier after the war.
The mortality series shows what happened during the same period. By 1946, pneumonia and influenza had fallen to 44.6 deaths per 100,000 and tuberculosis to 36.4, according to Vital Statistics of the United States, 1946. Antibiotics accelerated those declines, although decades of sanitation and tuberculosis control had already done much of the early work.
1930-1939
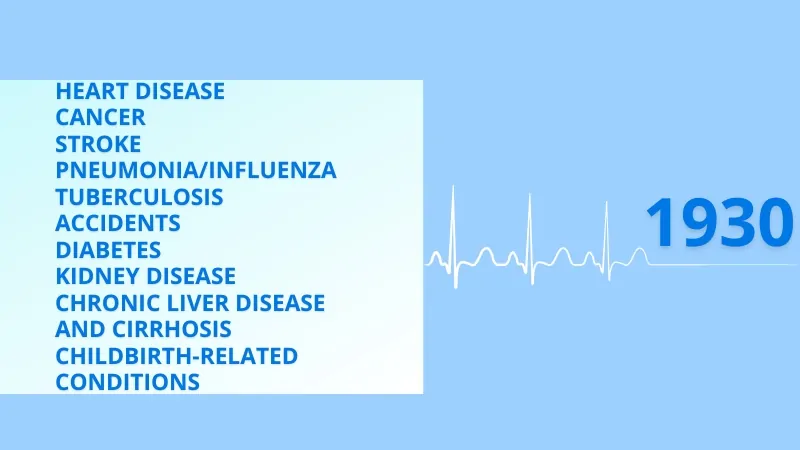
The 1930s provide the clearest evidence that antibiotics alone cannot explain the fall in infectious mortality. Tuberculosis, diarrhea and typhoid were declining before penicillin became a routine treatment because cleaner water, sewage systems, food safety and public-health programs reduced exposure.
The CDC’s Control of Infectious Diseases review shows that major reductions in infant and childhood infection occurred during the first decades of the century. Antibiotics later strengthened that progress by giving doctors effective treatment after bacterial infection had already occurred.
1920-1929
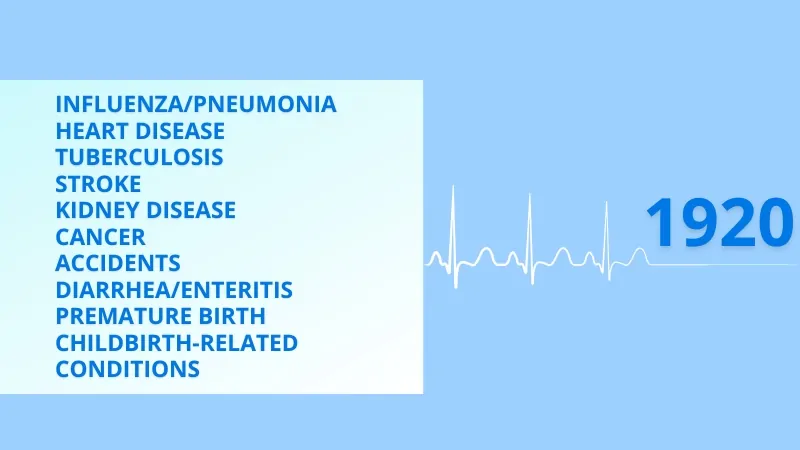
By 1920, official mortality statistics recorded 124,143 deaths from organic diseases of the heart, a crude rate of 141.0 per 100,000, while pneumonia caused 72,362 deaths at 82.7 per 100,000. The figures come directly from Mortality Statistics 1920.
The transition was already underway long before modern cardiac treatment. Infectious mortality was falling rapidly enough that heart disease became more visible, partly because more Americans survived childhood and early adulthood.
1910-1919
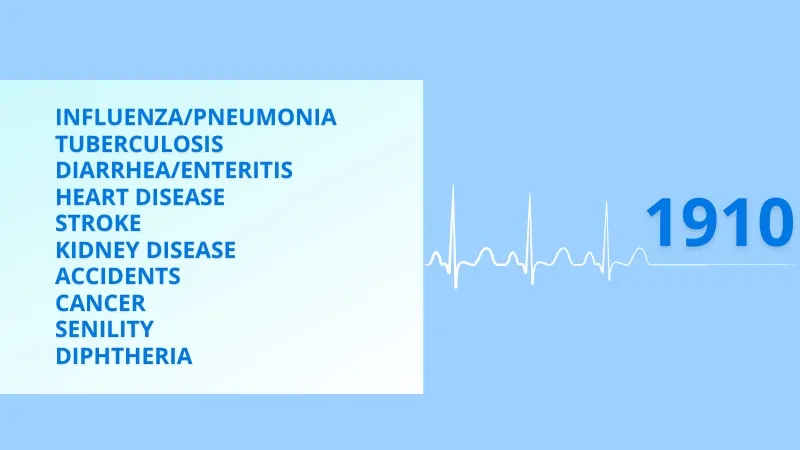
The 1918 influenza pandemic interrupted the long decline in infectious mortality with extraordinary force. Government statistics recorded 477,467 deaths from influenza and pneumonia in the registration area, with a combined rate of 583.2 deaths per 100,000.
Later research found that secondary bacterial pneumonia caused a large share of fatal cases. Brundage and Shanks reached that conclusion after reviewing autopsy evidence in Deaths From Bacterial Pneumonia During the 1918-19 Influenza Pandemic.
1900-1909

In 1900, pneumonia and influenza stood at 202.2 deaths per 100,000, tuberculosis at 194.4 and diarrhea and enteritis at 142.7. Heart disease was already significant at 137.4, while cancer stood at 64.0.
Children carried much of the infectious burden. The CDC reported that 30.4% of all deaths occurred among children younger than five, while pneumonia, tuberculosis, diarrhea and enteritis, and diphtheria together caused one-third of all deaths. The figures appear in the CDC report Control of Infectious Diseases.
Public Health and Medicine Changed Different Parts of the Story
The century cannot be reduced to antibiotics defeating infection or modern medicine defeating chronic disease. Public-health infrastructure reduced the chance of becoming infected in the first place, especially through clean water, sanitation and food safety. Vaccines prevented specific diseases, while antibiotics dramatically improved survival once many bacterial infections occurred.
Cardiovascular progress followed a similar pattern later in the century. Prevention reduced smoking and improved blood-pressure control, while medical treatment improved survival after heart attacks and strokes. The CDC estimates that age-adjusted cardiovascular mortality fell 60% from 1950 through the late 1990s.
Life expectancy rose by roughly three decades across the century, with the largest early gains coming from fewer deaths in infancy and childhood. The change in the leading causes of death is therefore partly a story about disease and partly a story about Americans surviving long enough to face a completely different set of health risks.
Bottom Line
The century-wide shift becomes clearest when the figures are read together. Pneumonia and influenza stood at 202.2 deaths per 100,000 in 1900 and tuberculosis at 194.4, while almost one-third of all deaths occurred among children younger than five. By the second half of the century, those infections had fallen dramatically and heart disease, cancer and stroke dominated the mortality ranking.
The later decline in cardiovascular deaths adds another layer. Heart disease remained the leading cause in 1998, but its age-adjusted rate had fallen by more than half from the 1950 peak. Americans were therefore living longer at the same time that the risk from several major chronic diseases was beginning to decline.
References
- National Center for Health Statistics. Leading Causes of Death, 1900-1998.
- National Center for Health Statistics. Age-Adjusted Death Rates for Selected Causes, 1900-1998.
- Centers for Disease Control and Prevention. Control of Infectious Diseases.
- Centers for Disease Control and Prevention. Decline in Deaths from Heart Disease and Stroke.
- Brundage JF, Shanks GD. Deaths From Bacterial Pneumonia During the 1918-19 Influenza Pandemic.
- Ghosh AK. Four Decades of Continuing Innovations in the Development of Antiretroviral Therapy for HIV/AIDS.
- Snowden FM. Emerging and Reemerging Diseases: A Historical Perspective.
- Circulation Research review of cardiovascular medicine and prevention.