
Not all public health funding is created equal, and where you live can dramatically change how much is spent to keep you healthy.
In some states, public health departments have robust budgets to fund disease prevention, vaccine clinics, maternal health programs, and environmental safety efforts. In others, those same departments are scraping by with minimal resources, forced to make tough choices about what they can afford to protect — and what they can’t.
Take Texas and Vermont. One is spending barely $17 per person on public health at the state level. The other? Closer to $84 per person, not counting federal supplements. And while Vermont’s relatively small, rural population makes its challenges different, it’s no coincidence that the state consistently ranks high in health outcomes.
Meanwhile, parts of Texas, including the epicenter of the country’s largest measles outbreak, have seen decades of stagnant vaccine funding and now face the consequences.
When you compare the numbers nationally, the disparities are hard to ignore. The District of Columbia leads all states in CDC public health funding at $314 per person, while Florida and New Jersey hover just under $35. Even within the same state, counties like Sumter in Florida are spending more than double their neighbors.
The National Picture: Big Spending in Small Pockets
To get a sense of the scale here, think about this: in 2023, the Centers for Disease Control and Prevention (CDC) provided more than $15 billion in grants to state and local public health departments. But where that money landed, and how much it added to each person, varies dramatically.
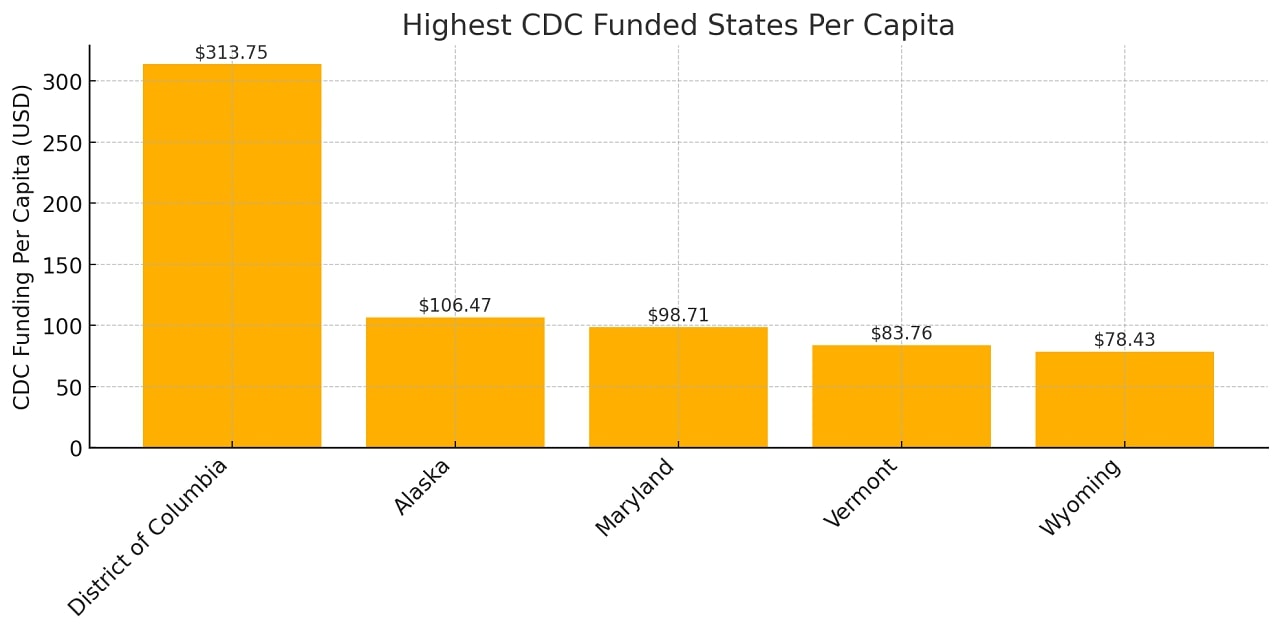
Here are the top five states (and DC) in terms of CDC funding per capita in FY2023:
And now, contrast that with the bottom end of the list:
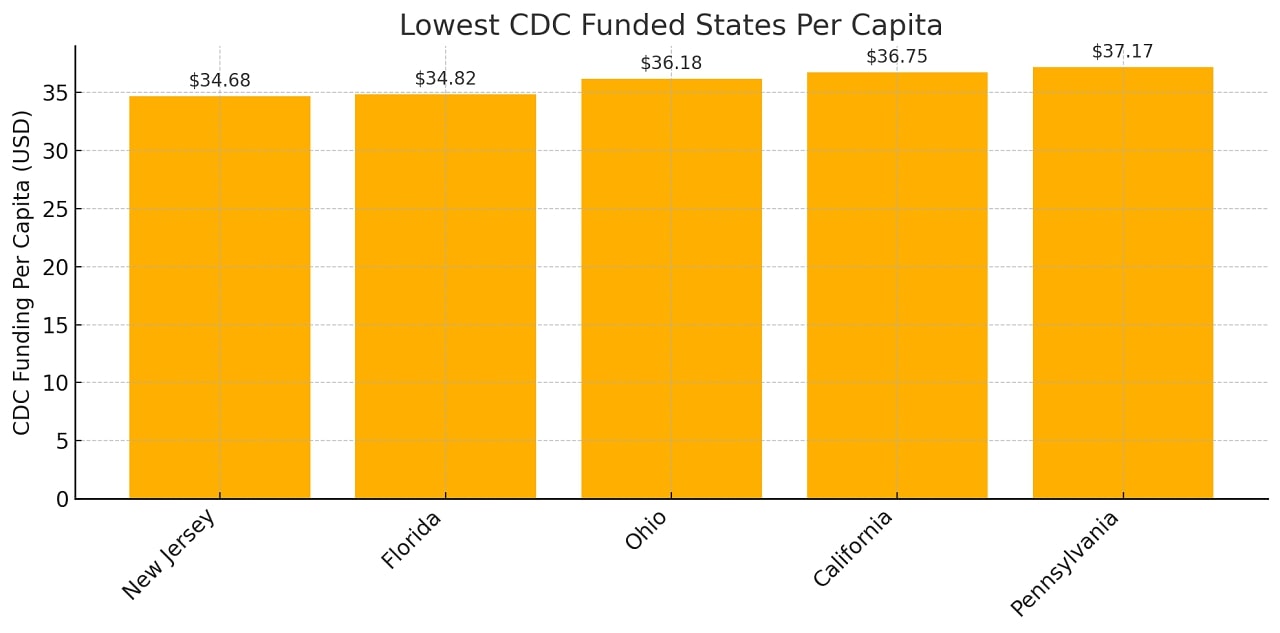
So while D.C. got more than $300 per person, states like Florida and New Jersey hovered closer to $35. That’s nearly a ninefold difference.
But federal grants are just one part of the picture.
CDC Public Health Funding Per Capita by State (FY2023)
| State | CDC Funding ($) | Population (2023) | Per Capita Funding ($) |
| District of Columbia | $215,646,905 | 687,324 | $313.75 |
| Alaska | $78,415,328 | 736,510 | $106.47 |
| Maryland | $613,698,053 | 6,217,062 | $98.71 |
| Vermont | $54,336,106 | 648,708 | $83.76 |
| Wyoming | $45,886,088 | 585,067 | $78.43 |
| Rhode Island | $85,401,584 | 1,103,429 | $77.40 |
| South Dakota | $62,147,350 | 918,305 | $67.68 |
| Hawaii | $96,733,310 | 1,441,387 | $67.11 |
| Louisiana | $302,899,275 | 4,588,071 | $66.02 |
| North Dakota | $51,580,697 | 789,047 | $65.37 |
| Delaware | $67,726,502 | 1,036,423 | $65.35 |
| Montana | $71,031,055 | 1,131,302 | $62.79 |
| New Mexico | $128,449,197 | 2,121,164 | $60.56 |
| Georgia | $661,475,936 | 11,064,432 | $59.78 |
| Maine | $81,415,492 | 1,399,646 | $58.17 |
| West Virginia | $92,725,349 | 1,770,495 | $52.37 |
| Mississippi | $150,162,604 | 2,943,172 | $51.02 |
| Nebraska | $100,992,532 | 1,987,864 | $50.80 |
| New Hampshire | $70,744,983 | 1,402,199 | $50.45 |
| Virginia | $425,564,280 | 8,734,685 | $48.72 |
| Oklahoma | $195,344,894 | 4,063,882 | $48.07 |
| Arkansas | $144,885,945 | 3,069,463 | $47.20 |
| New York | $929,068,432 | 19,737,367 | $47.07 |
| Massachusetts | $318,445,881 | 7,066,568 | $45.06 |
| Alabama | $228,899,186 | 5,117,673 | $44.73 |
| Nevada | $143,614,725 | 3,214,363 | $44.68 |
| Iowa | $141,687,870 | 3,218,414 | $44.02 |
| Connecticut | $160,298,958 | 3,643,023 | $44.00 |
| Kentucky | $197,332,252 | 4,550,595 | $43.36 |
| Tennessee | $307,906,733 | 7,148,304 | $43.07 |
| South Carolina | $229,349,059 | 5,387,830 | $42.57 |
| Washington | $329,560,881 | 7,857,320 | $41.94 |
| Arizona | $312,873,617 | 7,473,027 | $41.87 |
| Minnesota | $240,774,688 | 5,753,048 | $41.85 |
| Kansas | $122,841,170 | 2,951,500 | $41.62 |
| Idaho | $81,937,100 | 1,971,122 | $41.57 |
| Texas | $1,276,679,298 | 30,727,890 | $41.55 |
| Oregon | $174,851,574 | 4,253,653 | $41.11 |
| North Carolina | $437,341,472 | 10,881,189 | $40.19 |
| Illinois | $502,953,384 | 12,642,259 | $39.78 |
| Colorado | $234,231,316 | 5,901,339 | $39.69 |
| Missouri | $244,358,133 | 6,208,038 | $39.36 |
| Utah | $134,602,738 | 3,443,222 | $39.09 |
| Indiana | $260,367,885 | 6,880,131 | $37.84 |
| Wisconsin | $222,274,471 | 5,930,405 | $37.48 |
| Michigan | $377,272,064 | 10,083,356 | $37.42 |
| Pennsylvania | $483,901,640 | 13,017,721 | $37.17 |
| California | $1,440,414,672 | 39,198,693 | $36.75 |
| Ohio | $427,839,851 | 11,824,034 | $36.18 |
| Florida | $797,503,095 | 22,904,868 | $34.82 |
| New Jersey | $325,300,258 | 9,379,642 | $34.68 |
- D.C. is in a league of its own: With over $313 per person, the District of Columbia receives more than 9 times the funding of Florida and New Jersey. This reflects its unique status and concentration of federal agencies, as well as a smaller population.
- Alaska, Vermont, and Maryland punch above their weight: Despite smaller populations, these states get significantly more per person, likely due to rural health challenges, aging populations, and strong state-level public health programs.
- Large states lag in per capita terms: States like California, Florida, and Texas, which have enormous public health needs, and are near the bottom on a per-resident basis. Their overall funding totals are high, but those dollars are stretched thin.
- Southern states show mixed performance: Louisiana and Mississippi score fairly well per capita, while states like Alabama and Georgia fall closer to the middle. Texas is near the bottom, despite current public health crises (like measles outbreaks).
- Wealthier Northeastern states are spread out: New York and Massachusetts do relatively well in raw dollars, but not in per capita terms, possibly because of larger, denser populations and reliance on state/local funds outside of CDC grants.
Public Health vs. Health Care: Let’s Not Mix Those Up

When we talk about public health spending, we’re not talking about the dollars that cover your visit to the doctor or the hospital.
That’s clinical care. Public health is about keeping populations healthy, often through preventive efforts: vaccine programs, environmental health monitoring, substance use prevention, sanitation, maternal health services, and more.
It’s not glamorous. And when it works, people hardly notice.
But when it doesn’t? Outbreaks spread, chronic diseases go unmanaged, and communities suffer — sometimes quietly, sometimes in headlines.
Who Spends the Most Overall?
Some states and counties pull far ahead of others in total health care expenditures per resident, which includes both public health and clinical care.
Here are the big spenders at the state level from 2019 data:
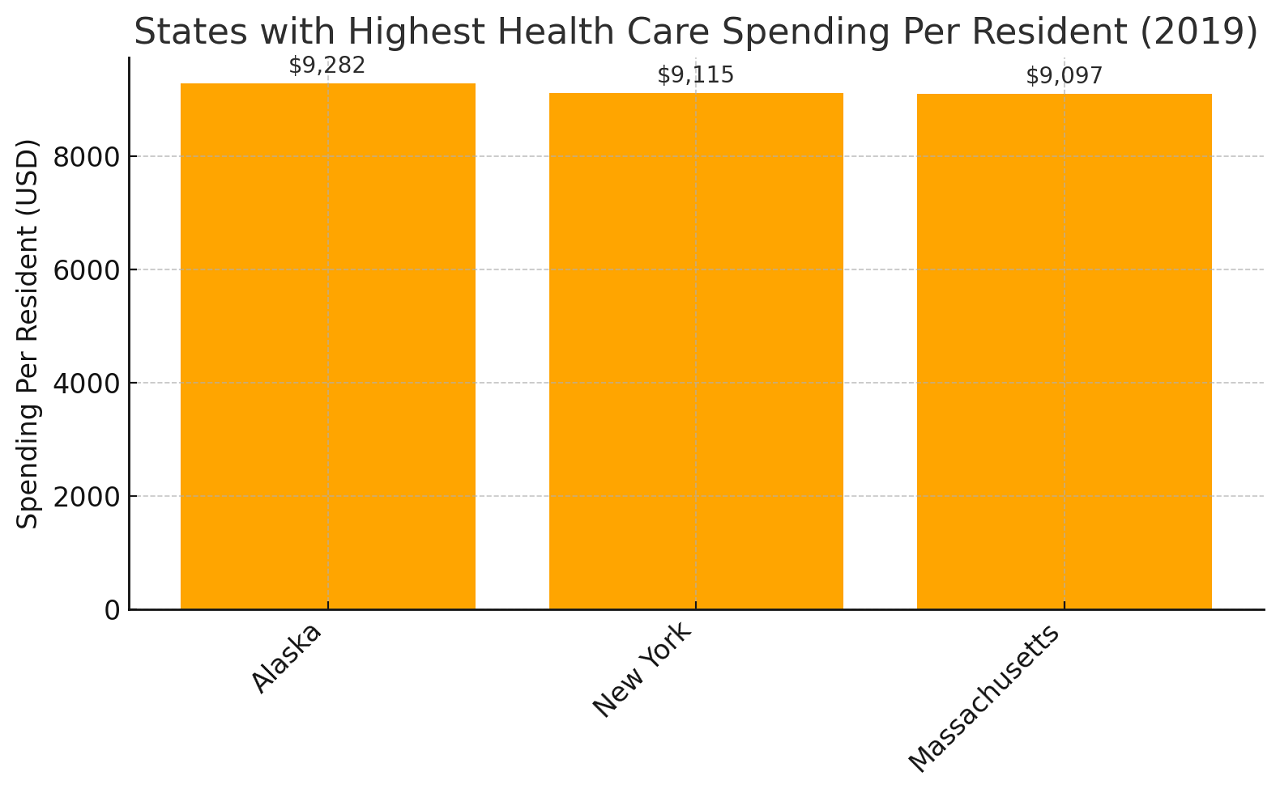
- Alaska: $9,282 per resident
- New York: $9,115 per resident
- Massachusetts: $9,097 per resident
Compare that with the states spending the least:
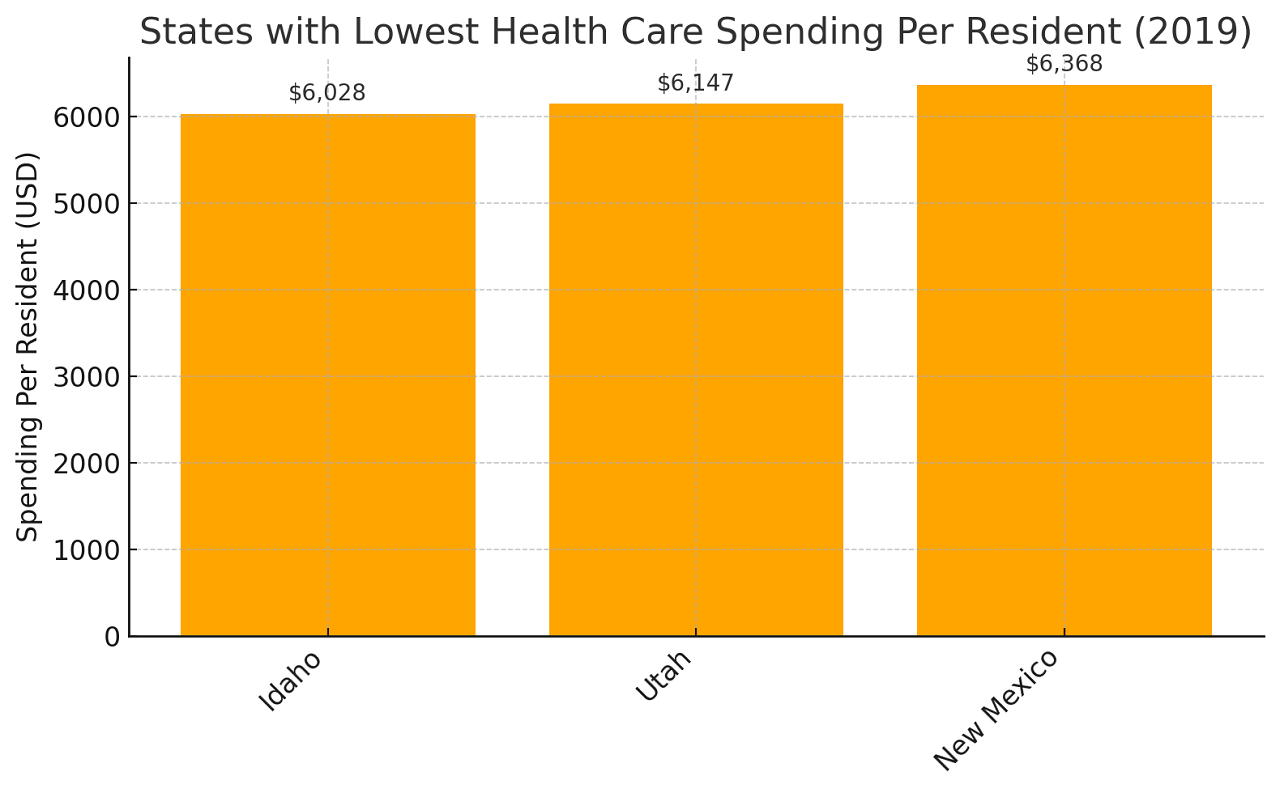
- Idaho: $6,028 per resident
- Utah: $6,147 per resident
- New Mexico: $6,368 per resident
That’s more than a $3,000 gap per person between Alaska and Idaho.
County-Level Shakeups: Even Bigger Gaps
Now zoom in to the county level and it gets even more interesting — and chaotic.
Take Sumter County, Florida, a suburban area near Orlando. It leads the nation in Medicare per-capita spending at a whopping $18,284 and ranks eighth overall in total per-resident health care spending according to the Sumter Times. Compare that to Gadsden County, just a few hours up the road near Tallahassee, where per-resident spending is $4,698.
Same state. Wildly different funding levels.
Politico notes that in New York, where spending is relatively high statewide, Nassau County stands out — $13,332 per capita, the highest in the country. That’s nearly four times what you see in Idaho’s Clark County, where the total is just $3,410.
What’s behind the disparity? A few things.
Utilization is the Big Driver
The biggest reason some places spend more isn’t because people are necessarily sicker; it’s that they use more health services. According to a massive study from JAMA, utilization rates explain about 65% of the variation in health care spending across counties.
So what affects utilization?
- Insurance coverage (people with coverage use more services — no surprise there)
- Income levels (higher incomes can mean better access to care)
- Obesity rates (linked to greater use of chronic disease care)
Only 7% of the variation is explained by actual disease prevalence. So yes, utilization is the name of the game.
Emergency Department: Small Piece, Fastest Growth

Emergency department care only accounted for 2% of all health care spending, but it had the fastest growth rate according to some studies. That’s not necessarily great news — ED care is expensive and often used when preventive care has failed.
And the variation is massive. Counties in Texas, for example, had some of the lowest ED spending per capita, but also the widest gaps within the state.
Better insurance coverage and more accessible primary care could pull those numbers down over time. Experts like Dr. Joseph Dieleman at IHME point to that as a necessary shift.
Type 2 Diabetes: The $144 Billion Elephant in the Room
One condition alone topped the spending charts: type 2 diabetes, costing $144 billion in 2019, as noted by healthdata.org.
And get this: In Sumter County, the same Florida community already topping the charts, spending for diabetes care hit $1,216 per person — the highest in the nation. In some counties in Georgia, Alaska, and Colorado, diabetes spending was 90% lower.
What’s going on? Prevention matters. So does age. Sumter has a large elderly population, which comes with more chronic conditions like diabetes. Meanwhile, younger, healthier populations (like in Utah) naturally drive down spending.
Public Health Spending vs. Public Health Outcomes
Let’s pause to connect the dots.
High spending doesn’t always mean better outcomes. But very low spending, especially on core public health infrastructure, often does mean cracks in the system.
Take Texas. Despite being the second most populous state in the country, it spends just $17 per person on public health. And it shows. The state is currently the epicenter of a measles outbreak — a disease the U.S. eliminated back in 2000.
Why? Local health departments were already underfunded, with stagnant immunization budgets that hadn’t increased in 15 years. When pandemic-era federal money dried up, so did many of the programs that were helping keep vaccine rates stable.
Now, 540+ measles cases have cropped up in Texas alone, two children have died, and health departments are scrambling to contain the spread.
How Low Vaccine Funding Leads to High Risk
Lubbock County, Texas, gets just $254,000 a year for immunization programs. That once funded three nurses and public education campaigns. Today? It barely covers one nurse and a piece of an admin assistant.
The result? Gaps in coverage, fewer mobile clinics, fewer school outreach programs, and an easier path for preventable diseases to spread.
Other places hit hard by vaccine program cuts include:
- Washington State, which had to pause its Care-A-Van mobile vaccination program
- Connecticut, facing the loss of $26 million in immunization-related funding
- Dallas County, which canceled more than 50 immunization clinics
Meanwhile, vaccine hesitancy is on the rise, and fewer kids are getting routine shots. According to the Stanford report in 2023, only 92.7% of kindergartners were fully vaccinated. The herd immunity threshold? 95%. We’re below it.
The Role of Politics and Policy
Public health funding is often at the mercy of politics. During COVID-19, state and local health departments saw a rare influx of federal support. But now, with that money gone and some officials actively pushing cuts (including $2 billion stripped from immunization programs earlier this year), the system is showing its cracks.
In states like Texas, where legislation is making it easier to skip vaccines, the risks multiply fast.
One measles outbreak now affects more than 20 counties in West Texas. Some families are driving over an hour to find an open clinic. In the counties hit hardest, just 82% of kindergartners have received their measles, mumps, and rubella (MMR) vaccine.
And that’s not just a Texas problem, it’s a national warning sign.
Methodology
We pulled state-level CDC funding data from FY2023, paired with U.S. Census population estimates to calculate per capita figures.
Spending comparisons were grounded in verified data from the Institute for Health Metrics and Evaluation (IHME), JAMA, and state health departments.
To highlight real-world effects, we reviewed recent case studies from states like Texas and Florida facing public health crises.
County-level disparities were analyzed using federal Medicare and Medicaid reports, alongside localized spending metrics.
We focused on both public health (preventive programs) and total health care expenditures to clarify what’s being spent and where.
All sources were cross-referenced with academic and policy analysis to ensure accuracy and relevance.
Final Thoughts
Sure, more money doesn’t always equal better outcomes. But consistent, strategic investment in public health does pay off — in longer lives, fewer outbreaks, and less strain on hospitals.
The wide variation in state and local public health spending isn’t just a quirk of budgeting. It reflects values, priorities, and often, politics.
When public health works, you don’t see it. You don’t get sick. Your kids stay in school. Your grandparents don’t end up in the hospital for preventable reasons.
But when public health is underfunded, undercut, or ignored? You get outbreaks, burnout, and a patchwork system that can’t hold together under pressure.
If the numbers tell us anything, it’s this: some communities are investing in the future of health, and others are gambling with it.
So the next time you see a health department grant in the news or a line item in a state budget, it might be worth paying attention. Because what’s spent today could mean the difference between stability and crisis tomorrow.
References
- Centers for Disease Control and Prevention (CDC) – Table for STATE System Appropriations Grants: Total Funding
- Texas Tribune – Texas Coronavirus Health Funding
- Sumter Times – Sumter County Residents Received $87.39 Million Per Capita From Medicaid Transfers in 2022
- JAMA Health Forum – Understanding Geographic Variation in U.S. Health Care Spending
- HealthData.org (IHME) – Most Comprehensive Study of U.S. Health Care Spending by County Reveals Massive Disparities
- Stanford News – What to Know About the Measles Outbreak, Vaccine Safety, and Immunization
- The Washington Post – The Washington Post (General Reference – Specific article not linked)