
Health insurance plays a critical role in the lives of millions across the United States. Coverage can be obtained through private or public programs, with each serving different needs and demographics.
Private insurance, often provided by employers or purchased individually, covers the majority of Americans. Public programs such as Medicare and Medicaid, however, have grown significantly over time, offering a safety net for low-income households, children, and older adults.
Despite the progress made in reducing uninsured rates, gaps persist due to economic disparities and differences in state policies.
Leveraging technology can make navigating the healthcare system more efficient and less overwhelming. If you are looking for a reliable telemedicine app to access healthcare conveniently click here.
Such apps provide direct access to medical professionals, simplify the process of managing prescriptions, and improve overall healthcare accessibility, particularly for those in underserved areas.
This article examines the scope of private and public health insurance, comparing their coverage reach, associated spending, and the population segments they serve.
How Private Insurance Became the Dominant Choice

Private insurance has long been the primary method of health coverage in the United States. As of 2023, it covered 68.6 percent of Americans, with employer-sponsored plans accounting for the largest share at 54.7 percent.
Direct-purchase plans, which include marketplace options under the Affordable Care Act (ACA), covered another 13.9 percent. These plans are crucial for workers and families who are not eligible for public programs like Medicaid or Medicare.
Private insurance provides access to a wide network of providers, often with more flexibility and specialized care than public programs. However, the rising cost of premiums, deductibles, and out-of-pocket expenses has made it less accessible for lower-income households.
Employer-Sponsored Insurance – The Backbone of Private Coverage
- In 2023, 180 million Americans relied on employer-based insurance, making it the largest coverage source.
- Employers typically pay a significant share of premiums. For single coverage in 2023, employers covered approximately 83 percent of the cost, while employees paid the remaining 17 percent.
- Larger companies (200+ employees) are more likely to offer insurance, with 98 percent providing health benefits in 2023, compared to only 39 percent of small businesses.
Direct-Purchase Plans – A Growing Alternative
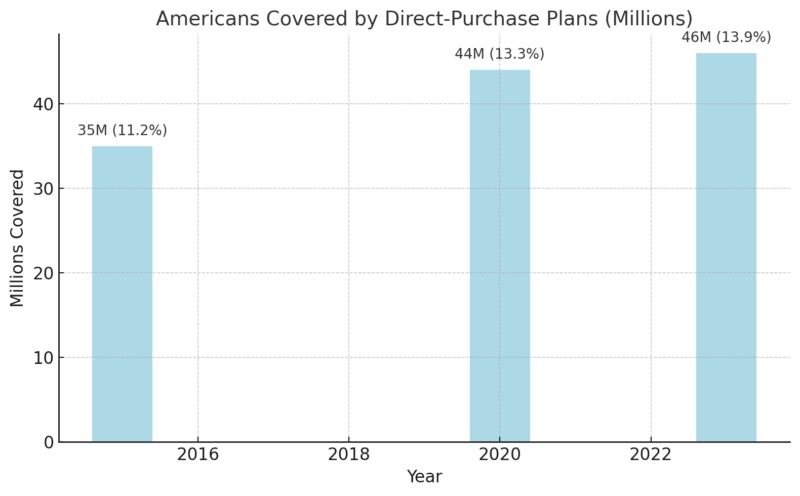
- Direct-purchase plans have grown due to the ACA’s marketplaces, premium tax credits, and Medicaid expansion in many states.
- These plans often include essential health benefits, such as maternity care and mental health services, mandated by the ACA.
Challenges Facing Private Insurance
- Cost Barrier: The average annual premium for employer-sponsored family coverage in 2023 was $23,968, with employees contributing approximately $6,575.
- High Deductibles: Deductibles for single coverage have increased by over 60 percent in the past decade, averaging $1,669 annually in 2023.
- Affordability Gap: Households earning less than $25,000 annually often find private insurance out of reach, with only 13.3 percent covered through employer plans.
Medicaid and Medicare – Supporting Those in Need
Medicare and Medicaid are both government-funded health insurance programs, but they’re very different in who they serve, how they’re funded, and who oversees and administers them. Explore our new resource: https://t.co/xnLxIiFU4S pic.twitter.com/5OQFdBretP
— ASHA (@ASHAWeb) October 30, 2024
Medicaid and Medicare serve as the cornerstone of public health insurance in the United States, covering low-income families, older adults, and individuals with specific health needs.
In 2023, 21.3 percent of Americans relied on Medicaid and the Children’s Health Insurance Program (CHIP), while 18.8 percent were covered by Medicare. These programs are vital for ensuring access to healthcare among vulnerable populations.
Medicaid operates as a federal-state partnership, offering benefits that vary by state, while Medicare provides nationwide coverage for individuals aged 65 and older, as well as younger people with disabilities. Combined, these programs account for nearly 42 percent of total health consumption expenditures (HCE) in the United States.
Medicaid and CHIP Enrollment Trends
Year
Medicaid/CHIP Enrollment (Millions)
Share of Population (%)
2015
62.4
19.4
2020
77.3
23.5
2023
70
21.3
- Medicaid enrollment spiked during the COVID-19 pandemic, growing by 30 percent between February 2020 and December 2022 due to policies like continuous enrollment provisions in the Families First Coronavirus Response Act.
- CHIP primarily covers children in families earning too much to qualify for Medicaid but not enough for private insurance.
Medicare Coverage and Spending
- 62 million Americans relied on Medicare in 2023, including 93.8 percent of those aged 65 and older.
- Medicare spending in 2022 was $944 billion, accounting for 22.2 percent of HCE.
- The aging U.S. population continues to drive Medicare enrollment, with those aged 65 and over growing as a share of the total population.
Challenges and Gaps
- Medicaid Expansion Variability: As of 2023, 41 states and jurisdictions expanded Medicaid eligibility under the ACA. States that did not expand eligibility had higher uninsured rates among working-age adults.
- Gaps in Medicare Coverage: Medicare does not cover all expenses. Beneficiaries often need supplemental insurance for dental, vision, and long-term care services.
- Disparities in Medicaid Access: Administrative hurdles and eligibility cuts during Medicaid unwinding processes in 2023 led to many losing coverage.
Why Employer-Based Insurance Still Matters
View this post on Instagram
Employer-sponsored health insurance (ESI) has long been the foundation of the U.S. healthcare system, covering 54.7 percent of the population in 2023. Its significance lies not only in the number of Americans it covers but also in its role as a critical workplace benefit that attracts and retains employees.
However, ESI faces growing pressure from rising costs and economic shifts.
The Reach of Employer-Sponsored Insurance
- In 2023, approximately 180 million Americans were covered by ESI.
- Workers at large firms (200+ employees) were 2.5 times more likely to have access to employer-sponsored insurance compared to workers at small firms.
Cost of Employer-Sponsored Plans
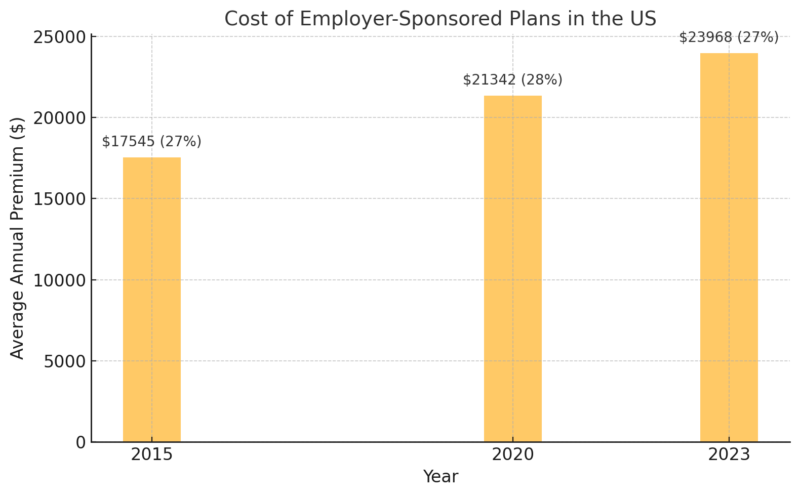
- Despite rising premiums, employee contributions have remained relatively stable at around 27 percent of total costs.
- Out-of-pocket costs, including deductibles and copayments, continue to grow, impacting affordability for low- and middle-income workers.
Economic Impact on Coverage
- Part-Time Workers: Many part-time employees are not eligible for ESI, leaving them dependent on public insurance or uninsured.
- Industry Differences: High-income industries (e.g., technology) are more likely to offer comprehensive health benefits than low-wage sectors like retail and hospitality.
- Access for Dependents: ESI often extends to employees’ families, covering spouses and children. However, dependent coverage costs are a significant financial burden for many households.
The Expanding Reach of Public Health Programs
Public health programs such as Medicaid, CHIP, and Medicare have steadily grown to cover more Americans, especially since the Affordable Care Act expanded Medicaid eligibility in participating states.
As of 2023, 36.1 percent of Americans were covered by public health insurance, reflecting the importance of these programs in providing healthcare access to vulnerable populations.
Medicaid Expansion and Its Impact
- 41 states adopted Medicaid expansion under the ACA, leading to significant decreases in uninsured rates.
- In Medicaid expansion states, the uninsured rate for children was 4.6 percent, compared to 8.3 percent in non-expansion states.
- Expansion states also saw a higher percentage of working-age adults covered, particularly among those earning below 138 percent of the federal poverty level.
CHIP and Its Role in Children’s Health Coverage
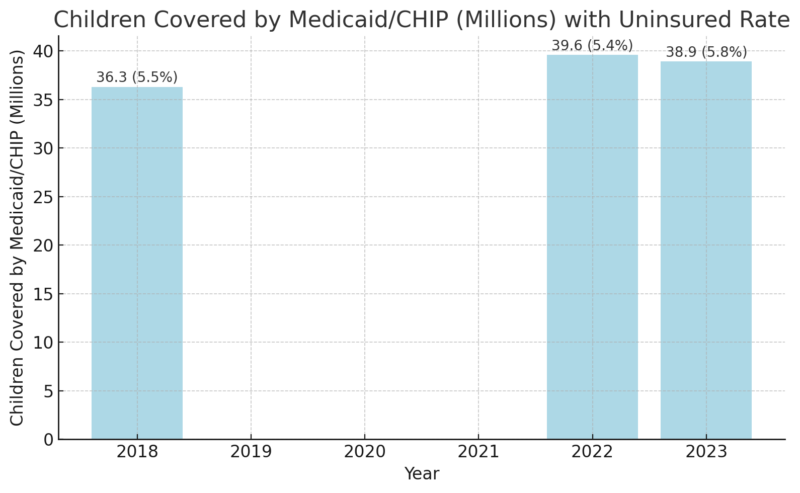
- CHIP complements Medicaid by focusing on families with incomes above Medicaid thresholds but without access to affordable private coverage.
- Continuous enrollment policies during the COVID-19 pandemic boosted coverage, but disenrollments in 2023 reversed some gains.
Public Programs in Rural and Low-Income Communities
- Rural populations heavily rely on Medicaid and Medicare, with public programs covering 43 percent of rural residents.
- Low-income households earning below $25,000 are 71 percent dependent on public health insurance, underlining its critical safety-net function.
Uninsured Americans: The Cost of Being Left Out
Despite improvements, 26 million Americans (7.9 percent) were uninsured in 2023. Uninsured individuals face significant barriers to healthcare, higher out-of-pocket costs, and worse health outcomes. The reasons for being uninsured often vary by income, state policies, and employment status.
Barriers to Insurance Coverage
- Affordability: A 2022 KFF study found that 64 percent of uninsured working-age adults cited high costs as the primary reason for lacking coverage.
- Income Gaps: Many uninsured fall into a “coverage gap,” earning too much to qualify for Medicaid but too little to afford marketplace premiums.
- State Decisions: States that did not expand Medicaid under the ACA have uninsured rates nearly double those of expansion states.
Demographics of the Uninsured
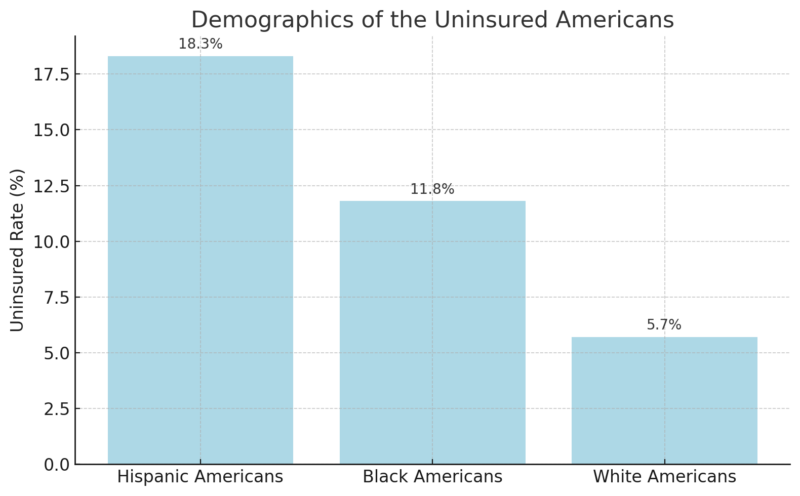
Hispanic and Black Americans experience disproportionately high uninsured rates due to systemic inequalities and barriers such as language, immigration status, and lower employer-based coverage access.
Income, Age, and Education: Factors That Define Coverage
Health insurance access in the United States is heavily influenced by socioeconomic and demographic factors. Higher-income and education levels correlate strongly with private insurance coverage, while lower-income households and older adults depend more on public programs.
Coverage by Income Level
Income Bracket
Employer Coverage (%)
Public Coverage (%)
Less than $25,000
13.3
71.2
$25,000–$50,000
33.3
53.4
$150,000 or more
81.5
12.4
- Higher-income households have greater access to employer-based plans and supplemental insurance.
- Public programs play a crucial role for low-income households that cannot afford private insurance.
Age as a Determinant
- Children under five and adults over 65 have the highest rates of public health insurance coverage, at 38 percent and 94.1 percent, respectively.
- Working-age adults (19–64) are more likely to rely on employer-sponsored insurance, with 63.3 percent covered in 2023.
Education and Coverage
- Americans with graduate degrees are 83 percent covered by employer-sponsored insurance, compared to 29 percent for those without a high school diploma.
- Education impacts employment opportunities, which in turn affects access to employer-sponsored insurance.
FAQs
The Bottom Line
Private insurance continues to cover the majority of Americans, but public programs like Medicaid and Medicare are critical for vulnerable populations. Each system has its unique challenges, from cost barriers in private insurance to limited services in public programs.