

Across the United States, borrowing for higher education has exploded over the past two decades.
What began as a relatively small component of household finance is now a central feature of the U.S. economy.
The Education Data Initiative estimates that total student loan debt – including federal and private loans – topped $1.833 trillion as of late 2025, making it one of the largest categories of consumer credit.
Only mortgages account for a larger share of household debt, and the average federal student‑loan borrower now carries roughly $39,547 in debt.
This burden is not just a personal problem; high debt levels delay homeownership and entrepreneurship and influence the broader economy.
National Student Loan Debt Overview
View this post on Instagram
Aggregate Debt and Growth Trends
- Total outstanding debt: The Education Data Initiative reports that U.S. student loan debt stood at $1.833 trillion in 2025.
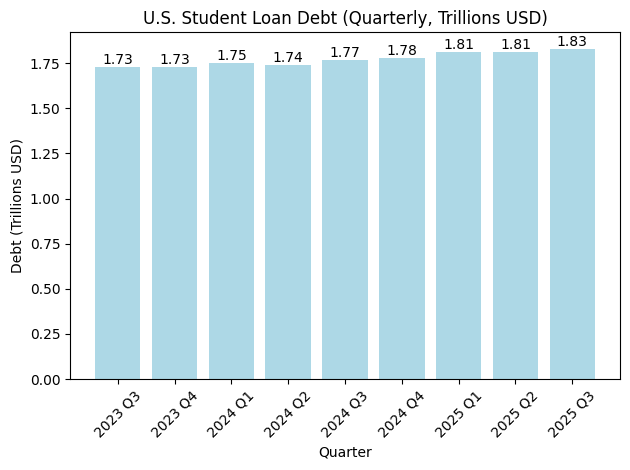
- Quarterly trajectory: After shrinking for the first time in decades during 2023, the national balance resumed growth in 2024 and 2025.
- In 2023, the total debt declined year‑over‑year in both Q3 and Q4.
- By 2024 Q3, growth returned: the total rose to $1.773 trillion, a 2.33 % increase from the same quarter a year earlier.
- Growth accelerated in 2025; by Q3 2025, the balance had climbed to $1.833 trillion, up 3.39 % from the previous year.
The table below summarizes these quarterly totals. In the following plots, we convert the figures from millions of dollars (as reported) to trillions.
Annual Trends
Student‑loan debt has increased almost every year since the early 2010s. The annual series below shows totals at the end of each fiscal year (FY Q4).
After climbing steadily throughout the 2010s, the balance dipped in 2023 before rebounding in 2024.
Year
Total student loan debt (US$ trillions)*
YoY change
2024
1.78
+2.85 %
2023
1.73
–1.98 %
2022
1.76
+1.77 %
2021
1.73
+2.34 %
2020
1.69
+3.42 % (COVID‑era relief slowed growth)
2019
1.64
+4.53 %
2018
1.57
+5.24 %
2017
1.49
+5.95 %
2016
1.41
+6.44 %
2015
1.32
+6.84 %
2014
1.24
+7.87 %
2013
1.15
+8.63 %
2012
1.05
+9.87 %
2011
0.96
+12.2 %
Totals are converted from millions as reported by the Education Data Initiative to trillions (1 trillion = $1 × 10^12).
The slowdown seen in 2023–2024 reflects the end of the pandemic‑era payment pause and the resumption of repayments. Still, the overall upward trajectory means the student‑loan portfolio grew by roughly $60 billion between 2024 Q4 and 2025 Q3.
1.3 Visualizing the Debt Trajectory
The following charts illustrate how national student debt has evolved. The first graph tracks quarterly totals from 2021 to 2025, while the second shows annual totals since 2011.
These visualisations underscore the rapid rise in the early 2010s, the brief plateau in 2023, and the return to growth through 2025.
Federal vs. Private Student Loans
Portfolio Composition and Average Balances
The U.S. student loan system is dominated by federal lending. According to the Education Data Initiative, about 90.9 % of all outstanding student debt is held by the federal government, leaving 9.1 % to private lenders.
Federal loans, therefore, total roughly $1.69 trillion (as of September 2025), while private loans make up about $167 billion.
Federal borrowers tend to owe more than private borrowers. A September 2025 analysis found that the average federal loan balance is $39,547, according to Fool. When private loans are included, the average total balance may reach $42,673.
Borrowing levels vary greatly by institution type: students who attend public universities typically borrow around $31,835 to complete a bachelor’s degree, while those at private universities borrow roughly $39,548.
Refinance Loans and Co‑signers
Refinance loans – private loans used to pay off federal or other private loans – are a small but growing segment. In 2025 Q3, refinance loans accounted for about $29.7 billion of private student‑loan debt (roughly 17.7 % of private balances).
Private lending frequently requires co‑signers; Education Data research suggests that over 92 % of private undergraduate loans and nearly 68 % of graduate loans had co‑signers in recent years (data from 2024 Q1, not shown here).
Federal Loan Programs by Type
The federal portfolio consists mainly of Direct loans (Stafford, PLUS, and consolidation loans). As of September 2025, the Department of Education reported the following breakdown:
Loan type
Outstanding balance (US$ billions)
Share of federal debt
Direct Loans
1,529
≈ 90 %
Federal Family Education Loan (FFEL) Program
161
≈ 9 %
Perkins Loans
3
< 1 %
Stafford loans account for the majority of Direct loans; about 18 % of outstanding federal debt is in subsidized Stafford loans and 36.7 % in unsubsidized Stafford loans.
PLUS loans (Grad PLUS and Parent PLUS) make up roughly 13.5 % of the federal portfolio, and consolidation loans represent around 31.6 %.
Delinquency, Default, and Repayment Trends

Rising Delinquency After the Repayment Pause
Federal student loan payments were paused between March 2020 and September 2023. When repayment resumed, delinquencies rose sharply.
The New York Federal Reserve’s Household Debt and Credit Report noted that by Q2 2025, student‑loan balances increased to $1.64 trillion, and 10.2 % of the aggregate balance was at least 90 days delinquent.
The report attributed the spike to previously unreported missed payments from the pandemic period returning to credit reports.
By Q4 2025, the New York Fed recorded that student‑loan balances rose to $1.66 trillion, and 9.6 % of balances were 90 days past due. Although the delinquency rate fell slightly from Q2 to Q4, it remained elevated relative to pre‑pandemic levels.
Defaults and Private‑loan Performance
Education Data Initiative statistics show that 10 % of federal student‑loan dollars were delinquent as of 2025 Q4. Private student‑loan default rates were lower, with about 1.62 % of private loans in default by 2025 Q3.
These differences partly reflect federal protections like income‑driven repayment, deferment,t and forbearance, which can keep borrowers out of default but may also extend repayment periods.
Monthly Payments and Financial Stress
Repayment burdens vary widely. Federal data compiled by the Education Data Initiative put the average monthly payment for student‑loan borrowers at $277, while the average auto loan payment was $719 and the average mortgage payment was $2,124.
Surveys cited by SoFi found that about 16 % of borrowers were at least 60 days delinquent on their payments in November 2025.
Many borrowers faced additional pressures from credit‑card and auto‑loan debt; high interest rates and the rising cost of living have made it difficult to resume payments.
Borrower Demographics
More than 42 million borrowers have ~$1.6 trillion in outstanding student loans.
That’s why ED resumed collections on its defaulted student loan portfolio: Because if you take out student loans, you must pay them back.
Learn more: https://t.co/W3yzko4hiT pic.twitter.com/nIt8Ie7ua9
— U.S. Department of Education (@usedgov) July 16, 2025
Age and Degree Level
Student debt affects millions of Americans across age groups. The Department of Education estimates that 42.8 million borrowers hold federal student loans.
Data compiled by The Motley Fool show how debt is distributed across age bands: borrowers aged 25–34 owe about $480 billion, while those 35–49 owe $675 billion, the largest share among age groups.
Borrowers under 24 owe $94 billion, and those over 62 hold about $137 billion. Younger borrowers typically have smaller balances because they have taken on fewer graduate or professional loans.
Gender and Race Disparities
Education Data reports highlight notable disparities. Among bachelor’s degree holders, 49.3 % of women and 41.9 % of men borrow federal loans.
Women tend to borrow about 3.6 % more than men for a bachelor’s degree, while female associate’s degree holders borrow 14.2 % more than their male counterparts (data from 2024).
Racial disparities are even more pronounced: Black graduates are the most likely to borrow, with 82.9 % taking federal loans. Four years after graduation, Black or African American borrowers owed roughly $25,000 more on average than White borrowers.
Nearly 48 % of Black borrowers still owed more than they initially borrowed four years after graduation, compared with 17 % of White borrowers.
Debt by Educational Attainment
Federal debt balances tend to rise with higher degrees. Education Data estimates that associate’s degree holders owe about $20,340, bachelor’s degree holders $29,550, and graduate degree holders up to $102,790.
Professional doctorates (e.g., MDs and JDs) have the highest balances; an average medical‑school graduate owed nearly $280,000 in graduate debt alone in 2025.
These figures help explain why older borrowers – who are more likely to have completed graduate or professional programs – carry larger balances.
Public Support and Policy Landscape

Support for Debt Relief
Public opinion on student‑loan forgiveness is mixed. A June 2022 NPR/Ipsos poll found that 55 % of Americans supported canceling up to $10,000 in federal student loans, while 47 % supported forgiveness of up to $50,000.
Support declined for full cancellation, with 41 % favoring forgiving all student debt. Borrowers themselves were more supportive: 84 % of those with student loans endorsed $10,000 of forgiveness, and 78 % supported $50,000.
5.2 Existing Relief Programs
The federal government operates several forgiveness and discharge programs. Public Service Loan Forgiveness (PSLF) forgives balances for borrowers who work in public service and make 120 qualifying payments.
However, only about 3.3 % of applications have been approved since the program’s inception (data as of 2023). The Teacher Loan Forgiveness program has forgiven roughly $197 million in loans for about 10,100 teachers.
The CARES Act introduced a payment and interest pause from March 2020 through August 2023, which temporarily reduced defaults and delinquencies.
5.3 Fraud and Servicing Issues
The complexity of student‑loan repayment makes borrowers vulnerable to scams and servicing errors. Federal regulators have warned borrowers never to share their FSA ID and to be wary of companies promising immediate forgiveness.
Complaints to the Consumer Financial Protection Bureau cite misapplied payments, lost documents, and misrepresentations by servicers. The CFPB and state attorneys general have pursued enforcement actions against companies offering fraudulent debt‑relief services.
Economic and Social Impacts
@abcnews Americans’ household debt levels – including mortgages, car loans, credit cards and student loans – are now at a new record high, data shows. Total household debt reached $18.59 trillion from July through September of this year, up by $197 billion from the previous quarter. Overall debt levels are up by $4.4 trillion since the end of 2019, just before the pandemic recession. #abcnews #news #money #debt #finances ♬ original sound – ABC News
Student debt has broad effects on the economy and on borrowers’ life choices. Analysts at the Peterson Foundation note that student debt (about $1.60 trillion in 2023) is the third‑largest category of household debt after mortgages and auto loans.
Rising balances delay homeownership: a Federal Reserve study found that student debt accounted for around 20 % of the decline in homeownership rates among young adults after the Great Recession.
High debt burdens also reduce net worth; households with student debt had a net worth more than three times lower than the general population in 2022.
On an individual level, the Education Data Initiative reports that 20 % of adults with undergraduate degrees and 24 % of postgraduate degree holders carry student loan debt (data not shown here).
High monthly payments can force borrowers to delay saving for retirement, starting families, or pursuing entrepreneurial ventures.
The SoFi survey referenced earlier found that many borrowers prioritize other debts – such as credit cards and auto loans – over student loans when faced with budget constraints.
Conclusion

Student loan debt remains a defining feature of the American financial landscape. After a brief slowdown during the pandemic, total student‑loan debt resumed its upward climb, reaching $1.83 trillion by late 2025.
Federal loans dominate the market, accounting for over 90 % of outstanding balances and averaging around $39,547 per borrower.
Delinquency rates have climbed since payments restarted, with roughly 10 % of federal loan dollars delinquent and about 9.6 % of balances more than 90 days past due in Q4 2025.
The burden of student debt is unevenly distributed. Borrowers pursuing graduate and professional degrees carry much higher balances than those with associate or bachelor’s degrees.
Women and Black students are more likely to borrow and often owe more than their peers. Debt also persists into middle age; borrowers aged 35–49 hold the largest share of outstanding balances.


