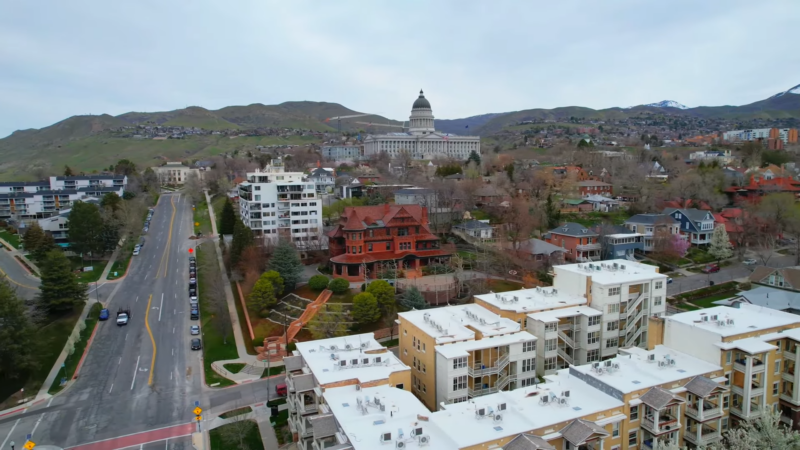
Utah’s population has experienced significant growth over the past decade, making it one of the fastest-growing states in the United States.
The state saw its population rise from approximately 2,763,885 million in 2010 to an impressive 3,454,230 million in 2025 according to World Population Review.
In 2020 in the latest census of US population its population stood at about 3,271,616.
Utah stands out with a robust growth rate of 1.64%, placing it 4th in the nation for population increase.
Utah added just over 60,000 residents between July 1, 2023, and July 1, 2024, pushing its population past 3.5 million, the Census Bureau reported Thursday, making it past 3.5 million.
This can be attributed to its youthful demographic profile and a favorable economic environment that attracts new residents.
Moreover, Utah’s population is becoming increasingly diverse, a trend that reflects broader national changes in demographics.
Projections estimate that Utah’s population may add anywhere from one million to two-and-a-half million new residents by 2050, highlighting the ongoing importance of planning for sustainable growth. Explore these trends in depth by delving into the state’s demographic changes and economic factors.
Table of Contents
ToggleKey Takeaways
- From 2.8 million in 2010 to 3.45 million in 2024, with a growth rate of 1.64%, placing it 4th in the U.S.
- Utah has a young population with a median age of 31.3 years, and a significant portion of dependents, especially children.
- The Wasatch Front, where over 2 million people live, contrasts with sparsely populated rural areas.
- One-fourth of Utah’s population identifies as racial or ethnic minorities, with a growing Latino presence.
- Employment is up 2.8% in 2024, with the housing market seeing a 6.2% increase in home prices.
- Utah’s population could reach 4.1 million by 2034, driven by high birth rates and migration.
Population Growth Over the Decades

In 1850, Utah’s population stood at a modest 11,380 according to UW.
A significant increase was recorded over the next ten years, reaching 40,273 by 1860, reflecting a growth rate of over 250%. By the end of the 19th century, the population had grown substantially to 276,749 according to Census.gov.
From 1900 onwards, sustained growth marked Utah’s demographic landscape. The state’s population continued to rise steadily, reaching 3,417,734 by 2023. Similarly, nearby Las Vegas saw rapid growth throughout the 20th century, with its population soaring from just over 2,000 in 1900 to over 600,000 by 2020.
Between 2010 and 2022, Utah experienced consistent growth, with an average annual increase rate of 1.7%. Notably, between 2019 and 2020, the population saw its largest annual increase of 2.5%.
The 21st century saw further acceleration in population growth, supported by an influx of new residents and high birth rates. The average annual population growth rate was 2.30% from 2000 to 2022, underscoring Utah’s dynamic demographic changes. This growth reflects a combination of natural population increase and migration trends.
Age And Gender Distribution
Category
Data
Median Age
31.3 years
Median Age (Male)
30.8 years
Median Age (Female)
31.8 years
Total Adult Population
2,285,307
Senior Population
358,168
Age Dependency Ratio
67.7
Old Age Dependency Ratio
18.6
Child Dependency Ratio
49.1
Female Population
1,597,527 (49.44%)
Male Population
1,633,843 (50.56%)
Total Population
3,231,370 (100%)
The median age of Utah’s population is 31.3 years, reflecting a relatively young population compared to national averages. The median age for males is slightly lower at 30.8 years, while for females, it is higher at 31.8 years.
Utah has a total of 2,285,307 adults, with 358,168 seniors (aged 65 and older). This indicates that 15.7% of the adult population is comprised of seniors.
The Age Dependency Ratio is 67.7, which means that for every 100 working-age individuals (aged 15-64), there are about 67 dependents (either children under 15 or adults over 64).
The Child Dependency Ratio is significantly higher at 49.1, indicating a larger proportion of young dependents compared to the elderly, whose Old Age Dependency Ratio is 18.6.
Utah’s population is slightly male-dominant, with 50.56% of the population being male and 49.44% female, which reflects a nearly balanced gender ratio in the state.
Ethnic and Racial Composition
Utah’s population has become more diverse over recent decades. Roughly one-fourth of the population identifies as racial or ethnic minorities.
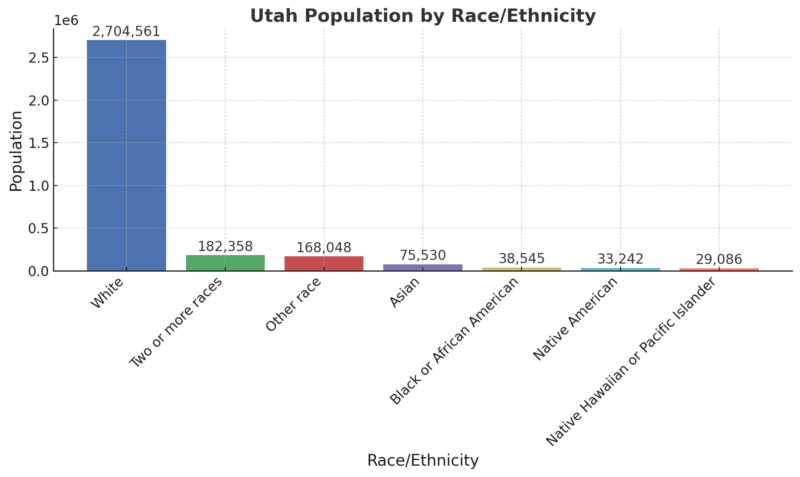
Latino or Hispanic residents form a significant part of the state, with about 1 in 7 residents identifying as such. This increasing diversity has led to enriched cultural dynamics and a broader array of community resources and services.
Urban vs. Rural Populations
The majority of residents live in urban areas, especially along the Wasatch Front, creating a stark contrast to the sparse settlements in rural regions. More than 2 million people are concentrated in towns and cities along the Wasatch Front, running north-south, which significantly influences the state’s demographic trends and economic activities according to Desert News.
While rural areas contribute to the state’s cultural and natural heritage, they are home to a smaller portion of the population. This imbalance reflects a nationwide trend, where urbanization leads to heightened economic opportunities and amenities, attracting more residents.
Population Density by Region
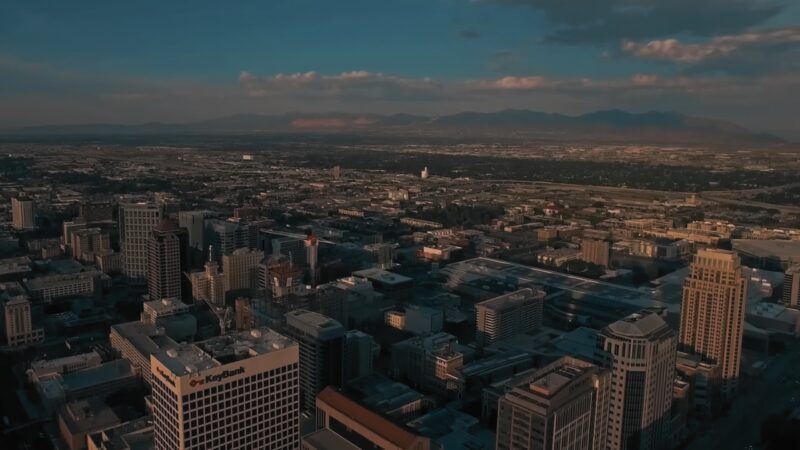
Utah average population density is around 33.6 people per square mile as per States 101. This average, however, masks substantial differences between densely populated urban regions and sparsely populated rural areas.
Regions such as Salt Lake County and Utah County exhibit much higher population densities compared to the expansive, less populated areas in the southern and eastern parts of the state. These disparities can affect infrastructure development, resource allocation, and public service.
- Salt Lake County: The population density is approximately 1,637 people per square mile as per the census report.
- Utah County: The population density is around 450 people per square mile.
Key Metropolitan Areas
Key metropolitan areas in Utah, including Salt Lake City, Provo-Orem, and Ogden-Clearfield, play a significant role in the state’s economic and demographic landscape according to City Population.
- Salt Lake City: As Utah’s largest metropolitan area, Salt Lake City had a population of 1.26 million as of 2020. It is the primary hub for economic activities, including finance, health care, and technology. Salt Lake City is also home to numerous cultural and governmental institutions, including the state capital
- Provo-Orem: The Provo-Orem metro area had a population of 671,185 as of 2020. It is a major center for education, largely driven by Brigham Young University. The area is also known for its growing tech sector, sometimes referred to as the “Silicon Slopes,” attracting numerous startups and tech companies(
- Ogden-Clearfield: This metropolitan area, with a population of 714,919 as of 2020, is known for its defense and aerospace industries. Ogden-Clearfield is home to Hill Air Force Base, which contributes significantly to the local economy
Economic Impact of Population Changes

Labor Market Fluctuations
As of July 2024, Utah’s labor market continues to show robust growth, with nonfarm payroll employment increasing by 2.8% over the past year. This growth translated into the addition of 48,500 jobs, bringing the state’s total job count to 1,754,600.
Utah’s unemployment rate stands at 3.2%, which, although slightly higher than in previous months, remains significantly below the national average of 4.3%.
Several sectors are driving this growth, with the education and health services sector adding 13,200 jobs, followed by construction with 8,800 jobs, and professional and business services with 5,900 jobs. However, some sectors, like other services, saw job losses over the same period according to the Bureau of Labor Statistics.
Housing Market Trends
The housing market in Utah is showing significant growth as of July 2024. Home prices are up 6.2% year-over-year, reaching a median sale price of $559,400. Alongside the price increase, the number of homes sold has risen by 9.2%, with 3,343 homes sold in July.
The number of homes available for sale also increased by 14.9%, reflecting growing inventory. Despite these increases, homes are spending more time on the market, with the median days on the market rising to 39 days, an increase of 6 days compared to the previous year.
Utah Housing Market Overview (July 2024)
Metric
Value
Year-Over-Year Growth
Median Sale Price
$559,400
+6.2%
Number of Homes Sold
3,343
+9.2%
Homes for Sale
N/A
+14.9%
Median Days on Market
39 days
+6 days
Fastest Growing Sales Prices by Metro Area
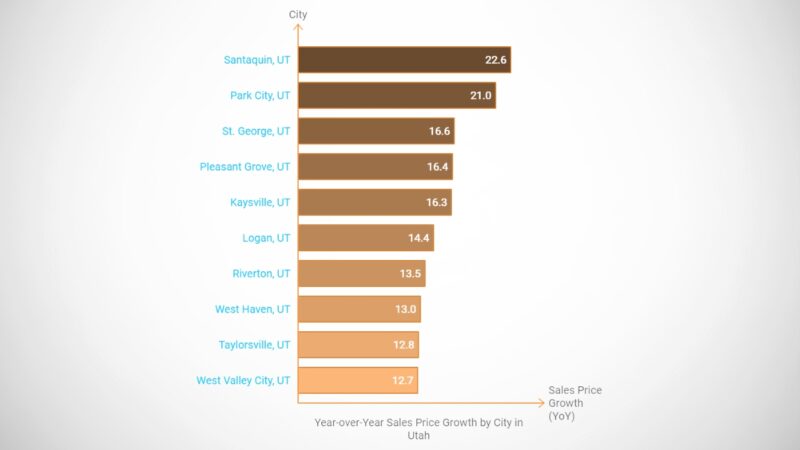
This data from Redfin indicates that cities like Santaquin and Park City are experiencing particularly rapid increases in home prices, with 22.6% and 21.0% year-over-year growth, respectively.
Educational Attainment Levels

Utah boasts impressive educational attainment levels compared to national averages. In 2022, only 7% of Utah residents aged 25 and over had not completed high school. This is significantly lower than the 10.4% of U.S. residents in the same age group who hadn’t finished high school.
Higher education is also a strong point for Utah. The state has a higher percentage of residents with college degrees compared to the national average. Many Utahns pursue advanced education, contributing positively to the state’s workforce.
Key Statistics
- High School Non-Completion Rate: 7% in Utah vs. 10.4% in the U.S.
- College Degrees: Higher percentage in Utah than the national average.
Educational attainment varies across different demographics in Utah. Urban areas tend to have higher educational levels compared to rural regions.
Data from the Utah Department of Health and Human Services provides insights into these educational trends. Their reports show that education levels in Utah have been on a steady rise, reflecting the state’s focus on improving educational infrastructure.
Utah’s emphasis on education is evident in its policies and programs aimed at increasing graduation rates and higher education enrollment. These efforts are crucial for the state’s economic growth and diversification.
Utah’s public colleges and universities saw a 4.32% enrollment increase from 2023 to 2024, reaching 207,005 students. Undergraduate enrollment rose by 2.98%, and graduate enrollment surged by 7.48%.
Notable institutions include Weber State University with a 7.09% increase, Utah Valley University with a 4.83% growth, and Utah Tech University with a 4.77% rise. This growth contrasts with a 1.80% increase in 2023. Strategic initiatives and support for FAFSA completion contributed to these numbers.
For more details, check the article here.
Snow College — Utah’s most affordable higher education institution — rebounded from its 2023 headcount that saw enrollment decline 2.8%, this year growing by 1.29% to 5,577 students.
Their officials stated:
“We are excited about the outcomes we have seen this year in alignment with our strategic enrollment plan. We are especially excited about the significant increase we have seen of students within our service region,” Cody Branch, vice president for student affairs and enrollment management at Snow College, said in a statement. “This progress reflects the hard work and dedication of many individuals from various departments across both campuses and in partnership with our regional high schools. We are grateful for their commitment to ensuring that more students have access to the amazing educational opportunities Snow College offers.”
Population Projections and Predicted Trends
In the next decade, Utah’s population is expected to reach approximately 4.1 million by 2034. This growth represents an increase of 1.8 million residents from 2002, marking a 76.4% rise.
Factors contributing to this growth include high birth rates and net migration. The Deseret article highlights that one in six Utahns will be of school age by 2034, amounting to about 665,561 individuals. Meanwhile, the proportion of those aged 65 and older will more than double compared to the past 32 years.
Long-Term Outlook
Utah’s long-term growth projections indicate a 66% increase in population from 2020 to 2060. The Utah Foundation anticipates the population to rise from 3,284,823 in 2020 to 5,450,598 by 2060.
The state will see substantial demographic shifts, with an increasingly older and more diverse population. Most of Utah’s growth will concentrate in urban areas along the Wasatch Front, continuing its trend as one of the most urban states since 2008.
The expected timing for reaching 4 million residents is between 2032 and 2033, while 5 million is anticipated between 2050 and 2051 based on long-term planning projections.
Impact of Demographics on State Policy
Utah’s evolving demographic landscape has significant implications for state policy. The state’s youthful population necessitates investments in education and family services. Policymakers must prioritize funding for schools and childcare facilities to meet the needs of young families.
Healthcare policies also require adjustments. As the population ages, there is an increasing demand for senior health care services. This trend necessitates expanding Medicare facilities and geriatric care specialties.
The growing racial and ethnic diversity in Utah impacts cultural and social policies. Efforts to ensure inclusivity and representation in state governance and public services have become more crucial. Programs promoting cultural awareness and anti-discrimination must be developed and strengthened as per Utah Demographics.
Urbanization affects infrastructure and transportation. With most Utahns residing in urban counties, investments in public transit and sustainable urban planning are essential.
Economic policy adjustments are also critical.
- Workforce Development: Tailoring job training programs to support the young and diverse labor force.
- Affordable Housing: Addressing the urban housing shortage through incentives for affordable housing projects.
Utah’s unique demographic profile, featuring a high percentage of religious adherents, influences policies on social services and community programs. Collaborative efforts with religious organizations can enhance community outreach and support services.
Methodology
The methodology for this article involved gathering data from credible sources such as the Census Bureau, university studies, and reputable websites. Historical and current trends were analyzed to highlight population growth, economic factors, and demographic changes. Information was carefully structured into clear sections, ensuring logical flow and accessibility. Data was cross-referenced across multiple sources to maintain accuracy and consistency. Finally, the findings were presented using tables, key takeaways, and concise summaries to provide a clear and engaging overview.
References
- Census.gov – POPULATION OF UTAH BY COUNTIES AND MINOR CIVIL DIVISIONS.
- Census Reporter – Salt Lake County, UT
- BLS – Economy At Glance
- Desert.com – What will Utah look like when the Olympics come in 2034?
- Utah Foundation – A Snapshot of 2050: An Analysis of Projected Population Change in Utah
- CloudFront – Utah Long-Term Planning Projections, Utah Demographic Characteristics
- World Population Review – Utah Population 2024
- USA Facts – How has the population changed in Utah?
- Washington.edu – Utah Migration History 1850-2022
- States 101 – Utah Population, Area, and Density
Related Posts:
- Utah Ranks in Top 5 Growth States as US Population…
- New Orleans Population 2025 - Current Data and…
- The Number of People Living in Poverty in US Cities…
- Oklahoma Population in 2025 - Demographics and Trends
- Adult Daily Protein Intake Much More Than Recommended
- US Adults Want Government to Cut Child Care Costs,…


