As of 2025, Tucson population stands at approximately 548,772 people.
As of it latest US census in 2020 Tucson had 542,629 people living there
This figure represents a modest growth for the city, highlighting its steady development amidst Arizona’s wider demographic trends.
The Tucson metro area, which includes the city itself and surrounding regions, has seen its population reach about 1,024,000 in 2025, based on estimates from Macrotrends.
This indicates that while city growth has been gradual, the broader metro area continues to expand at a respectable rate.
Key Takeaways
Current Demographics
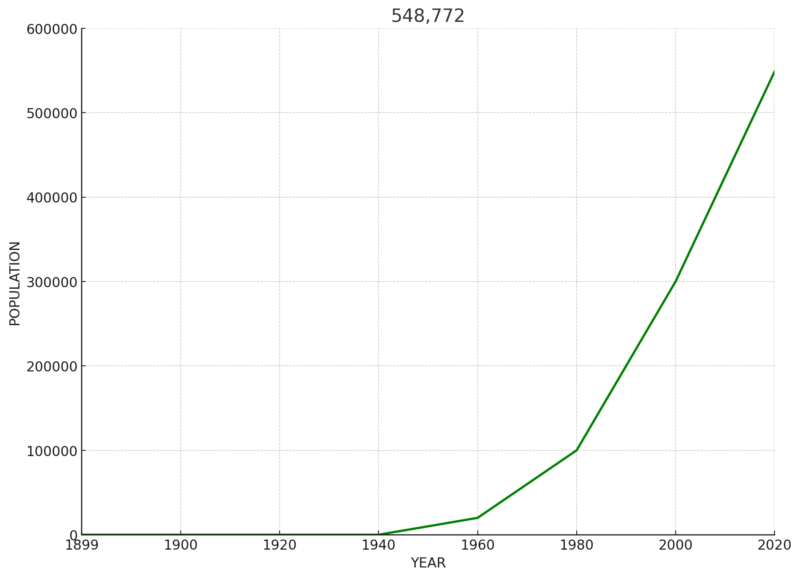
Tucson’s 2025 population is approximately 548,772 according to World Population Review. This marks a slight growth from previous years, reflecting its status as the county seat of Pima County.
Nearly 44.77% of residents identify as Hispanic or Latino, while 55.23% identify as Non-Hispanic. Among the Non-Hispanic population, the largest racial group is White, comprising about 76.68% of this demographic.
In terms of age distribution, the median age is 33.9 years. The population breakdown by age shows that 16.79% are under 15, while 27.75% fall between 15 and 29 years.
The majority, or 40.26%, are aged between 30 and 64, and 13.29% are between 65 and 84 years, with a small percentage over 85 years old.
Tucson also faces economic challenges, reflected in its poverty rate of 19.56%. The average household income is approximately 69,553 dollars.
This blend of cultural diversity and economic challenges contributes to the unique character of Tucson, shaping its community dynamics and growth trajectory.
Age Distribution
Age Group
Population (Male)
Population (Female)
Under 5 years
15,111
14,344
5 to 9 years
14,876
15,958
10 to 14 years
16,396
14,173
15 to 19 years
20,379
20,871
20 to 24 years
32,231
30,472
25 to 29 years
24,305
21,888
30 to 34 years
20,714
17,373
35 to 39 years
17,698
17,179
40 to 44 years
15,645
15,217
45 to 49 years
14,357
14,507
50 to 54 years
13,727
13,592
55 to 59 years
14,514
14,238
60 to 64 years
13,472
15,649
65 to 69 years
12,298
14,799
70 to 74 years
9,000
10,434
75 to 79 years
6,423
8,534
80 to 84 years
4,364
6,064
85 years and over
3,412
6,819
The Tucson population pyramid reveals that younger age groups (0-20 years) have a relatively balanced gender distribution, with a slightly higher number of males than females. The distribution begins to narrow in the 30-50 age range, with the female population slightly exceeding the male population in older age brackets.
The population size decreases progressively in higher age groups, reflecting the natural aging of the population.
Median Age Data
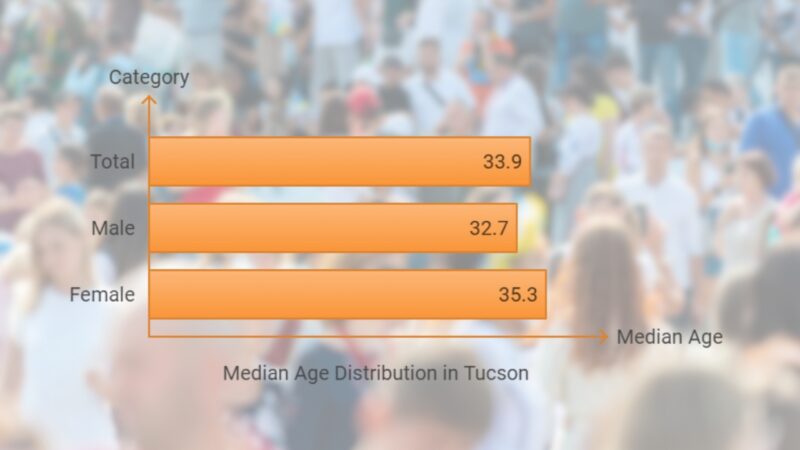
The overall median age of Tucson is 33.9 years, indicating a relatively young population compared to many other U.S. cities. The difference in median age between genders is also notable, with females having a higher median age (35.3) than males (32.7). This could suggest that females tend to live longer or that Tucson has more younger males than females.
Adult Population
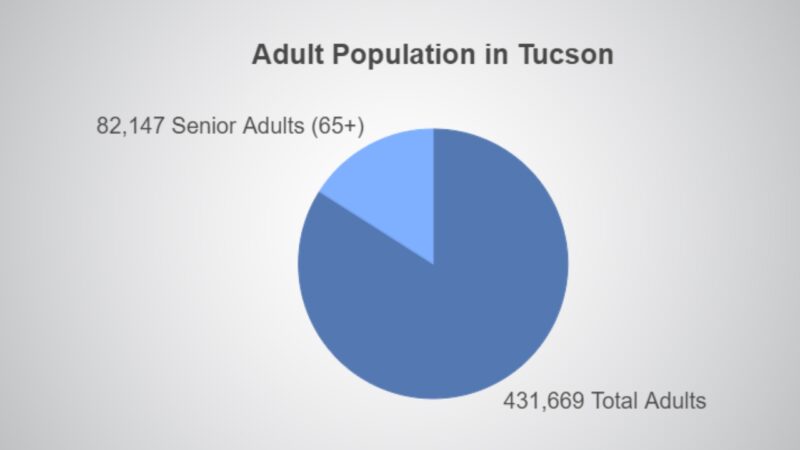
Tucson has a total adult population of 431,669, out of which 82,147 are seniors (aged 65+). This reflects a significant proportion of working-age adults, with about 19% of the adult population being seniors, showing the city’s need for senior services and programs while also maintaining a youthful workforce.
Age Dependency Ratios
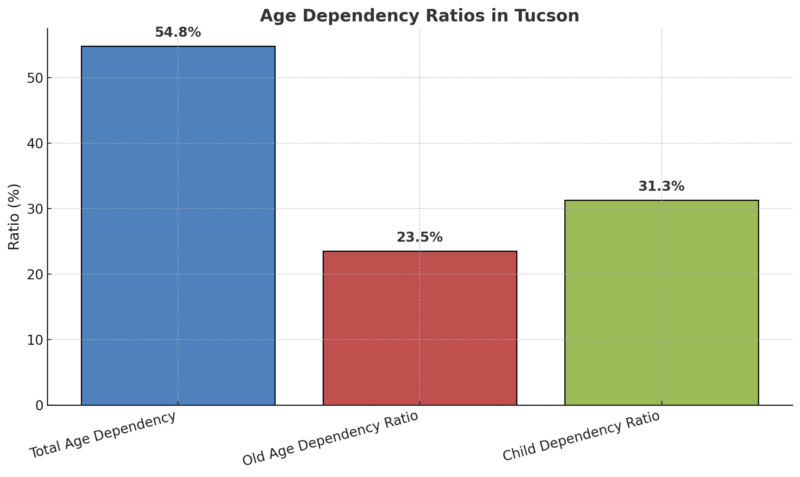
The Age Dependency Ratio of 54.8 means that there are approximately 55 dependents (children and elderly) for every 100 working-age adults. The Child Dependency Ratio (31.3) is higher than the Old Age Dependency Ratio (23.5), suggesting that Tucson has a larger child population than elderly individuals.
This means that the city might need to focus more resources on education and childcare services than elderly care, although both populations require attention.
Sex Ratio

The sex ratio in Tucson is almost evenly split between males and females, with females making up 50.29% of the population and males accounting for 49.71%. This balanced ratio reflects a stable demographic profile without significant gender imbalances.
Ethnic and Cultural Composition
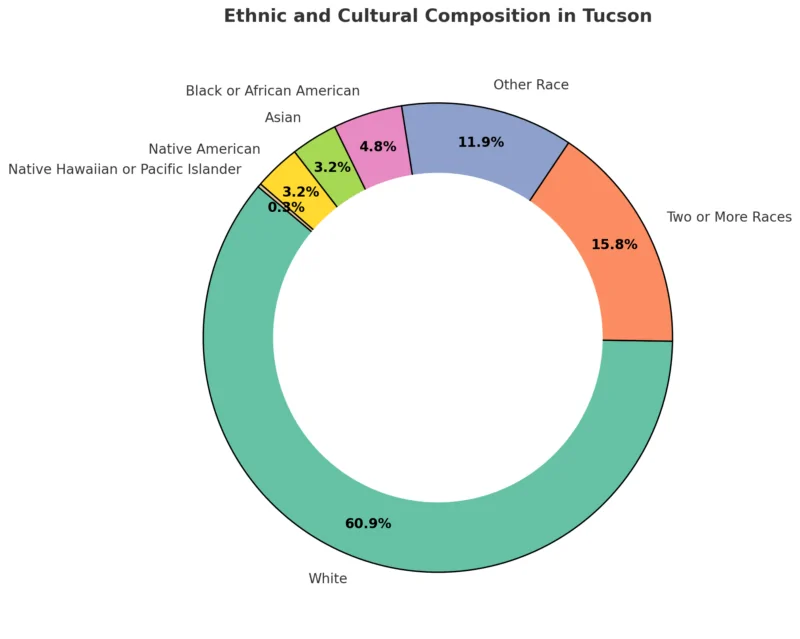
- White (60.86%): The largest racial group in Tucson is White, comprising just over 60% of the population. This represents the majority, but it also highlights Tucson’s ethnic diversity compared to national averages according to Neilsberg.
- Two or More Races (15.84%): The second-largest group, those identifying as having two or more races, makes up nearly 16% of the population, showing a significant portion of individuals with mixed heritage.
- Other Race (11.88%): This category includes individuals who do not fit into the predefined racial categories, making up almost 12% of the population. Many people in this group could potentially identify as Hispanic, though this specific category doesn’t clarify ethnicity.
- Black or African American (4.77%): The Black or African American population in Tucson is relatively small at about 4.8%, reflecting lower African American representation compared to other cities or national averages.
- Asian (3.21%): The Asian population, though small, represents a diverse community, with people likely coming from different Asian countries and backgrounds.
- Native American (3.18%): Tucson’s proximity to Native American reservations and its history with Indigenous peoples is reflected in this 3.18% of the population.
- Native Hawaiian or Pacific Islander (0.25%): A very small portion of Tucson’s population (0.25%) is made up of Native Hawaiian or Pacific Islanders.
Education Levels

Tucson has focused on enhancing graduation rates and student achievement in its public and private schools. Initiatives such as STEM-focused programs and expanded extracurricular activities have helped increase high school graduation rates.
In 2022, 21.5% of Tucson’s population over 25 had only completed high school, a figure lower than the U.S. national average of 26.4%.
However, Tucson has a larger percentage of individuals with some college education but no degree (24.2%) compared to the national average of 19.7%, indicating a focus on continuing education despite not always resulting in a degree.
Higher Education
Tucson’s higher education landscape is driven by institutions like the University of Arizona. By 2022, the percentage of the population aged 25 and older holding a bachelor’s degree or higher had risen to 35.0%, a significant increase from 26.7% in 2000.
Despite this, Tucson still lags behind some Western U.S. metro areas such as Austin, which boasts a 48.5% college attainment rate. The number of residents with graduate or professional degrees stands at 15.0%, above the national average of 13.4%, reflecting Tucson’s reputation as an education hub.
Economic Impact on Population
Tucson’s economy has seen steady growth in recent years, though somewhat slower than other Western metropolitan areas. In 2023, total nonfarm employment in the Tucson Metropolitan Statistical Area (MSA) grew by 1.6%, a decline from the 3.6% growth rate observed in 2022.
Despite this, Tucson has successfully recovered from pandemic-related job losses, and the job market remains robust across several sectors, particularly in health care, education, and the growing e-commerce and logistics industries.
Sectors like transportation and warehousing have particularly benefited from the rise of e-commerce, with this industry seeing a 33.2% increase in jobs since 2020.
Overall, Tucson’s job growth is projected to continue, albeit at a slower pace. By 2024-2025, job growth is expected to slow to 2.0%, reflecting national trends according to AZ Economy.
Population Growth and Migration
Population growth in Tucson has been modest, with a 1.5% increase expected for 2023, down from 1.7% in 2022. According to Eller College of Management this deceleration is partly due to reduced net migration following the pandemic, as housing affordability issues make the area less attractive to newcomers.
The pandemic initially boosted migration into Tucson, but rising housing costs and inflation have since moderated this trend.
Tucson’s population is expected to continue growing over the long term, reaching approximately 1.3 million by 2053. However, this growth rate will likely be slower than in previous decades due to demographic shifts, including lower birth rates and an aging population.
Housing and Cost of Living
View this post on Instagram
One of the key economic factors affecting Tucson’s population is housing affordability. Although Tucson remains more affordable than many other Western cities, its housing market has experienced a sharp decline in affordability. The housing affordability rate dropped from 71.2% before the pandemic to just 38.6% in 2023.
Inflation also jumped to 7.6% in 2022, further straining the local economy. Despite these challenges, Tucson’s cost of living remains 6.2% below the national average, with housing costs being 8.9% lower than the national figure as per MAP AZ Dashboard.
Tucson’s housing market has seen significant changes, with the average price to buy an apartment in the city center being $236.91 per square foot and $229.33 per square foot outside the center. Rent for a one-bedroom apartment in the city center averages $1,261.38, while outside the center it’s around $1,137.46 according to Numbeo.
Affordability
The average monthly net salary is approximately $3,633.57, making affordability a challenge, especially with mortgage interest rates at 6.56%. Rising housing prices and inflation have increased the financial pressure on residents.
Category
Price (USD)
Rent (1-Bedroom, City Center)
$1,261.38
Rent (1-Bedroom, Outside Center)
$1,137.46
Apartment Purchase (City Center)
$236.91 per sq ft
Apartment Purchase (Outside)
$229.33 per sq ft
Average Monthly Salary (Net)
$3,633.57
Mortgage Interest Rate (Yearly)
6.56%

In August 2024, Tucson’s housing market experienced notable trends, reflecting a dynamic mix of price growth and slower sales activity. The median sale price for homes rose to $323,000, marking a 3.9% increase compared to August 2023 according to Redfin. This rise highlights a steady demand for housing, though the market is cooling compared to previous years.
However, the number of homes sold declined slightly, with 469 homes sold, a 4.1% decrease from the 489 homes sold during the same month last year. This drop in sales suggests potential factors such as rising interest rates or affordability concerns affecting buyer behavior.
Employment Rates
Employment is a crucial factor impacting Tucson’s population. Job growth in Arizona is expected to decelerate from 2.1% in 2023 to 1.9% in 2024. Despite this slowdown, job gains in Tucson should continue to exceed national averages, driving a steady influx of residents seeking opportunities.
Industries such as healthcare, education, and technology are vital contributors to this growth. As these sectors expand, they not only create jobs but also foster a diverse economic base. Such diversity aids in making Tucson an attractive destination for new residents.
However, a slower job growth rate might challenge Tucson in meeting the increasing demand for employment.
Income Levels and Housing Affordability

Income levels in Tucson play a significant role in shaping the population’s living standards. According to World Population Review, the average household income is approximately $69,553, with a poverty rate of 19.56%. These figures highlight disparities that can affect the ability of residents to purchase homes or afford living expenses.
Housing affordability remains a critical concern. The moderate pace of population growth, documented at a 0.28% annual increase, coincides with the rising cost of living. Many residents find it challenging to secure affordable housing.
As income levels stagnate and housing costs rise, Tucson might witness fluctuations in population as individuals seek affordable living conditions elsewhere.
Migration Patterns
In recent years, Tucson has experienced significant changes in migration patterns. A noticeable trend is the increased domestic in-migration, which affects the region’s demographic profile. Many people are relocating to Tucson due to its growing job market and relatively lower cost of living compared to other metropolitan areas.
Population Figures
Tucson Sector continues to encounter large groups of migrants at the border. This group of 162 people, consisting of both single adults and family units, illegally entered the U.S. and were processed for removal proceedings. pic.twitter.com/roC439LEtn
— John R. Modlin (@USBPChiefTCA) April 22, 2024
- Annual In-Migration: Consistent growth in newcomers, primarily from larger cities.
- Out-Migration Trends: Although some residents leave the area, the numbers are outweighed by new arrivals.
A key feature of Tucson’s migration landscape is the shifting dynamics at the U.S. southern border. The Tucson sector has seen increased activity, mainly because migrants are avoiding more heavily patrolled sectors. This influx contributes to diverse cultural influences in the community.
Another factor influencing migration is the rise in remote work, leading many people to choose destinations like Tucson for their livability and environment. The draw of warmer winters and abundant natural beauty attract people seeking an improved quality of life.
Population Projection
Predictions for the city’s future growth, such as those by the Pima Association of Governments, indicate considerable population expansion over the next decade. The continuous influx of residents suggests a robust future for Tucson amidst these evolving migration patterns.
Forecast and Projections
The population of Tucson, Arizona, has been steadily increasing, with various agencies reporting different statistical insights. As of 2024, the city’s population is approximately 548,772, reflecting a growth rate of 0.28% annually. This growth is a continuation of trends observed since the last census in 2020.
Projections for Tucson indicate that the metro area is likely to experience consistent growth. The population of the Tucson metro area was recorded at 1,003,000 in 2022. This increase of 1.01% from the previous year suggests a steady upward trajectory through 2024.
Future growth scenarios are also being considered in broader planning exercises. For instance, the Future Growth Scenario Map reflects community input and forecasts an increase of approximately 77,000 people between 2022 and the coming years.
In the context of Arizona, the state’s population stands at around 7.5 million in 2024. It has seen significant growth since the 2010 census and remains one of the fastest-growing areas in the U.S. The state’s annual growth rates are expected to settle around 1.3% during the period from 2023 to 2026.