While the city itself is projected to have a population of 480,194 according to World Population Review, and the broader Omaha metro area boasts an estimated 868,000 residents.
This reflects a modest increase from the previous year, highlighting steady growth in the metropolitan region.
Omaha’s status as the largest city in Nebraska is affirmed by its rank as the 40th largest city in the U.S., with a population density of 3,217.9 people per square mile.
The city stands as a significant hub of economic and cultural activity in the region.
The anticipated population milestones suggest a significant regional growth that may extend beyond the city limits.
Projections suggest the greater Omaha metropolitan area could reach one million residents by 2025.
Current Population of Omaha 2025

The city of Omaha, located in Douglas County, holds a significant position in Nebraska.
As of 2025, the population of Omaha is approximately 480,194. This figure indicates a slight decrease when compared to the population in 2020, which was noted to be 492,758, a change rate of -0.65% annually.
An examination of Omaha’s larger metropolitan area reveals additional insights. The Omaha metro area, which includes surrounding counties, has a population of about 868,000 in 2025. This figure represents a modest increase from 2023.
Economic indicators for Omaha show a varied picture. The average household income in the area is $97,761. The city faces a poverty rate of 12.49%, which is a noteworthy socio-economic factor impacting its residents.
Population estimates for the metro area suggest growth trends, with projections hinting at possible future increases. Reports have indicated that the metro population may approach 1,000,000 residents soon, reflecting ongoing population dynamics.
Demographic Breakdown
~ Margin of Error: At least 10% of the total value. Exercise caution when interpreting these statistics.
1. Population by Age Range
Age Range
Percentage (%)
0-9
13%~
10-19
13%~
20-29
16%~
30-39
15%~
40-49
12%~
50-59
11%~
60-69
11%~
70-79
7%~
80+
3%~
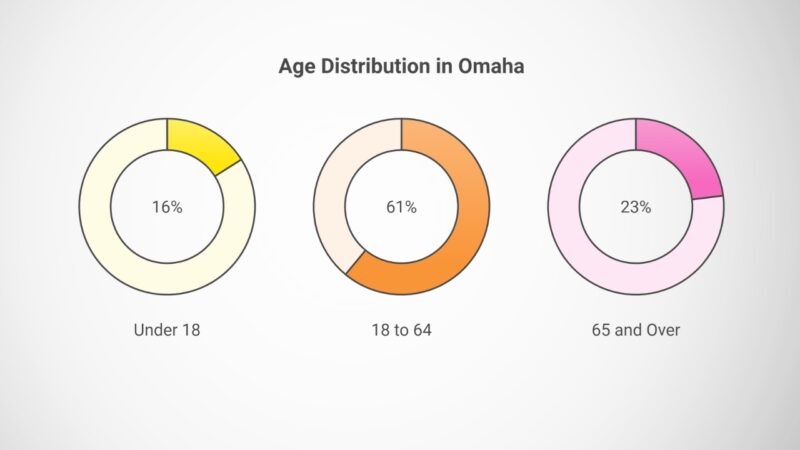
The median age of the population is 35.3 years, which is slightly younger compared to the Omaha-Council Bluffs Metro Area (36.7 years) and the state of Nebraska (37.4 years) according to Census Reporter.
The largest age group is 20-29 years, comprising 16% of the population. Individuals under 18 make up 16%, those between 18 to 64 years account for 61%, and 23% are 65 years and older.
2. Population by Age Category
3. Sex Distribution
Sex
Percentage (%)
Comparison
Female
50%
Same as Omaha-Council Bluffs Metro Area and Nebraska
Male
50%
Same as Omaha-Council Bluffs Metro Area and Nebraska
The population is evenly split between females and males, each representing 50% of the total population. This distribution is consistent with both the Omaha-Council Bluffs Metro Area and the state of Nebraska.
Ethnic Diversity and Race
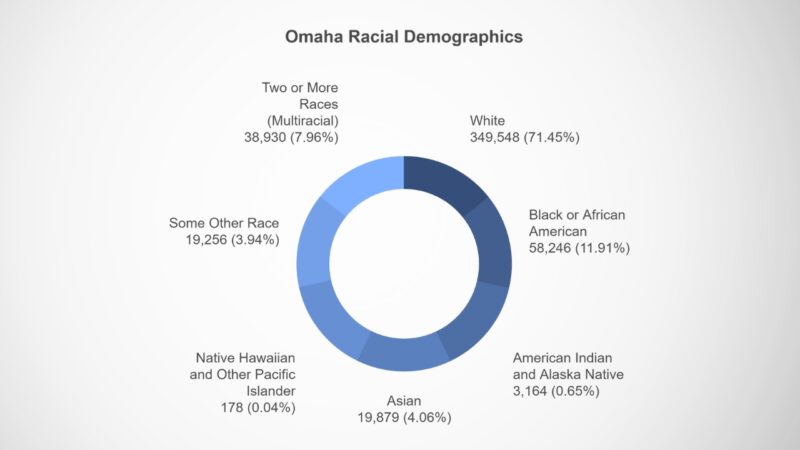
- White Population: White individuals make up the largest racial group in Omaha, constituting 71.45% of the total population with 349,548 people according to Neilsberg.
- Black or African American Population: The Black or African American community accounts for 11.91% of Omaha’s population, totaling 58,246 individuals.
- Asian Population: Asians represent 4.06% of the population, with 19,879 residents identifying as Asian.
- Two or More Races (Multiracial): Individuals identifying with two or more races make up 7.96% of the population, totaling 38,930 people.
- Some Other Race: Those identifying as some other race constitute 3.94% of the population, amounting to 19,256 individuals.
- American Indian and Alaska Native: This group is a smaller segment, representing 0.65% of the population with 3,164 individuals.
- Native Hawaiian and Other Pacific Islander: The smallest racial category, Native Hawaiian and Other Pacific Islander individuals, make up 0.04% of the population, totaling 178 people.
Population Growth Trends
Omaha’s population has seen significant changes over the years, marked by both historical growth and future projections. These trends are critical for understanding the city’s development and planning for the future.
Historical Growth Rates
Omaha, Nebraska has steadily grown and expanded in recent decades, its population doubling from 526,000 to about 1 million since 1984. A growing number of immigrants have made their homes in the city, with the largest South Sudanese community in the US located in #Omaha. pic.twitter.com/C5q1jDJj2L
— Daily Overview (@DOverview) January 21, 2023
Omaha has experienced varied growth rates over the decades. Since 1950, the city’s population has generally increased, fueled by economic development and urban expansion.
According to data, Omaha’s metro area saw consistent growth, and by 2020, it ranked as the 40th largest city in the United States. The city’s historical growth has been supported by infrastructure improvements and a growing job market, which have attracted new residents over the years.
In recent decades, the population growth rate has continued to climb. Between 2020 and 2024, growth was recorded at about 0.93% yearly, bringing it closer to significant milestones in terms of metro population size. The upward trend reflects Omaha’s appeal as a vibrant urban center in Nebraska.
Projected Growth
The future population projections for Omaha suggest continued growth. Predictions indicate that the eight-county Omaha metro area could reach one million residents by 2024. This growth is driven by factors such as employment opportunities and affordable living conditions compared to other urban areas.
This projected increase underscores the importance of urban planning and resource allocation to accommodate incoming residents. The city’s development strategies will likely focus on improving transportation, housing, and public services to ensure a high quality of life.
As these projections unfold, Omaha will need to balance growth with sustainable development to maintain its position as a leading city in the region.
Factors Influencing Omaha’s Population

Omaha’s population dynamics are influenced by a combination of economic opportunities, migration patterns, and birth and death rates. These factors collectively determine the growth, stability, and demographic composition of the city.
1. Economic Drivers
Omaha boasts a diverse economy with key sectors that significantly impact its population growth and stability. The presence of major corporations and a robust job market attract professionals and skilled workers to the area.
Industry
Number of Employees
Percentage of Total Employment
Health Care & Social Assistance
38,556
15.1%
Retail Trade
26,676
10.5%
Educational Services
23,424
9.2%
Finance & Insurance
21,000
8.58%
Manufacturing
19,000
8.23%
Professional, Scientific, & Technical Services
18,000
8.12%
Construction
15,000
7.54%
Accommodation & Food Services
13,000
6.71%
Transportation & Warehousing
12,000
4.82%
Administrative & Support & Waste Management Services
12,000
4.77%
Other Services, Except Public Administration
10,800
4.3%
Public Administration
7,800
2.8%
Wholesale Trade
6,600
2.27%
Arts, Entertainment, & Recreation
5,280
1.82%
Information
5,220
1.81%
Real Estate & Rental & Leasing
4,680
1.63%
Utilities
2,400
0.837%
Agriculture, Forestry, Fishing & Hunting
2,100
0.735%
Source: U.S. Census Bureau, American Community Survey (ACS) 5-Year Estimates, 2022
Key Employers
- Berkshire Hathaway: A multinational conglomerate holding company headquartered in Omaha, employing over 300,000 people worldwide, with a significant local workforce.
- Union Pacific Railroad: One of the largest railroad networks in the United States, providing numerous jobs in logistics and transportation.
- Mutual of Omaha: A leading insurance and financial services company, contributing to the Finance & Insurance sector.
Economic Stability and Growth
View this post on Instagram
Omaha’s economy is characterized by stability and growth, driven by its strong financial services sector, healthcare, and manufacturing industries. The city’s GDP has seen consistent growth, outpacing national averages in recent years.
- GDP Growth (2022): Omaha’s GDP grew by approximately 3.2%, higher than the national average of 2.1%.
- Unemployment Rate (2022): Standing at 3.5%, Omaha’s unemployment rate is lower than the national average of 3.7%.
Sources: U.S. Bureau of Economic Analysis, U.S. Bureau of Labor Statistics
2. Migration Patterns
Migration plays a critical role in shaping Omaha’s population by influencing its size, diversity, and workforce composition. Both domestic and international migrations contribute to the city’s demographic trends.
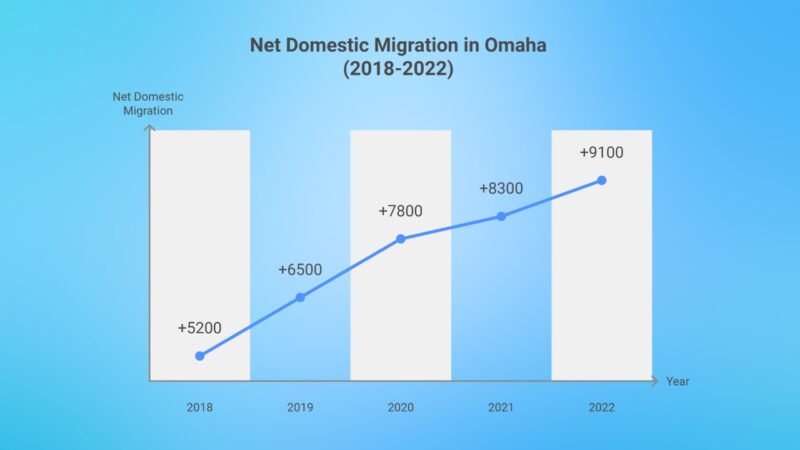
Domestic Migration
Omaha attracts individuals from other states primarily due to its affordable cost of living, employment opportunities, and quality of life.
International Migration
- Total International Immigrants (2022): Approximately 15,000 new immigrants.
- Top Countries of Origin: Mexico, India, and the Philippines.
Country
Number of Immigrants
Percentage of Total Immigrants
Mexico
5,500
36.7%
India
3,800
25.3%
Philippines
2,200
14.7%
Other Countries
3,500
23.3%
Total
15,000
100%
3. Birth and Death Rates
Natural population changes, driven by birth and death rates, play a fundamental role in shaping Omaha’s demographic structure.
Demographic Metric
Number of People
Births
4200
Deaths
1800
Natural Increase
2400
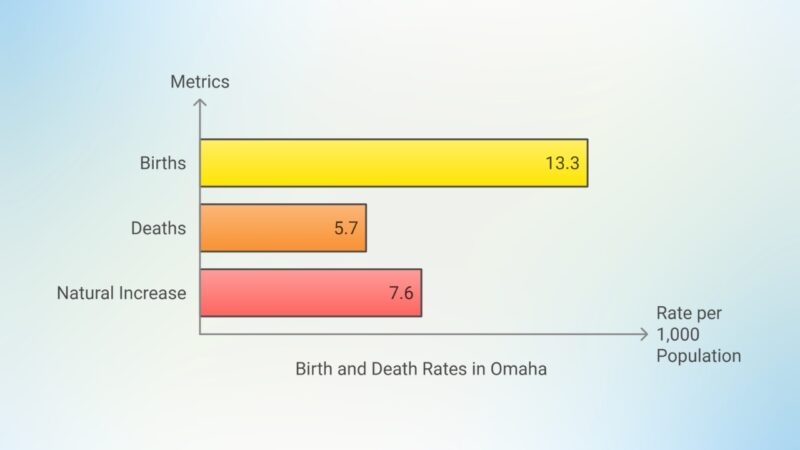
Birth Rate Trends
- Birth Rate (2022): 13.3 births per 1,000 population, indicating a stable but modest increase in population due to natural growth.
- Comparison to National Average: Omaha’s birth rate is slightly higher than the national average of 11.4 births per 1,000 population.
Death Rate Trends
- Death Rate (2022): 5.7 deaths per 1,000 population, reflecting improvements in healthcare and living conditions.
- Life Expectancy: The average life expectancy in Omaha is approximately 78 years, aligning with national trends.
Impact on Population
- Population Stability: The natural increase of 2,400 people sustains the population growth alongside migration according to CDC.
- Aging Population: With higher life expectancy, Omaha is experiencing a gradual increase in its elderly population, necessitating enhanced healthcare and senior services.
Housing Market
The housing market in Omaha, NE, has experienced notable changes over recent years, influenced by economic growth, population influx, and shifts in demand for both rental and owned properties. This section provides detailed statistics and insights into median home prices, rental rates, housing availability, and other pertinent metrics.
1. Median Home Prices
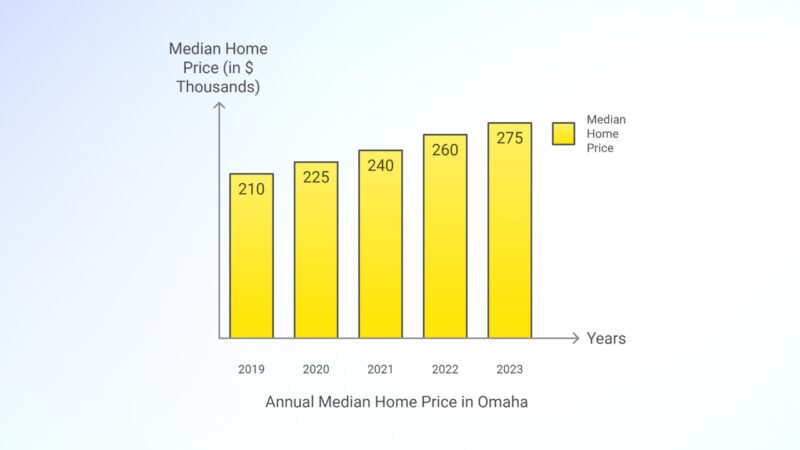
The median home price in Omaha has shown a steady increase from $210,000 in 2019 to $275,000 in 2023, reflecting robust demand in the housing market according to Redfin. This upward trend is attributed to factors such as economic growth, population expansion, and historically low interest rates that have made homeownership more accessible.
Average Rent Prices by Apartment Type
Apartment Type
Average Rent
Average Sq Ft
Studio
$931/month
505 Sq Ft
One Bedroom
$1,048/month
737 Sq Ft
Two Bedroom
$1,336/month
1,066 Sq Ft
Three Bedroom
$1,615/month
1,372 Sq Ft
As of October 2024, the average rent in Omaha, NE, is $1,048 per month, which is 33% lower than the national average of $1,564 per month according to apartments.com. This significant difference makes renting in Omaha more affordable than in most other U.S. cities. The breakdown of rental prices by apartment type is as follows:
- Studio: $931/month for an average size of 505 square feet.
- One Bedroom: $1,048/month for an average size of 737 square feet.
- Two Bedroom: $1,336/month for an average size of 1,066 square feet.
- Three Bedroom: $1,615/month for an average size of 1,372 square feet.
Housing Affordability
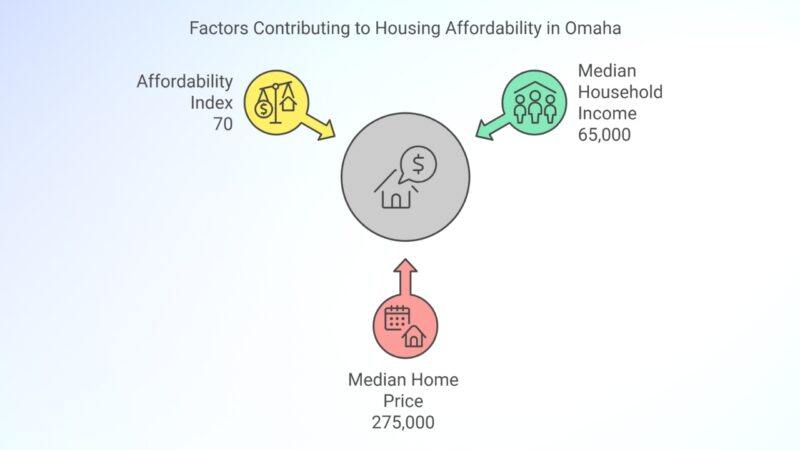
The Housing Affordability Index in Omaha stands at 70, meaning that the median household income is sufficient to afford only 70% of the median-priced home. This indicates that housing affordability has become more challenging for residents, driven by rising home prices relative to income levels.
Homeownership Rate
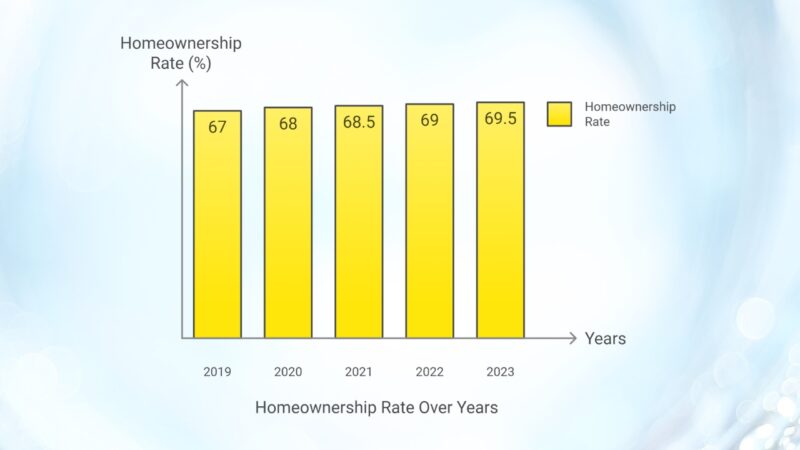
The homeownership rate in Omaha has gradually increased from 67% in 2019 to 69.5% in 2023, indicating a stable trend towards more residents owning their homes according to the Federal Reserve. This growth is supported by economic stability and favorable mortgage conditions.
Rental Vacancy Rates
Year
Overall Vacancy Rate (%)
1-Bedroom Vacancy (%)
2-Bedroom Vacancy (%)
3-Bedroom Vacancy (%)
2019
6.5%
5.8%
6.2%
7.0%
2020
6.0%
5.5%
5.8%
6.5%
2021
5.8%
5.3%
5.5%
6.2%
2022
5.5%
5.0%
5.3%
6.0%
2023
5.3%
4.8%
5.1%
5.8%
The rental vacancy rate in Omaha has decreased from 6.5% in 2019 to 5.3% in 2023, indicating a tightening rental market. Lower vacancy rates typically signify higher demand for rental properties, which can drive up rental prices.
Housing Affordability Index by Neighborhood
Neighborhood
Median Home Price ($)
Median Household Income ($)
Affordability Index
Downtown
300,000
75,000
80
Dundee
320,000
85,000
75
West Omaha
250,000
65,000
70
Midtown
280,000
70,000
72
Benson
260,000
68,000
74
The Housing Affordability Index varies across different neighborhoods in Omaha. For instance, Downtown has a higher median home price of $300,000 but also a higher median household income of $75,000, resulting in an affordability index of 80.
In contrast, West Omaha offers more affordable housing with a median home price of $250,000 and a median household income of $65,000, yielding an affordability index of 70 according to NeighborhoodScout Omaha Housing Data.
The housing market in Omaha is driven by a need to address affordability and community development. Initiatives like the 2024-2028 Consolidated Plan target affordable housing and provide resources for low-income families. This plan includes the development of mixed-income neighborhoods, which are essential to fostering diverse communities.
The Central Neighborhood Revitalization Strategy Area (NRSA) takes a focused approach to revitalizing specific areas. By prioritizing urban renewal projects, the NRSA enhances residential quality, ensuring that housing upgrades align with the needs of local residents. Public participation has been pivotal, with open houses allowing community input into housing strategies.
Infrastructure Expansion
Infrastructure development in Omaha is pivotal for supporting its urban expansion. Projects aim to improve transportation, water systems, and public amenities. The city’s planning department emphasizes sustainable growth, ensuring that new infrastructure meets the criteria for environmental impact and energy efficiency.
Significant investments target transportation systems, improving road networks and public transit to reduce congestion. The Planning Board’s agendas and exhibits highlight critical infrastructure initiatives in 2024.
Water infrastructure projects are also essential, as they support both residential and industrial growth. These improvements ensure adequate water supply and wastewater management, aligning with the city’s commitment to sustainable urban development.
Methodology
For our 2025 population analysis of Omaha, we used data from:
- World Population Review, Macrotrends, and U.S. Census Bureau for primary estimates.
- Growth trends, age demographics, and dependency ratios were reviewed and compared to state averages.
- Cross-verification was done with multiple sources like Neilsberg to ensure consistency.
This blend of diverse data sources and verification ensured an accurate snapshot of Omahas evolving demographic profile.