
The population of Chicago is growing again. The latest official Census estimate available in 2026 puts the population of Chicago at 2,731,585 residents as of July 1, 2025.
The metro area also shows growth. The population of the Chicago metro area was 9,109,000 in 2026, which is up 0.74% from 2025.
Key Takeaways
- The population of Chicago stands at 2,731,585 in the July 1, 2025, estimate.
- The city added 10,277 residents over the previous year.
- The wider metro area holds 9,109,000 people according to Macrotrends data.
- Adults between 18 and 64 make up 66.8% of the population.
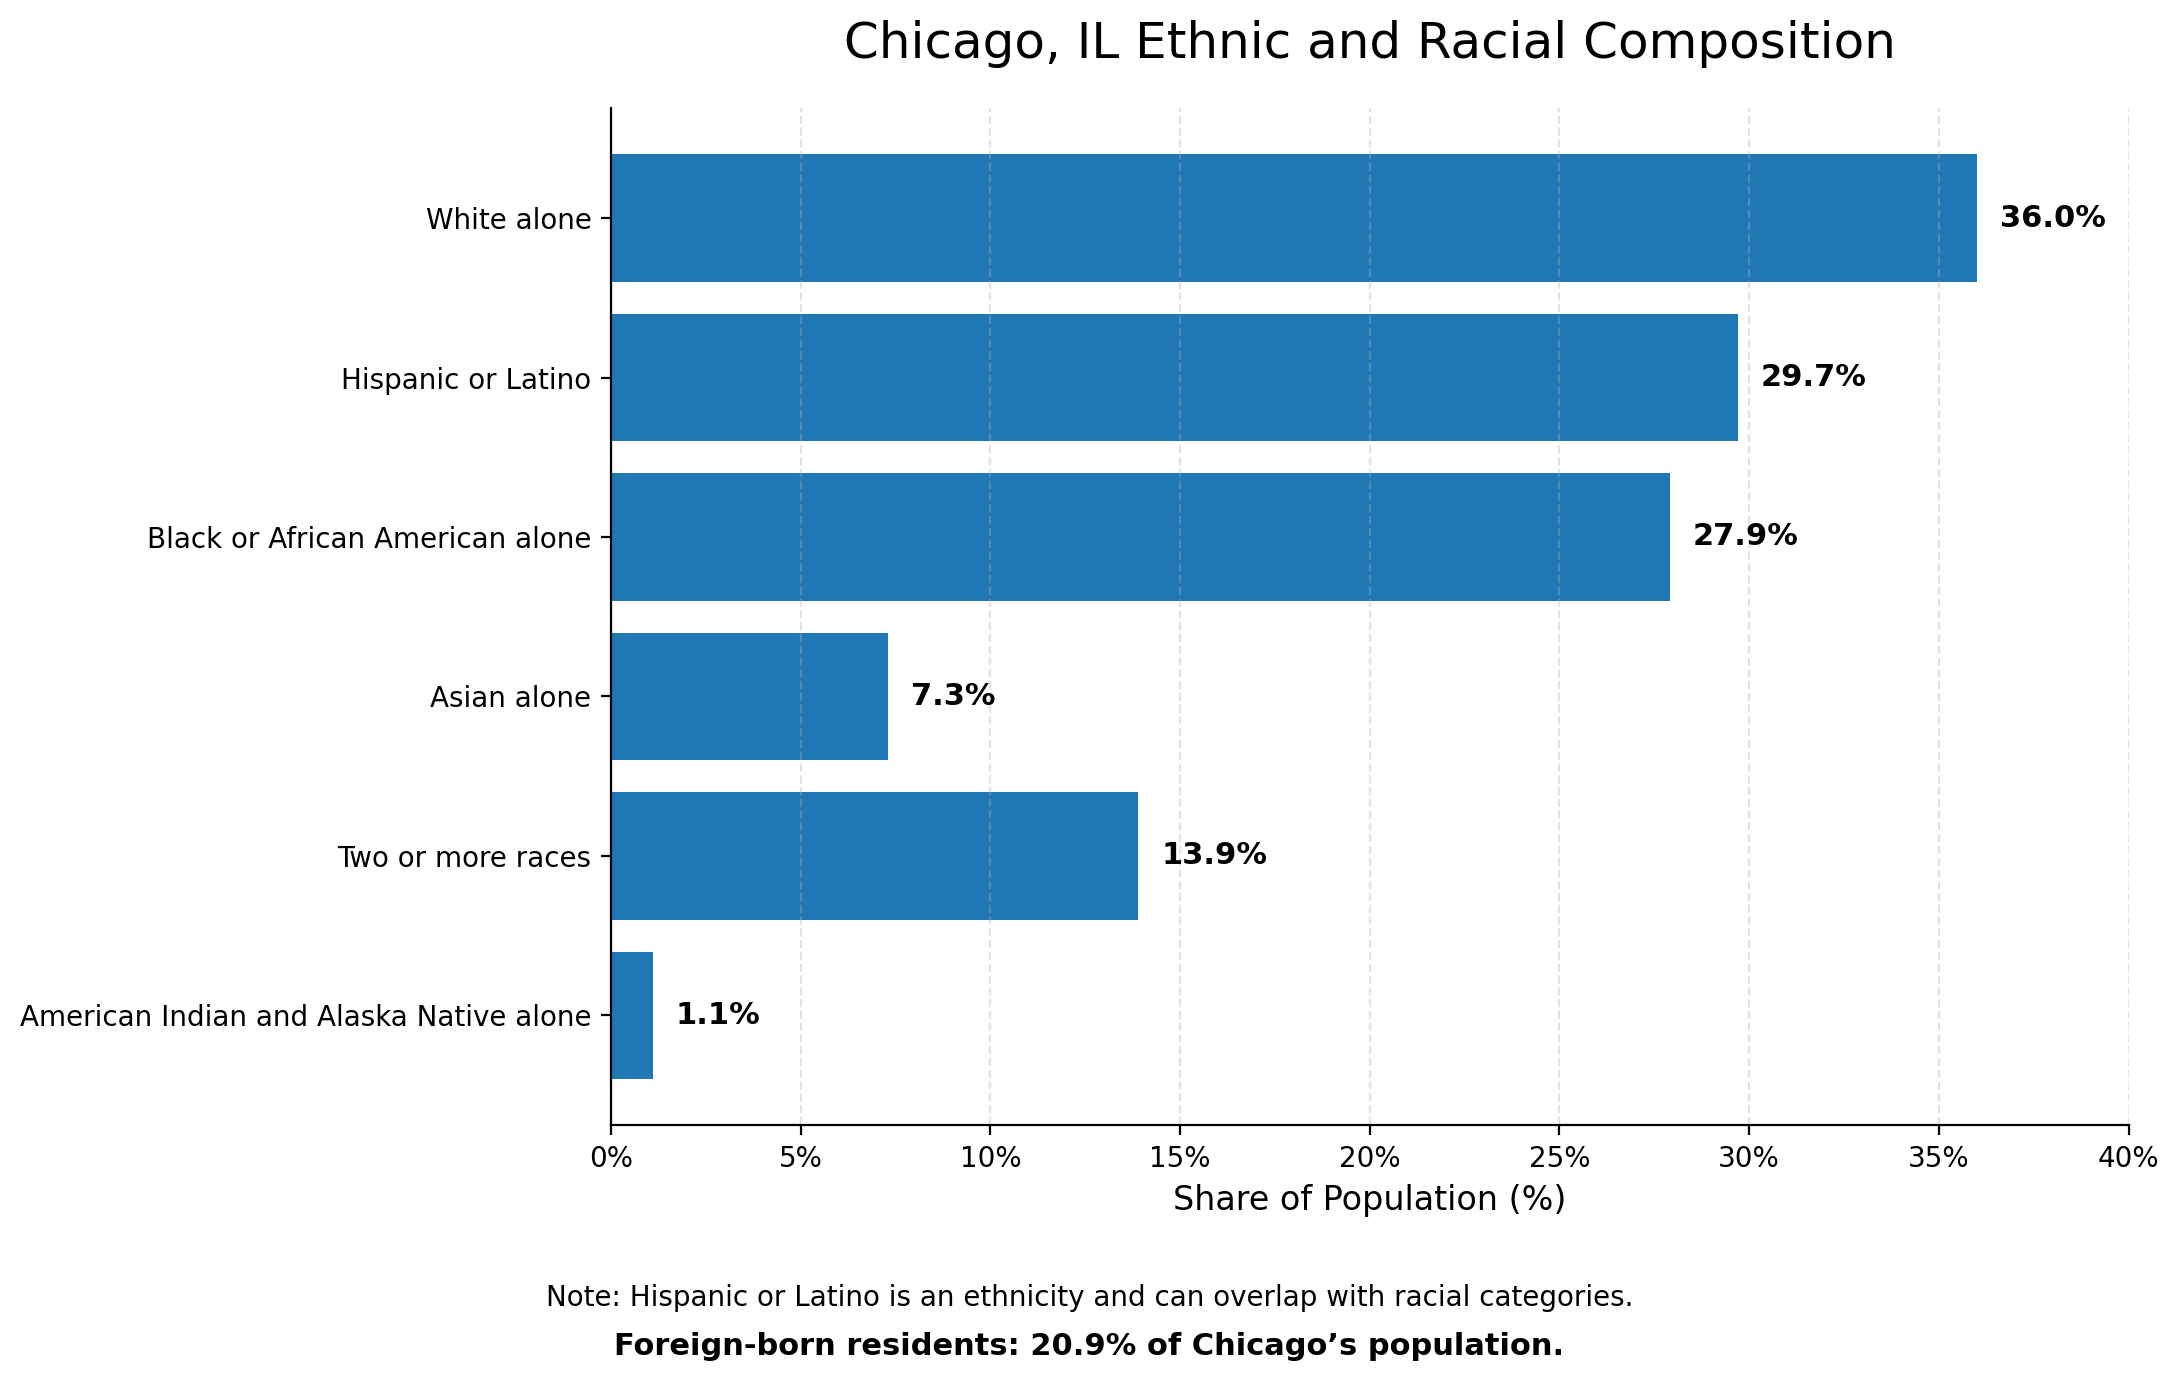
- The racial mix is 36.0% White alone, 29.7% Hispanic or Latino, 27.9% Black alone, and 7.3% Asian alone.
- The metro unemployment rate was 5.1% in April 2026.
- Chicago Public Schools has 316,224 students across 630 schools.
- Homicides fell to 416 in 2025, the lowest annual total since 1965.
- Health Care and Social Assistance is the top employer with 190,894 jobs.
1. Population Size and Growth
The population of Chicago reached 2,731,585 on July 1, 2025. The city added 10,277 people since the 2024 estimate of 2,721,308. The city is still 0.6% below the April 2020 headcount of 2,748,333, but the loss has stopped.
For the surrounding region, Macrotrends tracks the total metro population at 9,109,000 in 2026. This is up from 9,042,000 in 2025 and 8,984,000 in 2024.
2. Age Distribution
The latest Census QuickFacts profile breaks down the age groups.
- Residents between the ages of 18 and 64 make up 66.8% of the total.
- Children under the age of 18 account for 19.4%.
- Seniors aged 65 and older make up 13.8%.
Chicago, IL Population by Age Cohort
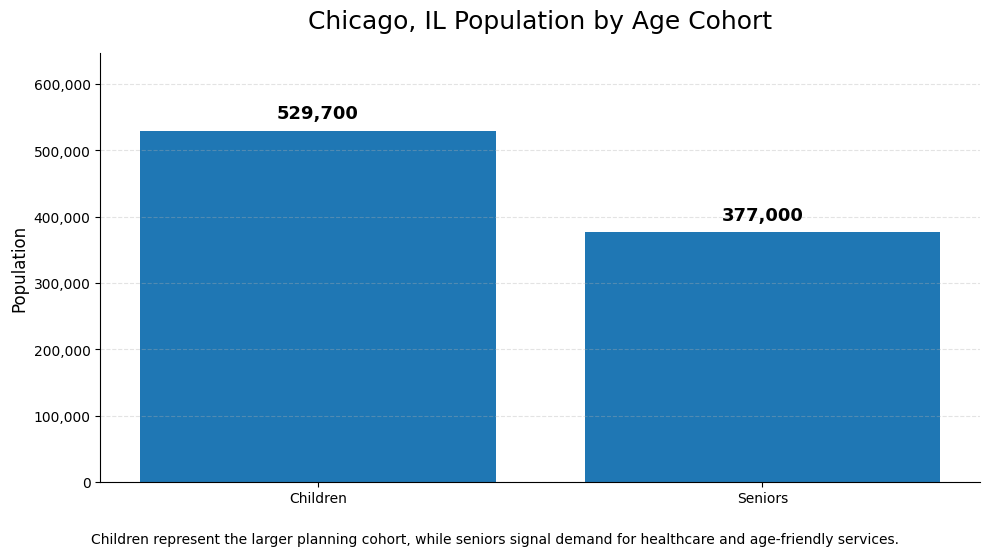
These numbers mean the city holds roughly 529,700 children and 377,000 seniors. The youth headcount dictates school planning, while the senior headcount determines demand for local healthcare.
3. Ethnic and Racial Composition
Here is the racial breakdown for Chicago.
4. Population by Neighborhood
Chicago has 77 official community areas. The table below displays population figures for fifty major sectors. For a deeper breakdown, use the CMAP 2025 Community Data Snapshots portal.
| Rank | Neighborhood | Population |
|---|---|---|
| 1 | Logan Square | 85,000 |
| 2 | Little Village | 80,460 |
| 3 | West Rogers Park | 65,010 |
| 4 | Albany Park | 57,200 |
| 5 | South Austin | 56,850 |
| 6 | Archer Heights | 55,070 |
| 7 | Rogers Park | 54,990 |
| 8 | Lake View | 53,040 |
| 9 | Gresham | 50,800 |
| 10 | Englewood | 49,560 |
| 11 | Brighton Park | 46,260 |
| 12 | South Shore | 44,820 |
| 13 | Portage Park | 43,600 |
| 14 | Humboldt Park | 41,600 |
| 15 | Jefferson Park | 41,050 |
| 16 | Gage Park | 39,560 |
| 17 | Cragin | 39,120 |
| 18 | Back of the Yards | 38,910 |
| 19 | Bridgeport | 38,030 |
| 20 | Lake View East | 37,740 |
| 21 | West Lawn | 35,430 |
| 22 | South Loop | 31,860 |
| 23 | Edgewater Beach | 31,400 |
| 24 | Marquette Park | 31,170 |
| 25 | Belmont Central | 31,080 |
| 26 | West Pullman | 29,640 |
| 27 | Bronzeville | 29,310 |
| 28 | South Chicago | 28,290 |
| 29 | Ravenswood | 27,790 |
| 30 | Garfield Ridge | 25,660 |
| 31 | West Englewood | 25,520 |
| 32 | North Austin | 24,160 |
| 33 | East Side | 23,370 |
| 34 | Uptown | 22,090 |
| 35 | Near North | 21,790 |
| 36 | West Town | 21,570 |
| 37 | Roseland | 21,370 |
| 38 | Streeterville | 21,160 |
| 39 | East Garfield Park | 21,130 |
| 40 | Hermosa | 20,910 |
| 41 | Heart of Chicago | 20,260 |
| 42 | Chicago Lawn | 18,910 |
| 43 | Chatham | 18,880 |
| 44 | Hyde Park | 18,430 |
| 45 | University Village – Little Italy | 18,350 |
| 46 | West Elsdon | 18,160 |
| 47 | Avondale | 18,000 |
| 48 | Bucktown | 17,310 |
| 49 | North Center | 17,130 |
| 50 | Morgan Park | 16,990 |
5. Crime Rate in Chicago
Crime numbers inside the city dropped during 2025. Here is the verified data from official police reports.
Annual Crime Breakdown
Data from city records on CrimeAtlas shows total annual reported offenses fell to 237,000 in 2025, down from 259,000 in 2024. We are still waiting to see if 2026 will show a continued drop in the crime rate.
Chicago homicides in 2025: 416 people slain. Here’s how that compares with previous years.https://t.co/TQ35EPbkUq
— Chicago Tribune (@chicagotribune) January 7, 2026
The Chicago Police Department reported 416 homicides for the full year of 2025. This is the lowest annual homicide count since 1965. Homicides stood at 587 in 2024.
CPD logs also show that total shooting incidents fell by 35%, and total shooting victims decreased by 34%. You can check the CPD statistics hub or the public City of Chicago 2025 crime dataset for updates.
Violent Crime
Robberies reached a total of 5,817 incidents across 2025 in the annual CrimeAtlas summary. Raw police data tracking is more precise than general crime indexes because it maps the exact type, date, and location of every violent offense.
Chances of Becoming a Victim of a Violent Crime
City records show raw crime counts rather than individual risk percentages. Public safety varies by street block and neighborhood density, so blanket citywide risk claims do not reflect reality.
Property Crime Details
Motor vehicle theft remained a major issue, with 17,253 cases logged in 2025. General theft made up the largest share of property offenses, mostly clustering around retail areas and public transit stations. Burglary totals continued a downward path.
Chances of Becoming a Victim of a Property Crime
Property risk depends entirely on the specific neighborhood. You can look at local police precinct logs directly to see the exact conditions.
Comparative Analysis with National Data

Violent Crimes in the U.S.
The volume of violent offenses remains an issue, but the 2025 drop shows progress. Past reports claiming a murder rate of 5.38 per 1,000 residents were false. That number was a broad violent crime calculation mistakenly labeled as a homicide rate.
Property Crimes in the U.S.
Shoplifting and vehicle theft create financial issues for local businesses. To compare Chicago to other major cities, use unified tools like the FBI Uniform Crime Reporting setup.
6. Unemployment Rates
View this post on Instagram
The labor market has stabilized after pandemic disruptions.
- The Bureau of Labor Statistics (BLS) recorded a metropolitan unemployment rate of 5.1% for April 2026.
- The total regional labor force holds 4.986 million individuals, with 4.731 million employed and 254,700 looking for work.
- This April 2026 rate is a drop from the older 6.2% mark.
- Total nonfarm payrolls reached 4.736 million positions in April 2026, a 0.1% annual increase.
7. Educational Attainment
Here is the layout of the public education system.
| School Type | Elementary Schools | High Schools | Total Schools |
|---|---|---|---|
| District-run | 423 | 91 | 514 |
| Charter | 50 | 58 | 108 |
| Contract | 0 | 6 | 6 |
| SAFE | – | 2 | 2 |
| Grand Total | 473 | 157 | 630 |
Key Facts
- Total Student Enrollment: The Chicago Public Schools (CPS) system tracks 316,224 students for the 2025-2026 school year.
- Total School Count: The network operates 630 schools, including 514 standard district schools, 108 charter schools, 6 contract schools, and 2 SAFE academies.
- The student body is 46.4% Latinx, 34.3% Black, 11.8% White, and 4.9% Asian. Records show 71.8% of students come from economically disadvantaged households.
- Regarding adult education, Census data reveals 87.2% of adult residents hold a high school diploma, while 44.3% have completed a bachelor’s degree or higher.
8. Housing and Living Conditions
The housing market shows a clear gap between home prices and rising rental costs.
- Data from Realtor.com shows a median home listing price of $369,000 in May 2026, a 1.39% annual increase.
- Median rent prices rose 7.68% over the past year, reaching $2,369 in May 2026.
- Sales tracking from Redfin shows a median closed sales price of $410,000, with properties spending about 50 days on the market.
- Long-term Census data marks the median home value at $334,100 and median rent at $1,440 for the 2020-2024 window. Real estate platforms display current pricing, while Census data shows a multi-year average.
9. Health and Well-being

The healthcare network is a massive employment driver for the city.
Data from Data USA shows the Health Care and Social Assistance sector employs 190,894 people inside the city, making it the top industry by size. For the broader metro region, the BLS reports 823,200 jobs in Education and Health Services as of April 2026, a 2.8% annual gain.
| Metric | Value |
|---|---|
| People Employed | 190,894 |
| Share of Workforce | About 13.6% |
| Employment Rank | 1st (Largest City Industry) |
General indicators show 8.4% of non-senior residents live with a disability, while 11.0% of people under the age of 65 have no health insurance coverage.
10. Economy and Employment

The local economy supports a massive job count across professional services and logistics.
| Metric | Value |
|---|---|
| Total Internal Employment | 1.4 million jobs (city, 2024) |
| Metro Nonfarm Payrolls | 4.736 million positions (April 2026) |
| Top Industry by Volume | Health Care and Social Assistance (190,894 workers) |
| Top Sector by Pay | Management of Companies ($102,757 median) |
According to city sheets on Data USA, the internal economy supports 1.4 million jobs. Health Care leads employment volume, followed closely by Professional, Scientific, and Technical Services at 187,681 workers, and Educational Services at 146,269 workers.
Industries in Chicago
| Industry | Number of Employees | Share of Workforce (%) |
|---|---|---|
| Health Care & Social Assistance | 190,894 | About 13.6% |
| Professional, Scientific, & Technical Services | 187,681 | About 13.4% |
| Educational Services | 146,269 | About 10.4% |
| Trade, Transportation & Utilities | 923,600 (metro) | Metro sector |
| Education & Health Services | 823,200 (metro) | Metro sector |
| Professional & Business Services | 786,700 (metro) | Metro sector |
| Leisure & Hospitality | 469,800 (metro) | Metro sector |
Corporate data tracks the highest median wages to the Management of Companies sector at $102,757, followed by Utilities at $101,578 and Finance and Insurance at $98,848.
Employment by Occupation
| Occupation Group | Data Tracker Source | Regional Focus |
|---|---|---|
| Office & Administrative Support | BLS OEWS Registry | Concentration above the national average |
| Management Occupations | BLS OEWS Registry | High-wage corporate block |
| Sales & Related Roles | Census ACS Sheets | Main service sector driver |
| Business & Financial Operations | Census ACS Sheets | Professional employment core |
The BLS Occupational Employment Wages data shows that administrative support and corporate management roles retain a higher concentration in Chicago than the national average.
Income and Earnings

Income Inequality
The median household income inside the city stands at $77,902, with a per capita income of $50,086. The poverty rate sits at 16.8%. You can use the CMAP registry to track these local wealth gaps.
11. Migration Patterns
More migrants in Chicago to be evicted from shelters as new facility opens https://t.co/rI1T5uK5DL
– NBC Chicago (@nbcchicago) June 11, 2024
The addition of 10,277 residents shows that the population drop has reversed. While the city continues to lose some residents to domestic outmigration, that outflow has slowed down. Growth comes from international immigration and natural population growth.
The official City of Chicago New Arrivals Dashboard tracks emergency housing and transit data for incoming groups. Reports from local entities like the 40th Ward hub note that roughly 40,000 asylum seekers have arrived in the city since late 2022. This population shift changes school registration, clinic demand, and municipal budget plans.
International Immigration

Immigration remains a primary driver for local neighborhoods. Census data shows 20.9% of the population was born outside the country, and 35.4% of households use a language other than English at home.
12. Predicted Future Demographics
| Year | Population | Change (%) from Previous Period |
|---|---|---|
| 2020 | 2,746,388 | Baseline count |
| 2024 | 2,721,308 | Post-pandemic drop |
| 2025 | 2,731,585 | +0.38% change |
- 2020 Baseline: The official decennial headcount locked the population of Chicago at 2,746,388.
- Current Status: The latest estimate tracks the population at 2,731,585 on July 1, 2025, which serves as the core metric for this 2026 assessment.
- Future Outlook: The city has reclaimed most of the population lost after 2020. Long-term trajectory changes will depend on local job growth, neighborhood safety, and housing availability.
@jacobfriedmanrealtor Is this the future of downtown Chicago… or another Chicago Spire? 🤔 #chicago #chicagotiktok #downtownchicago #chicagonews #news #chitown ♬ No Loss – Instrumental Version – Canon
Speculative projections for 2030 matter less than these current metrics. The data shows Chicago is expanding its population again. Future expansion depends on real-world issues like neighborhood safety, real estate costs, and consistent migration patterns.
Methodology
The article uses public sources that are current or recently updated for a 2026 population overview. Sources include:
- U.S. Census Bureau for Chicago population, age, race, ethnicity, housing, income, poverty, education, health insurance, and foreign-born statistics.
- Macrotrends for the 2026 metro-style population estimate.
- Chicago Public Schools for 2025-2026 enrollment and school counts.
- Bureau of Labor Statistics for April 2026 Chicago metro unemployment and payroll employment.
- City of Chicago Data Portal, Chicago Police Department, and CrimeAtlas for 2025 crime updates.
- Realtor.com and Redfin for March 2026 housing market data.
- Data USA for 2024 city employment, industry, and earnings data.
- CMAP for small-area population context and regional indicators.
- City of Chicago New Arrivals Dashboard for migration and arrivals context.
References
- U.S. Census Bureau – Chicago Census QuickFacts
- U.S. Census Bureau – 2020s City and Town Population Totals
- Macrotrends – Chicago Metro Area Population
- Census Reporter – Chicago-Naperville-Elgin Metro Area Profile
- CMAP – 2025 Community Data Snapshots
- Chicago Police Department – Data and Statistics
- City of Chicago Data Portal – Crimes 2025 Dataset
- CrimeAtlas – Chicago 2025 Crime Summary
- Chicago Police Department – 2025 in Review
- Bureau of Labor Statistics – Chicago Metro Economy at a Glance
- Bureau of Labor Statistics – Occupational Employment and Wages in Chicago
- Chicago Public Schools – Stats and Facts
- Realtor.com – Chicago Housing Market Overview
- Redfin – Chicago Housing Market
- Data USA – Chicago Economy and Income Statistics
- CMAP – Gini Coefficient Indicator
- City of Chicago – New Arrivals Dashboard
- 40th Ward Chicago – New Arrivals Context