U.S. Population growth rebounds sharply post-pandemic.
The United States has recorded a nearly 1% population increase since 2023, marking a dramatic recovery from the historically low growth rates experienced during the height of the COVID-19 pandemic.
This surge surpasses the average annual growth observed since 2000, highlighting a significant turnaround from the minimal gains that defined the early years of this decade.
The latest figures suggest a renewed acceleration in demographic trends as the nation moves further from the pandemic’s impact.
As of July 1, 2024, the United States appears to have fully rebounded from the pandemic-era population stagnation, recording its third consecutive year of growth exceeding 0.5%.
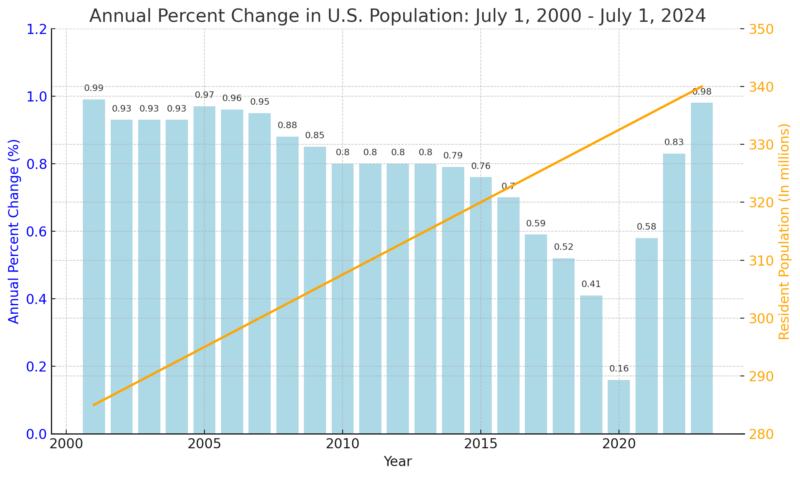
According to new estimates released by the U.S. Census Bureau, the nation’s population reached 340.1 million, reflecting a 0.98% increase from 336.8 million on July 1, 2023. This marks the highest annual growth rate since the 0.99% rise observed between 2000 and 2001.
Table of Contents
ToggleTrends and Influences Since 2000
-
Annual percent change and resident population trends in the U.S. (2000-2024)
The U.S. population has grown by nearly 58 million since 2000, with an average annual growth rate of about 0.8%. The most significant expansion occurred between 2001 and 2008, driven by shifting migration patterns and higher birth rates during that period.
Over the past two decades, population trends have varied, reflecting the impact of major national and global events on growth rates. For example, heightened national security concerns following the 9/11 attacks led to a decline in migration, slowing growth between 2001 and 2003.
Similarly, the financial crisis of 2008, known as “The Great Recession,” had a notable effect on both fertility rates and immigration. Between 2008 and 2009, births decreased by nearly 3%, while net international migration dropped by almost 12% according to the OECD report. These events highlight how external factors can significantly shape demographic trends.
By the early 2010s, the rate of U.S. population growth had started to decelerate. Although there was a brief increase in growth during 2014-2015, the trend slowed once more. By 2016, a new phase of sluggish growth emerged, driven by decreasing net international migration and declining birth rates.
Impact of the COVID-19 Pandemic on U.S. Population Growth and Recovery
NEW: Growth in the U.S. #population shows an early indication of recovery amid the #COVID19 pandemic, based on new population estimates released today.
What was the primary driver of growth?
➡️ https://t.co/hBSGsGZVVZ pic.twitter.com/B3wqDxw1y9— U.S. Census Bureau (@uscensusbureau) December 22, 2022
The COVID-19 pandemic significantly slowed U.S. population growth in the early 2020s. A national emergency declaration led to travel restrictions that temporarily limited entry into the country.
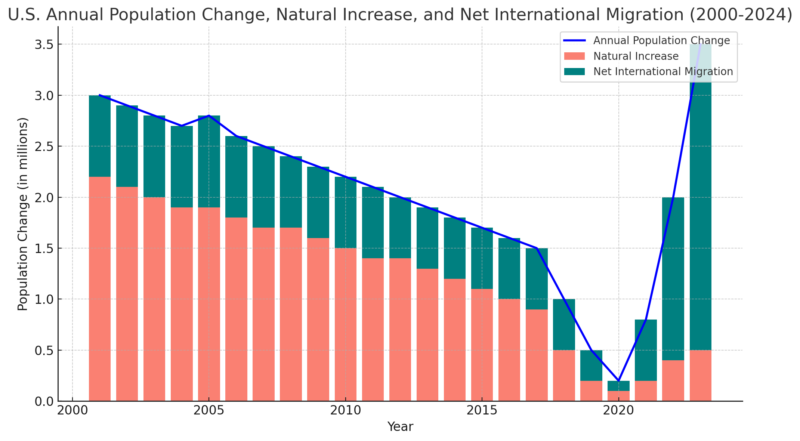
At the same time, the number of deaths surged while births declined, resulting in the slowest recorded population growth in 2021, with an increase of just 0.16%. This starkly highlighted the pandemic’s impact on demographic trends.
As the nation began to recover from the pandemic, population growth rebounded sharply, more than doubling from 2021 to 2022. Easing travel restrictions and increased migration contributed to the accelerated growth, alongside a modest rise in births and a decrease in deaths.
By 2024, the United States had experienced three consecutive years of population growth exceeding 0.5%, signaling a full recovery from the pandemic-era population stagnation.
Key Factors Driving U.S. Population Change
Natural increase (births minus deaths) and net international migration (immigration minus emigration) are the primary drivers of population growth in the United States. However, their relative contributions to growth have shifted significantly over time.

Historically, natural increase was the primary engine of U.S. population growth. In recent years, however, its impact has waned due to declining birth rates and an increasing number of deaths.
This trend is largely driven by the aging Baby Boomer generation, born between 1946 and 1964, entering higher-mortality age groups. While there was a brief rise in births between 2021 and 2022, the decline resumed in 2023.
Conversely, net international migration has become an increasingly prominent contributor to population growth in recent years. Since 2021, it has accounted for the majority of the nation’s growth, marking a significant shift from the previous two decades when natural increase was the dominant factor. This changing dynamic underscores the evolving nature of U.S. population trends.
However, not all regions have experienced growth. Major urban centers like New York City and San Francisco have faced population declines.
New York City, for instance, lost approximately 360,000 residents from 2021 to 2022, though this was a nearly 60% reduction from the previous year’s loss.
San Francisco experienced a 7.2% population drop between 2020 and 2021, with a further 0.3% decline from 2021 to 2022.
Related Posts:
- Utah Ranks in Top 5 Growth States as US Population…
- US Life Expectancy 1950-2025 - Trends and Influences…
- SSA Targets 15 Million Field Office Visits in 2026,…
- World Population Grows by Over 71 Million in 2024,…
- Why Over 25 Million Americans Are Still Uninsured…
- Over 22 Million People in the US had ADHD in 2025


