Jockeys operate under conditions that are inherently risky. Between 1993 and 1996, a total of 6,545 injury events occurred during official races, amounting to an average of 600 injuries per 1,000 jockey years according to Jamanetwork.
Despite a 33% decrease in injury rates over this period, the nature and causes of injuries remained largely unchanged.
Table of Contents
ToggleKey Takeaways
Statistical Overview of Jockey Injuries

Jockey injuries are both frequent and severe, ranging from minor abrasions to catastrophic outcomes. Data collected from organizations like the National Institute for Occupational Safety and Health (NIOSH) and studies conducted in the United States provide a clear picture of the physical toll jockeys endure.
General Injury Statistics
- The rate of injuries during races is 600 per 1,000 jockey years, underscoring the extreme risk inherent in the profession.
- An analysis of 1,100 active jockeys revealed that 69% of career injuries resulted from being unseated from a horse.
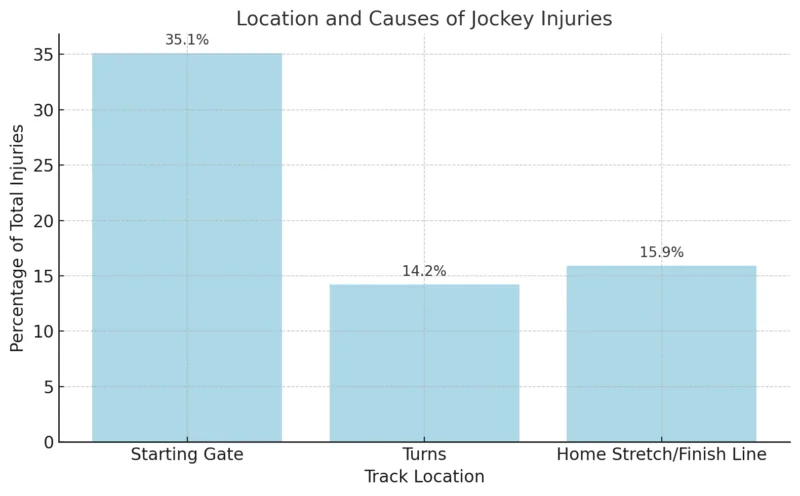
- Starting gate-related incidents account for 35% of all injuries during races, making this the most injury-prone stage of the event.
Injury Type/Context
Statistic
Injuries during races
600 per 1,000 jockey years
Injuries caused by falls
69% of career injuries
Starting gate injuries
35% of all race-related injuries
Injuries during the home stretch or finish
16%
Injuries in track turns
14%
Common Injury Types
Jockey injuries often involve fractures, concussions, and soft tissue damage. Serious head and spinal cord injuries also occur with troubling regularity, resulting in significant career interruptions or permanent disability.
Key Findings on Injury Types
- Fractures account for 64% of career injuries. Legs, shoulders, and arms are the most commonly affected areas.
- Head and spinal cord injuries are among the most serious and life-altering outcomes.
- Injuries often occur in high-risk scenarios, such as collisions with starting gates or being thrown from a horse.
Health Challenges Beyond Physical Injuries

The pressures of jockeying extend beyond physical harm, affecting long-term health due to weight maintenance practices and other occupational demands.
Disordered Eating and Weight Management
- Jockeys often adopt unhealthy behaviors to meet strict weight limits, such as vomiting, excessive exercise, and food restriction.
- Common practices include sauna use and laxative abuse, leading to issues like dehydration, heat stress, and nutritional deficiencies.
- A study of jockeys in South Africa found that 57% engaged in food restriction and 35% used diuretics regularly—similar trends are observed globally.
Health Risk
Potential Consequence
Vomiting
Dental erosion, esophageal damage
Laxative/Diuretic abuse
Dehydration, electrolyte imbalance
Chronic food restriction
Nutritional deficiencies, low bone density
Sauna used for weight loss
Heat stress, cardiovascular strain
Interventions and Safety Improvements
Efforts to reduce injuries and improve safety for jockeys have led to some encouraging developments. From technological innovations to legislative measures, these interventions aim to address both immediate risks and long-term health concerns.
Track and Equipment Innovations
Replay on repeat! 🔁
See you at the @BreedersCup, Mixto. pic.twitter.com/nNV7DpB1YX
— Del Mar Racetrack (@DelMarRacing) September 1, 2024
- Safety Rails: Del Mar Racetrack in California introduced thermoplastic elastomer safety rails, reducing the severity of injuries during falls.
- Synthetic Tracks: Tracks like Keeneland Racetrack in Kentucky adopted “Polytrack,” a synthetic surface providing a cushioning effect to lessen injury severity.
Intervention
Description
Safety rail installations
Thermoplastic elastomer covers instead of metal posts
Synthetic surfaces
Polytrack cushioning to reduce fall injuries
Policy and Legislative Actions
- California introduced a minimum jockey weight of 118 pounds, increasing the standard by 6–8 pounds to promote better health.
- Proposals for a nationwide nutritional and health assessment of jockeys could inform policy changes regarding weight limits and health management.
Comparison with Horse Racing Safety Statistics

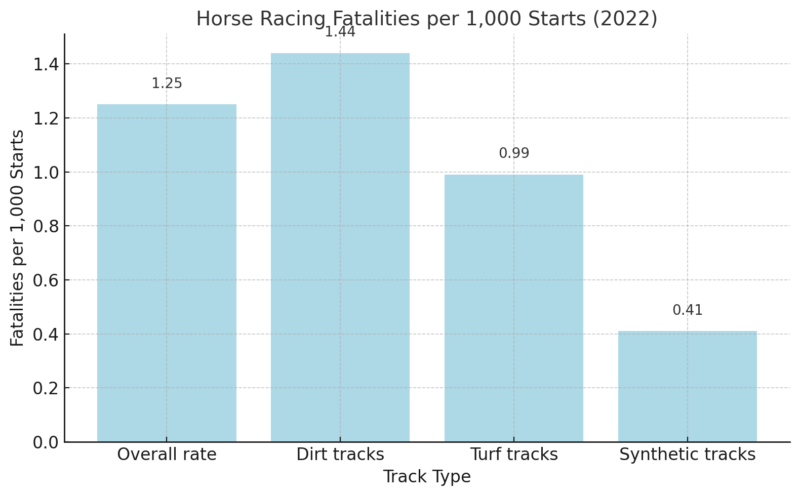
The Equine Injury Database (EID) provides valuable insights into horse racing safety, indirectly reflecting the risks faced by jockeys.
While the EID has shown a 37.5% decline in fatal injuries among horses since 2009, it highlights the need for a similar evidence-based approach for jockeys.
For those who follow horse racing with enthusiasm, it’s important to acknowledge both the excitement and the challenges of the sport. Platforms like BoyleSports provide you with a way to engage with racing events while staying informed about the intricacies of the industry.
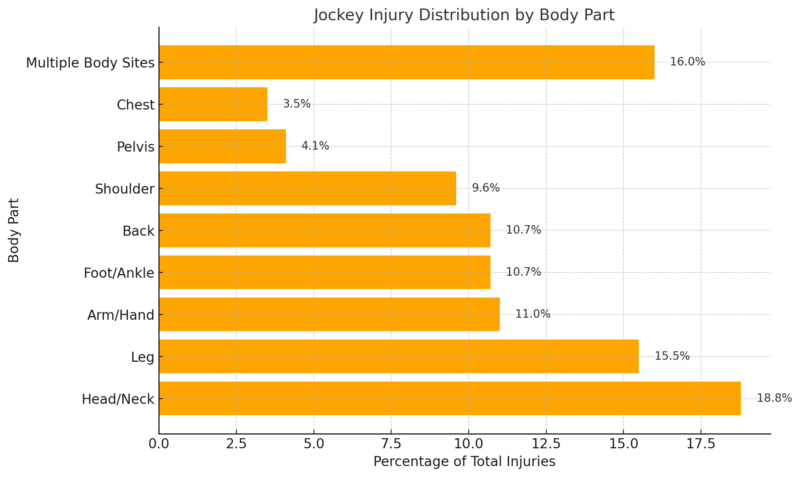
Injury Distribution by Body Part
This is the distribution of injuries by body part, based on recorded data:

Head and neck injuries, often the most critical, accounted for nearly one in five reported cases. These injuries typically result from being thrown off a horse or being struck by the horse’s head.
Location and Causes of Injuries
The starting gate was identified as the most injury-prone location, accounting for 35.1% of all incidents. The distribution of injuries by location is shown below:

The leading causes of injuries included:
- Being Thrown from the Horse: 44.4% of cases
- Crushing Incidents: 9.6%
- Flipping and Pinning: 7.5%
- Struck by Horse’s Head: 5.3%
Common Injury Patterns and Mechanisms
Head and Neck Injuries
According to Mad Barn head and neck injuries accounted for 18.8% of all incidents. These injuries were most often caused by:
- Being thrown from the horse (41.8%).
- Being struck by the horse’s head (23.2%).
Of these, nearly 30% of head injuries occurred in the starting gate, indicating that this is a critical area for targeted safety interventions.
Leg and Foot Injuries
@thingspeoplepod Asking a jockey how many injuries he’s had 😬 #jockey #horseracing #cheltenhamfestival #grandnational #injury #podcast #joemarler ♬ original sound – Joe Marler’s Things People Do
Leg and foot injuries were the second most common, accounting for 15.5% of all injuries. Over 52% of these injuries occurred at the starting gate, with the leading causes being:
- Crushing incidents (36.6%).
- Flipping and pinning (27.2%).
Back and Chest Injuries
Back and chest injuries often occurred when jockeys were thrown from their horses. These types of incidents accounted for:
- 55.1% of back injuries.
- 49.6% of chest injuries.
Methodology
We reviewed injury data from trusted sources like the National Institute for Occupational Safety and Health (NIOSH) and the Equine Injury Database (EID).
The analysis relied on documented incidents between 1993 and 1996, emphasizing injury types, locations, and causes.
Studies on jockey health practices and challenges, including dietary behaviors, were integrated to provide a holistic view of their risks.
Safety interventions, such as track innovations and policy changes, were examined for their impact on reducing injury rates.
Horse racing safety statistics from the EID were used as a comparative framework to assess overall industry progress.
The article was structured to combine data insights with actionable recommendations, ensuring readers gain a clear understanding of the silent crisis facing jockeys.
References
- JAMA Network – Injuries Among Professional Jockeys in the United States
- CDC NIOSH – Jockey Safety and Health Study
- Mad Barn – Jockey Injuries in the United States
- Del Mar Racetrack – Safety Innovations for Horse and Jockey Protection
Related Posts:
- Birth Injuries in the U.S. - A Statistical Analysis
- Top 5 Causes of Cardiovascular Diseases: Statistical…
- 30 Million People Struggle to Breathe - Delhi’s Smog…
- Scientists Uncover 580,000-Year Climate Record That…
- The Fentanyl Crisis in the United States Heads Into…
- 3 Key Insights into Circumcision Trends in the U.S.…


