
Virginia Beach, located in Virginia Beach City, Virginia, is estimated to have a population of 451,637 in 2025, according to the World Population Review.
The city is experiencing a slight decline, with an annual decrease rate of -0.44%. Since the 2020 census, which recorded a population of 459,684, Virginia Beach’s population has decreased by approximately -1.75%.
The city’s metro area is experiencing similar trends, with projections indicating a population of around 1,505,000 in 2025 as noted by Macrotrends.
This increase underscores the area’s attractiveness due to its quality of life, amenities, and economic opportunities. With its scenic oceanfront and numerous recreational activities, Virginia Beach continues to draw new residents.
Key Takeaways
Age Distribution
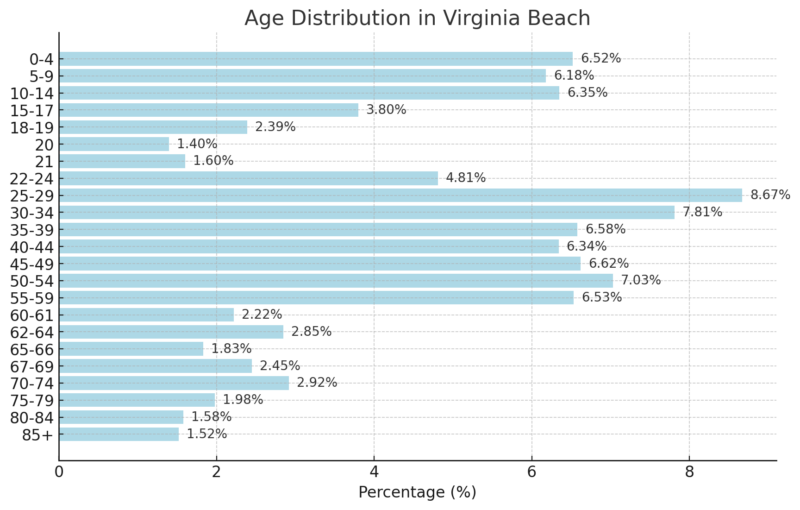
The largest age group is 25-29 (8.67%), followed closely by 30-34 (7.81%) and 50-54 (7.03%), indicating a strong working-age population according to Statistical Atlas.
Children (0-9 years) comprise a consistent portion of the population (around 6.52%-6.35%), reflecting a stable birth rate.
The senior population (70+) is relatively small, with the 85+ group comprising only 1.52%, suggesting an overall younger population structure.
The population distribution highlights a steady number of young professionals, with a likely mix of students, early-career individuals, and middle-aged professionals.
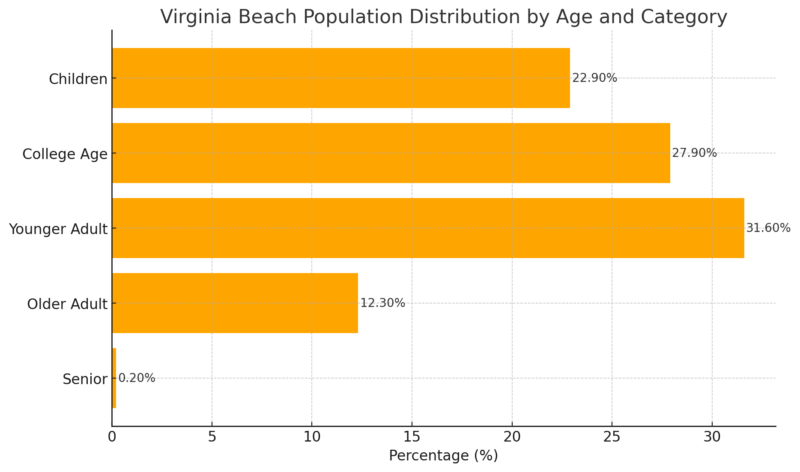
Younger adults (31.6%) make up the largest segment, indicating a strong workforce presence.
A significant portion (27.9%) are college-age individuals, likely due to the presence of universities and military personnel in the area.
Children (22.9%) show a relatively balanced proportion, reflecting family-oriented communities.
Older adults (12.3%) and seniors (0.20%) make up a smaller fraction, reinforcing the idea of a working-age and young adult-heavy population.
Demographic and Citizenship Breakdown
Category
Total
Year-over-Year Change (%)
Median Age
37.1
1.1%
Citizen (U.S. Born)
402,494
0.0%
Citizen (Not U.S. Born)
39,877
0.3%
Not a Citizen
15,529
0.7%
The median age of 37.1 years marks a 1.1% increase, indicating a slightly aging population.
This rise suggests a gradual shift toward an older demographic, which could impact workforce dynamics, healthcare services, and economic planning in the region.
Citizenship Status Breakdown
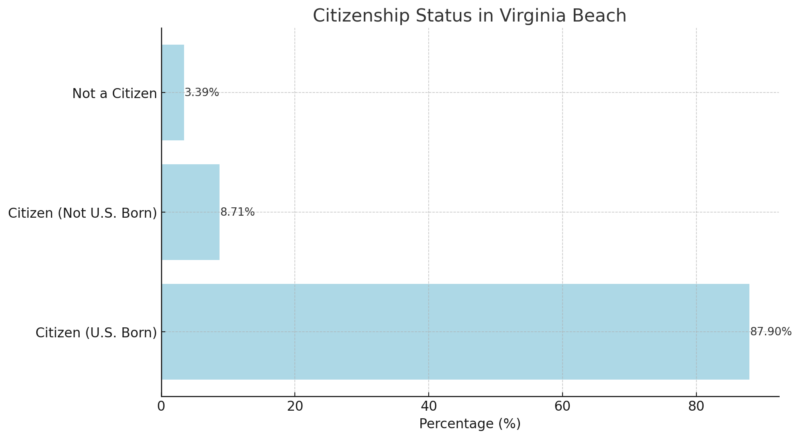
The U.S.-born citizen population remains steady at 402,494, comprising 87.9% of residents as noted by Point2Homes.
There has been a 0.3% increase in naturalized citizens (39,877), suggesting a growing immigrant population obtaining U.S. citizenship.
The non-citizen population (15,529) has grown by 0.7%, now representing 3.39% of the total population.
These trends reflect gradual diversification and an increasing role of foreign-born residents in Virginia Beach.
Ethnic and Racial Composition
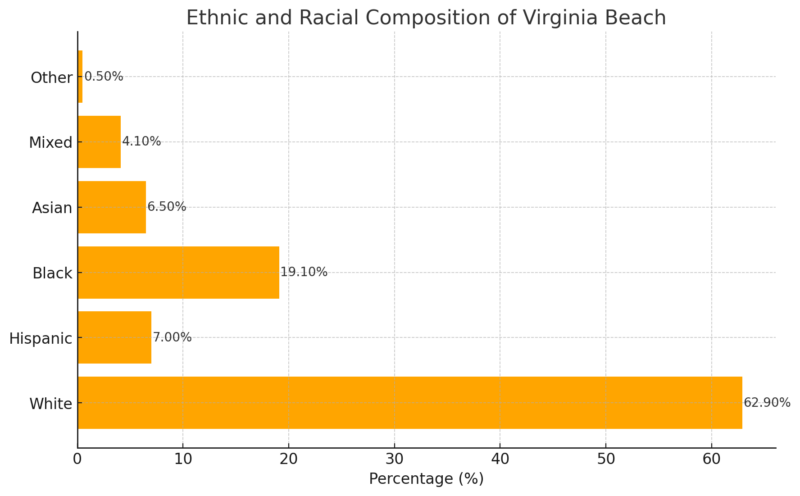
Statistical Atlas shows that 62.9% of the population identifies as White, making it the dominant racial group.
This aligns with broader demographic trends in Virginia but may indicate a slightly higher percentage of racial diversity compared to the national average.
At 19.1%, the Black community represents the second-largest racial group in Virginia Beach.
This percentage is notably higher than the Hispanic and Asian populations, indicating a strong historical and cultural presence.
The Hispanic population (7.0%) and Asian population (6.5%) suggest a growing diversity in the city.
While still smaller than in some other metropolitan areas, these numbers indicate an increase in immigration and cultural shifts.
Economic and Employment Overview
Virginia’s October County and Area Employment Figures Released; Over-the-Year Unemployment Rates Decreased in Most of Virginia’s Counties and Metropolitan Statistical Areashttps://t.co/mCiuD1NgXL
— DWDA (@VirginiaLMI) November 27, 2024
The data from BLS reflects a strong job market with declining unemployment but lower-than-average wages compared to the national level.
The construction, healthcare, and manufacturing sectors are driving employment growth, while wages and benefits remain below U.S. averages.
Inflation is stabilizing, with declining food and energy prices benefiting consumers.
Unemployment Rates
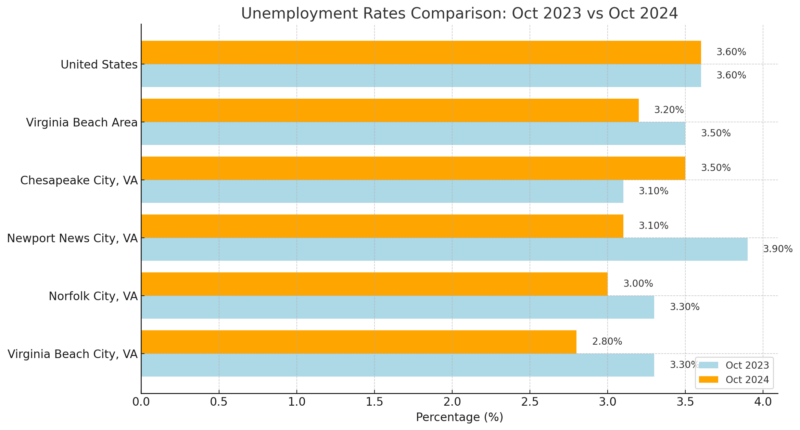
The unemployment rate in Virginia Beach City declined from 3.3% to 2.8%, indicating a healthier job market.
Norfolk and Newport News also saw improvements, while Chesapeake experienced a slight increase.
The Virginia Beach Area overall saw a drop from 3.5% to 3.2%, reflecting strong regional employment growth.
The national unemployment rate remained unchanged at 3.6%, meaning Virginia Beach is outperforming the country in job recovery.
Average Weekly Wages
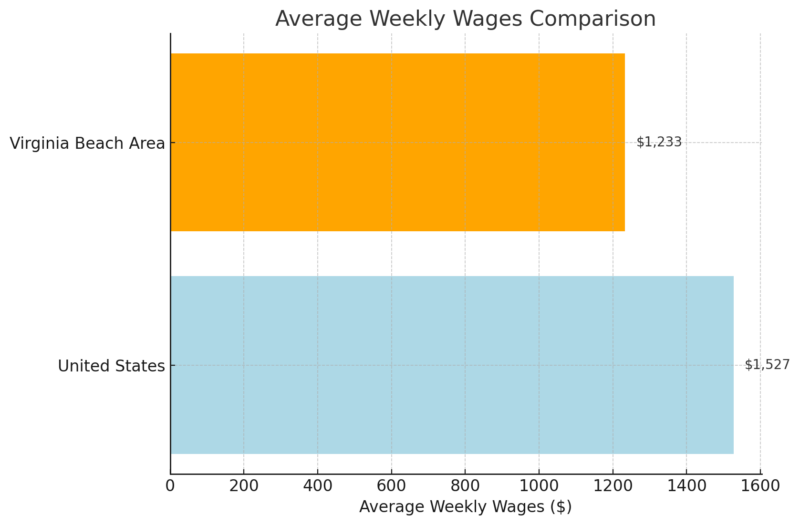
Workers in the Virginia Beach area earn significantly less ($1,233 per week) compared to the national average ($1,527).
This wage gap (around $294 less per week) suggests either a lower cost of living or differences in high-paying industries present in the area.
The local economy may be more service-based, with fewer high-paying tech or financial sector jobs.
View this post on Instagram
Employment Changes by Industry
Industry
Employment (Thousands)
Change (Thousands)
Change (%)
Total Nonfarm Employment
829.0
14.9
1.8%
Mining, Logging, and Construction
45.8
4.2
10.1%
Manufacturing
60.2
1.5
2.6%
Trade, Transportation, and Utilities
132.3
0.8
0.6%
Information
8.8
0.0
0.0%
Financial Activities
43.3
0.3
0.7%
Professional and Business Services
124.2
2.4
2.0%
Education and Health Services
122.8
3.0
2.5%
Leisure and Hospitality
94.0
0.3
0.3%
Other Services
35.6
0.3
0.8%
Government
162.0
2.1
1.3%
Mining, Logging, and Construction had the largest growth (10.1%), indicating strong development projects or infrastructure investments.
Manufacturing and Education & Health Services also grew at 2.6% and 2.5%, reflecting demand in these industries.
Trade, Transportation, and Utilities had minimal growth (0.6%), suggesting slower economic activity in logistics.
The Information sector remained stagnant (0.0%), highlighting possible challenges in tech or media-related job growth.
Government employment (1.3%) increased, possibly due to public sector hiring initiatives.
Employer Costs per Hour Worked
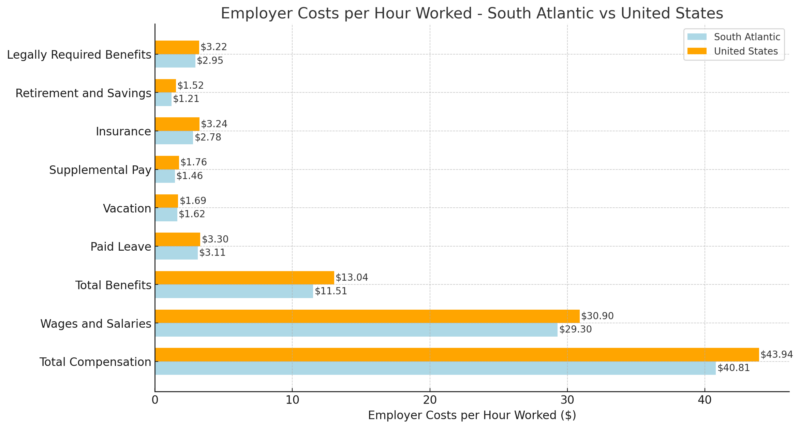
South Atlantic region workers receive lower compensation ($40.81/hr) compared to the national average ($43.94/hr).
The gap is particularly seen in benefits like retirement savings and insurance, which are lower than the U.S. average.
Paid leave and vacation time are slightly less generous, possibly indicating less favorable work-life balance policies.
Lower wages may reflect differences in industry composition, with fewer high-paying tech or finance jobs in Virginia Beach.
Average Hourly Wages for Selected Occupations
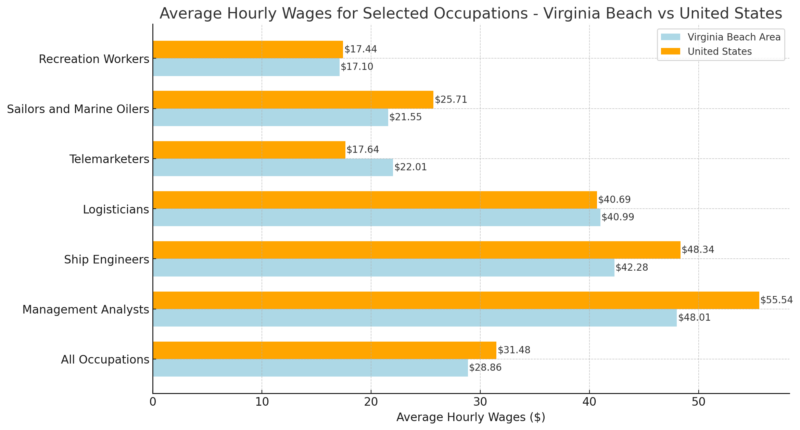
Overall, Virginia Beach area wages are lower ($28.86/hr) than the U.S. average ($31.48/hr).
Management analysts and ship engineers earn significantly less locally than their national counterparts.
Logisticians earn slightly more in Virginia Beach, likely due to military, shipping, and port-related industries.
Telemarketers in Virginia Beach earn more than the national average ($22.01 vs. $17.64), indicating a strong call-center industry.
Sailors and marine oilers earn less locally ($21.55 vs. $25.71), despite Virginia Beach being a coastal city, possibly due to a surplus of workers in this field.
Recreation workers earn close to the national average, reflecting stable demand in the leisure industry.
Consumer Price Index (CPI-U) 12-Month Changes
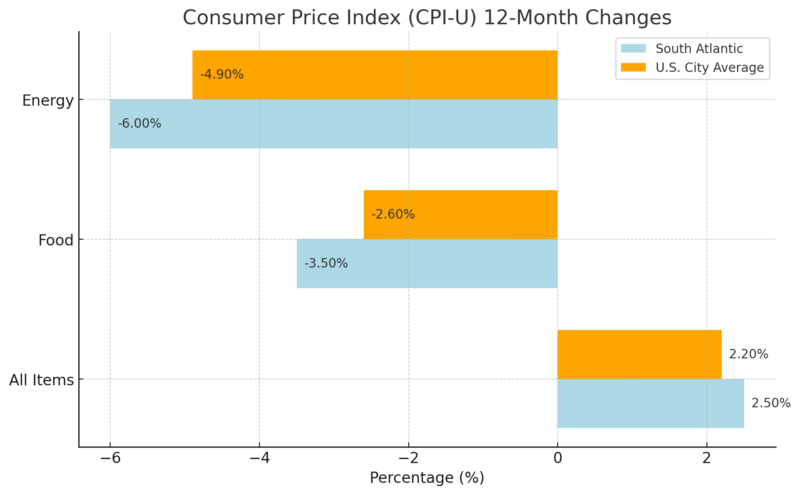
Overall inflation is slightly higher in the South Atlantic (2.5%) compared to the U.S. average (2.2%).
Food prices declined significantly (-3.5%), indicating deflation in grocery costs.
Energy prices dropped even further (-6.0%), helping reduce household expenses.
The decline in energy costs suggests lower gasoline prices or reduced electricity costs in Virginia Beach.
Income Distribution
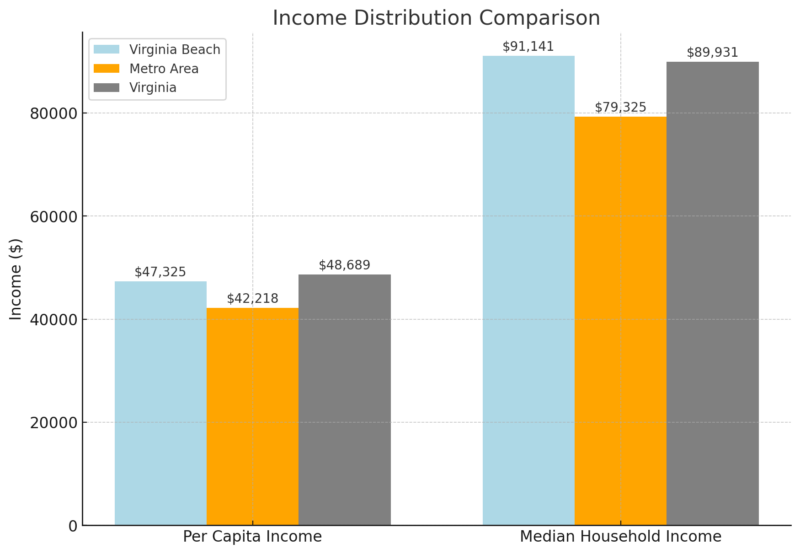
Virginia Beach has a higher per capita income ($47,325) compared to the metro area ($42,218), indicating a stronger individual earning potential in the city.
However, it is slightly lower than Virginia’s state average ($48,689), suggesting regional economic alignment but slightly below the state’s highest income earners.
The median household income in Virginia Beach ($91,141) is about 20% higher than the metro area ($79,325), demonstrating that households in the city tend to have more financial stability and earning capacity according to Census Reporter.
The median household income is comparable to the state’s average ($89,931), implying that Virginia Beach’s overall economic prosperity aligns well with state trends.
Household Income Breakdown
Income Bracket
Virginia Beach (%)
Metro Area (%)
Virginia (%)
Under $50K
24%
31%
28%
$50K – $100K
31%
–
–
$100K – $200K
32%
–
–
Over $200K
14%
–
–
Only 24% of households in Virginia Beach earn less than $50K, which is significantly lower than the metro area (31%) and Virginia (28%).
This suggests that Virginia Beach has a lower proportion of low-income households, indicating a stronger middle-class presence.
The largest income group falls between $50K – $200K (63%), showing a strong middle- and upper-middle-class economy.
14% of households earn over $200K, indicating that a moderate number of high-income earners contribute to the city’s economic stability.
Poverty Rates in Virginia Beach
Category
Virginia Beach (%)
Metro Area (%)
Virginia (%)
Persons Below the Poverty Line
8.5%
11.5%
10.2%
Children (Under 18) in Poverty
12%
–
–
Seniors (65 and Over) in Poverty
7%
–
–
Non-Poverty Rate
93%
90%
90%
Virginia Beach has a significantly lower poverty rate (8.5%) compared to the metro area (11.5%) and the state (10.2%).
Children in poverty account for 12%, which is a concerning indicator for long-term social mobility and access to resources. Senior poverty sits at 7%, suggesting some older residents may struggle financially, despite a lower overall poverty rate.
The non-poverty rate (93%) in Virginia Beach is higher than both the metro area (90%) and the state (90%), reinforcing the city’s relatively strong economic standing.
Educational Attainment
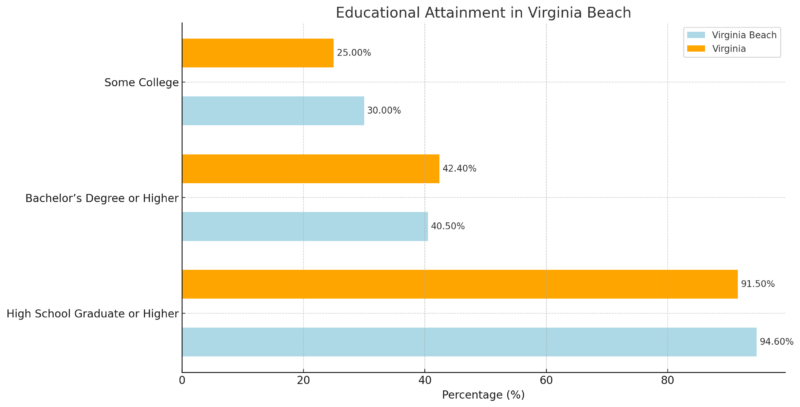
Virginia Beach has a very high rate of high school graduation (94.6%), which is slightly higher than the state average (91.5%), indicating a strong foundation of basic education in the city.
40.5% of residents hold a bachelor’s degree or higher, which is comparable to the citywide rate but slightly lower than Virginia’s (42.4%). This suggests that higher education attainment in Virginia Beach is strong but slightly below the state average.
30% of the population has some college education, which is higher than Virginia’s state average of 25%, indicating that many residents pursue post-secondary education but may not complete a degree.
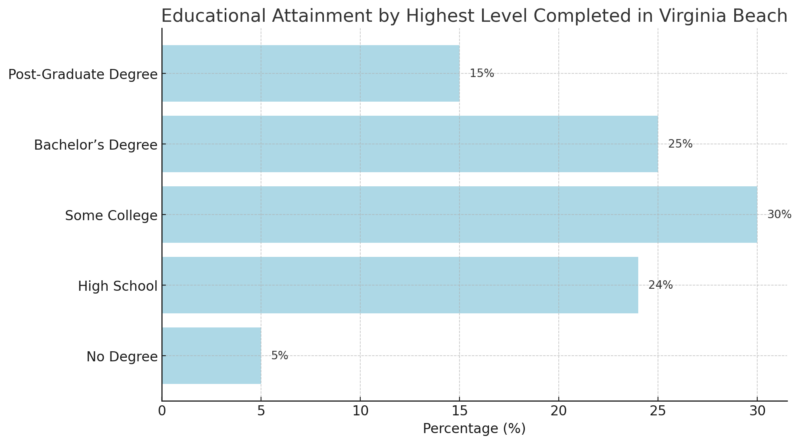
Educational Attainment by Highest Level Completed
Only 5% of residents have not completed high school, showing that educational attainment is strong at the basic level.
24% of residents hold a high school diploma as their highest level of education, meaning nearly one in four adults do not pursue further education.
30% of the population has attended college but did not obtain a degree, which is a notable statistic. This may suggest economic or personal barriers to degree completion.
25% of residents hold a bachelor’s degree, while 15% have a postgraduate degree, demonstrating that higher education is valued, though slightly behind the state average.
Housing Market Trends
Category
Virginia Beach (2024)
Year-Over-Year Change (%)
Median Sale Price
$377,000
+4.7%
Median Sale Price per Sq. Ft.
$231
+7.4%
Number of Homes Sold
451
+17.8%
Median Days on Market
31 days
No Change
Average Number of Offers per Home
2
–
Home prices in Virginia Beach have increased by 4.7% over the past year, reaching a median sale price of $377,000. This suggests a rising demand for housing in the area according to Redfin.
The median sale price per square foot has grown even faster (+7.4%), indicating that home values are appreciating at a solid pace.
The number of homes sold has increased significantly (+17.8%), from 383 homes last year to 451 this year, demonstrating an active and competitive housing market.
Homes are selling within 31 days on average, which remains unchanged from last year, showing that demand is steady but not accelerating further.
Each home receives around two offers, reinforcing that competition exists but is not as aggressive as in ultra-hot markets.
Methodology
- We sourced population and demographic data from the World Population Review, Macrotrends, and Census Reporter.
- Employment and wage statistics were collected from the U.S. Bureau of Labor Statistics (BLS).
- Housing market trends were analyzed using Redfin and real estate reports for Virginia Beach.
- Educational attainment and income data were obtained from Statistical Atlas and Point2Homes.
- We compared Virginia Beach’s economic indicators to metro and state averages for context.
- All statistics were cross-referenced with multiple sources to ensure accuracy and reliability.
References
- World Population Review – Virginia Beach Population 2025
- Macrotrends – Virginia Beach Metro Area Population
- Statistical Atlas – Age and Sex in Virginia Beach
- Point2Homes – Virginia Beach Demographics
- Census Reporter – Virginia Beach Income and Economic Data
- Redfin – Virginia Beach Housing Market Trends
- U.S. Bureau of Labor Statistics (BLS) – Virginia Beach Economic Summary
- Statistical Atlas – Race and Ethnicity in Virginia Beach