
February 2025 – Black-owned businesses in the United States have seen remarkable growth in recent years, yet they still account for a small portion of the overall business landscape.
A 2023 Pew Research Center survey found that more than one in five Black adults consider business ownership essential to their definition of financial success.
However, despite significant increases in the number of Black-owned firms and revenue, they still represent a disproportionately small share of total U.S. businesses and earnings.
Key Statistics on Black-Owned Businesses
| Category | Number/Percentage |
| Total Black-Owned Firms | 194,585 |
| Growth Since 2017 | +57% (from 124,004) |
| Total Revenue | $211.8 billion |
| Revenue Growth Since 2017 | +66% (from $127.9 billion) |
| Share of All U.S. Firms | 3% |
| Share of Gross Revenue | 1% |
| Employment in Black-Owned Firms | 1.6 million workers |
| Annual Payroll | $61.2 billion |
| % of Firms with 1-9 Employees | 71% |
| % of Firms with 10-49 Employees | 13% |
| % of Firms with 50+ Employees | 3% |
| % in Urban Areas | 90% |
| % in Rural Areas | 5% |
According to the latest Annual Business Survey (ABS) by the U.S. Census Bureau and the National Science Foundation, the number of Black majority-owned firms surged from 124,004 in 2017 to 194,585 in 2022—a 57% increase. Their gross revenue also soared by 66%, reaching $211.8 billion.
However, Black-owned firms made up just 3% of all businesses classifiable by race and ethnicity and only 1% of total business revenue despite the 41.57 million African-American population in the US. or 14% of Americans in 2022.
White-owned businesses continued to dominate the U.S. business landscape, accounting for 84% of all firms and 92% of revenue. In comparison, Asian American majority-owned businesses represented 12% of all businesses.
Sector Breakdown
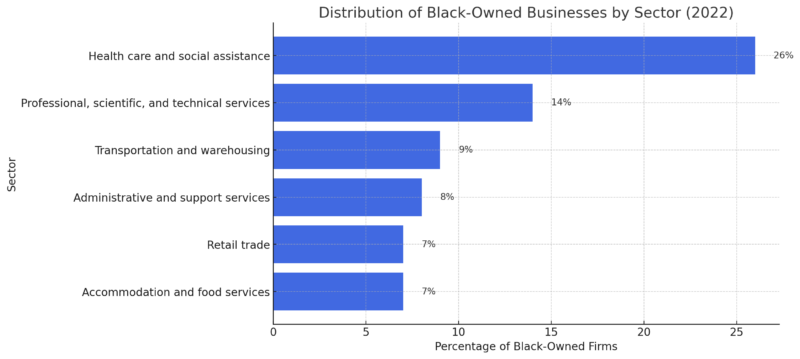
Black-owned businesses are concentrated in a few key sectors, with health care and social assistance leading the way. Nearly 50,000 Black-owned firms, or 26% of the total, operate in this sector.
Other industries with strong Black entrepreneurial representation include professional, scientific, and technical services (14%), transportation and warehousing (9%), administrative and support services (8%), retail trade (7%), and accommodation and food services (7%).
Geographic Distribution
| State/Region | Number or Percentage of Black-Owned Firms |
| Florida | 21,064 |
| Georgia | 16,973 |
| Texas | 16,849 |
| California | 16,826 |
| Washington, D.C. | 16% of all firms |
| Maryland | 10% of all firms |
The majority of Black-owned businesses—90%—are located in urban areas, with only 5% operating in rural regions.
The states with the highest number of Black-owned businesses include Florida (21,064), Georgia (16,973), Texas (16,849), and California (16,826).
In terms of percentage share, Washington, D.C. leads the nation, where 16% of businesses are Black-owned, followed by Maryland and Georgia at 10% each.
Who Are the Black Business Owners?
| Category | Percentage |
| Male Owners | 54% |
| Female Owners | 39% |
| Equal Male-Female Ownership | 7% |
| Owners Aged 35-54 | 50% |
| Owners Aged 55-64 | 26% |
| Owners Aged 65+ | 16% |
| Owners Under 35 | 7% |
| Bachelor’s Degree Holders | 27% |
| Graduate/Professional Degree Holders | 34% |
| At Least a Four-Year College Degree | 61% |
Demographic data suggests that the majority of Black business owners are men (54%), while women account for 39%. An additional 7% of firms report equal male-female ownership.
In terms of age, 50% of Black business owners fall within the 35-54 age range, while 26% are aged 55-64. Only 7% of Black business owners are under 35, while 16% are 65 and older.
Education levels among Black entrepreneurs are also relatively high.
Approximately 61% of Black business owners hold at least a four-year college degree, with 27% having a bachelor’s degree and 34% possessing a graduate or professional degree.
Motivations for Entrepreneurship
| Motivation | Percentage of Respondents |
| Desire for greater income | 90% |
| Being their own boss | 90% |
| Work-life balance | 90% |
| Opportunity to implement ideas, goods, or services | 88% |
| Flexible working hours | 87% |
The ABS survey highlights the motivations behind Black entrepreneurship.
Among respondents, 90% cited the pursuit of greater income, the desire to be their own boss, and the importance of work-life balance as major factors.
Additionally, 88% of Black entrepreneurs said that launching a business provided an avenue to implement their ideas, goods, and services, while 87% noted that flexible working hours were a key advantage of entrepreneurship.