
IQ stands for intelligence quotient, but the way we measure it has completely changed over the years. Back in the day, it was a literal math equation. If a 10-year-old could solve puzzles like an average 12-year-old, you divided their “mental age” by their real age, multiplied by 100, and got an IQ of 120.
Modern psychology threw that formula out a long time ago. Today, tests use something called “deviation IQ.” Instead of looking at your age, it simply measures how your score compares to a massive group of your exact peers.
The system is rigged so that the absolute middle of the road is always 100. This shapes the results into a classic bell curve where most of humanity lumps together. According to edubloxtutor.com, half of the population scores between 90 and 109 on standard tests like the Wechsler or Stanford-Binet, which is just labeled “average.”
Zoom out a bit, and a whopping 95% of us fall somewhere between 70 and 130.
Classification of IQ Scores and Most Common Range
IQ Range
Classification
% of Population
130 and above
Very Superior (Gifted)
~2%
120-129
Superior
~7%
110-119
High Average
~16%
90-109
Average
~50%
80-89
Low Average
~16%
70-79
Borderline Low
~7%
Below 70
Extremely Low
~2%
Because of how the scoring system is mathematically scaled, about two-thirds of all people naturally fall into the baseline 85-115 bracket (which spans the low-average, average, and high-average tiers). Outliers at the extreme ends of the spectrum remain genuinely rare.
Keep in mind that these categories are just data tools for analyzing scores. They don’t put a ceiling on what someone can actually achieve or do.
Test Your IQ with These 15 Questions
Use the test below to check your IQ score.
How the Whole IQ Test Process Works?
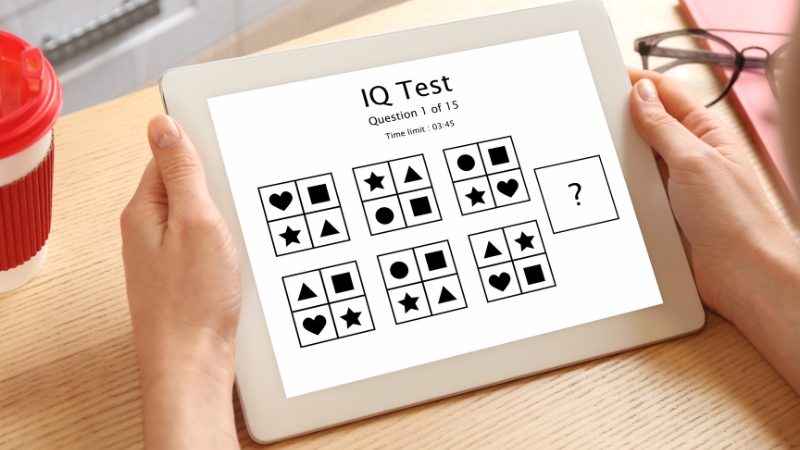
A standard IQ test from a clinic is completely different from a quick online quiz.
You sit down with a licensed psychologist who runs you through a bunch of different subtests to see how your brain handles specific tasks.
According to verywellmind.com, these parts of the test look at your vocabulary, math logic, how fast you spot patterns, your short-term memory, and how you mentally move objects around.
The most common tests out there are the WAIS for adults, the WISC for kids, and the Stanford-Binet test.
Even though they all use different questions, the companies that make them score them the exact same way. They set the average score at 100, so doctors can compare your results no matter which test you took.
The main thing to understand is that an IQ score doesn’t measure intelligence like a ruler measures height.
Scoring 130 doesn’t mean you have a bigger brain and that you are smarter than the next person. It just means you did better on the test than 98% of people your age. If someone gets a 70, it just means they only beat out 2% of the group.
At the end of the day, IQ tests aim to isolate general cognitive ability, which scientists call the g factor. This score shows how well you do with schoolwork and reading, but it completely misses a lot of other skills.
It won’t tell you anything about raw creativity, how someone handle problems, their emotional intelligence, or how good they are with people.
How Good is a 120 IQ?
View this post on Instagram
An IQ of 120 means you are smart and stand well ahead of most people. You land in the top 10% of the population, which means you scored higher than 91 out of 100 people. You are just a bit under the absolute top tier reserved for prodigies, but hitting this mark is still rare since only 1 in 10 people manage it.
You get a massive advantage when it comes to logic, reading between the lines, and quick problem solving. Heavy mental work like analyzing spreadsheets, writing code, or making sense of dense text feels much less painful, so you see people with this score all the time in competitive jobs.
Psychologists Glen Wilson and Diana Grylls ran an occupational study looking at the exact jobs where this score pops up the most. Accountants, school teachers, corporate managers, pharmacists, and specialized nurses typically hold a 120 baseline.
Doctors, lawyers, and engineers tend to score closer to 130, while research scientists average around 140. General benchmarks are not strict rules, of course, because plenty of teachers are way smarter than their numbers say, and people with a 120 IQ work in every field imaginable. A 120 simply gives you all the brainpower required to get advanced degrees and manage big responsibilities.
Raw smarts do not guarantee a successful career on their own. Drive, focus, creativity, and opportunity matter just as much in the real world. Still, workplace data proves that test scores match up with job performance, especially in complex roles where you have to think on your feet and adapt to new problems every day.
Researchers Frank Schmidt and John Hunter proved that general mental ability is the number one predictor of how well someone does at work. People with higher scores learn the technical details of a new job much faster and apply their training better when things get busy.
Let’s be realistic though, because a 120 score does not make you a mad scientist or an eccentric genius. Being likeable, having good social skills, and showing creative drive count for just as much as pure logic in daily business. Psychologists point out that extra IQ points give you diminishing returns once you pass a certain threshold. College is totally manageable with a 120, but someone with a 140 won’t automatically get better grades, make more money, or lead a happier life. Work ethic and emotional maturity dictate where you finish.
How Your IQ Changes as You Get Older?

People often wonder whether their actual intelligence changes as they grow older. Because experts design IQ tests to evaluate you against people your exact age, your official score tends to remain remarkably stable across your lifespan.
A child who registers a 130 in grade school will typically land close to 130 if tested again as a teenager or a middle-aged adult, simply because the scoring adjustments always adapt to match your generation.
Scores aren’t set in stone. Simple things like a bad night’s sleep or a hectic week can easily swing a kid’s results by 5 points or more on a retest, which happens to about 40% of them. Unless someone experiences a massive life upheaval or a medical crisis, the numbers usually stay in the same ballpark.
An average 10-year-old and an average 40-year-old both receive an identical score of 100 by definition because tests normalize data by age group.
Yet, age-based tracking does not imply that our raw mental machinery functions identically across all decades.
Psychologists divide human intelligence into two categories: fluid intelligence (the ability to solve novel logic puzzles, reason quickly, and process new data) and crystallized intelligence (accumulated knowledge, vocabulary, and practical expertise).
Fluid processing speeds peak in early adulthood and face a slow, steady decline in later years.
Meanwhile, crystallized knowledge often grows or remains stable well into retirement.
Because tests evaluate fluid logic and accumulated knowledge together, your raw point total naturally changes over time.
Test makers account for this by grading you strictly against your own age bracket. Grading an older adult by the same raw speed benchmarks as a twenty-year-old shows a clear drop, simply because processing speed slows down over the decades.
Average IQ by Age
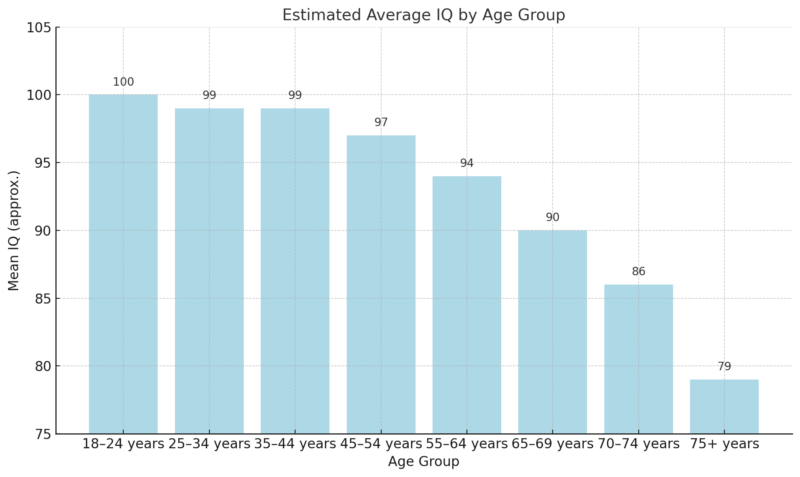
Grading everyone against a young adult standard shows exactly how processing speed slows with age.
Standard tests hide this by adjusting the curve so every group averages 100. Without that adjustment, adults in their late sixties score at a 90 baseline on timed logic puzzles compared to twenty-year-olds.
By the late seventies, a fixed scale drops the average to between 75 and 85. Slower processing causes the decline, not a loss of capability. Older adults make up for the delay by using experience and accumulated knowledge, which timed tests ignore.
Average IQ Around the World
Global IQ studies show regional gaps, but the data is messy because different places have different resources.
Region
Average IQ
Details
East Asia
105-107
Japan 106; Singapore, Taiwan, and South Korea 102-106.
Europe
99-101
Includes Finland, Germany, the UK, and the Netherlands.
Oceania
99-102
Australia 99; New Zealand 98.
North America
97-99
Canada 99; USA 97.
Latin America & Caribbean
85-90
Most countries score in the 80s, with some below 80.
Middle East & South Asia
80-85
Most countries score in this range, though India averages 76-82.
Sub‑Saharan Africa
70-75
Lowest regional averages, with highly variable test results.
- East Asia scores the highest, with averages between 105 and 107.
- Europe, North America, and Oceania stay close to the baseline at 97 to 102.
- Latin America, the Middle East, and South Asia fall lower, mostly between 80 and 90.
- Sub‑Saharan Africa averages 70 to 75, showing the impact of poor school access and weak health infrastructure.
Data from datapandas.org shows that regional score gaps match up with environment, like school quality, healthcare, nutrition, and economic stability, rather than genetics.
East Asian countries like Japan, China, and Singapore lead with averages between 105 and 107. Experts link this to structured schools, cultural focus on academics, and widespread economic security.
Western Europe, North America, and Oceania stay near 99-101, backed by well-funded schools and high living standards. The US sits slightly behind at 97.4, which analysts blame on wealth inequality and unequal school funding.
Latin America and the Caribbean average 85-90 due to uneven rural development and tight school budgets.
The Middle East and South Asia average in the low 80s, though places like Iran show that focused school investments can raise scores. Sub-Saharan Africa records averages between 70 and 75, but experts challenge these numbers because of language barriers, cultural bias, and a lack of formal schooling.
The Flynn Effect – Rising and Falling IQ Trends Across Generations
Individual scores usually stay flat during adulthood, but generational averages shot up throughout the 20th century. This shift is known as the Flynn effect, named after researcher James R. Flynn.
For decades, global scores climbed by roughly 3 points every ten years, mostly on abstract logic and non-verbal puzzles. Because tests change their scoring over time to keep the average locked at 100, an average person today would score between 115 and 120 on an old test from the 1970s.
Those gains happened because of clear real-world upgrades: universal education, better childhood nutrition, smaller families, and more visually complex environments. Lately, though, this upward trend has stalled or even flipped in several developed countries.
A longitudinal study in Norway by Bratsberg and Rogeberg tracked score drops for people born after the mid-1970s. Over in the US, a Northwestern University study (Dworak et al., 2023) looked at data from nearly 400,000 Americans and found drops between 2006 and 2018 in verbal logic, math, and reasoning, even though spatial skills actually improved.
The slip likely comes from altered school curricula, more screen time, different reading habits, and people simply being less familiar with old-school test formats. It does not mean people are getting dumber. It just shows that modern daily life no longer prioritizes the narrow skills measured by outdated IQ tests.
What is The Highest IQ Ever Recorded?

An IQ score above 130 gets labels like gifted, but scores climbing into the 160s, 180s, or 200s enter a different realm. These numbers are exceptionally rare.
On a standard scale, an IQ of 160 happens once in every 30,000 people.
Measuring intelligence at this level is a major challenge. Most standard IQ tests do not have enough high-difficulty questions to tell the difference between someone who is one-in-10,000 smart and someone who is one-in-100,000 intelligent. The tests simply hit a statistical ceiling.
Even so, history and media often highlight people with legendary scores. Many of these extreme figures took specialized, niche tests, or had their childhood scores inflated through mathematical guesswork that goes far outside normal testing frameworks.
It is best to look at these numbers with skepticism. Scores past 160 lose precision. They usually come from non-mainstream tests or outdated ratio IQ calculations, which compared mental age to physical age, rather than modern testing models.
Among the most famous people with extremely high IQ is Marilyn vos Savant, an American columnist who entered the Guinness Book of World Records in the 1980s for the highest IQ with a score of 228, according to mentalup.com.
This number was a ratio IQ from a test she took at age 10, meaning her raw score matched an average 22-year-old. Guinness eventually dropped the category entirely because extreme scores are impossible to verify accurately.
Similarly, Kim Ung-Yong of South Korea gained fame as a child prodigy. By age five, he solved complex calculus equations on live television and later recorded an early IQ score above 210, a number that still circulates today.
Highest IQ’s in History: No 2. Terence Tao – IQ 225-230.Tao specializes in the study of harmonic analysis and others pic.twitter.com/67ArHXExfn
— YBLNigeria (@yblnigeria) June 26, 2016
UCLA math professor Dr. Terence Tao is widely considered one of the sharpest minds alive. Biographers estimate his IQ between 225 and 230 based on his childhood milestones.
Tao taught himself basic math by age two, scored a 760 on the math section of the SAT at age eight, and finished his math PhD at just 20 before winning the Fields Medal. Because his childhood scores broke the standard testing scales, analysts estimated the 230 figure after the fact.
Another famous prodigy was William James Sidis, who entered Harvard at age 11 back in 1909. Sidis never took a modern standardized test, but rumors often guess his IQ was between 250 and 300. That number is almost certainly an exaggeration based on old, flawed calculations.
We have more reliable data for people who took specialized adult tests designed for high scores. Christopher Langan scored between 190 and 200, which included a perfect score on an early version of the incredibly hard Mega Test. Langan is a self-taught thinker who spent years developing his own complex philosophical framework.
Similarly, TV writer Rick Rosner hit the 190s across multiple advanced tests, while Greek psychiatrist Dr. Evangelos Katsioulis scored 198 on IQ tests.
Chess grandmaster Garry Kasparov is also rumored to have an IQ near 190, though that is likely just a guess based on his legendary chess career.
Individual
Reported IQ
Details
William James Sidis (1898-1944)
250-300 (est.)
Famous child prodigy who entered Harvard at 11. The score is a guess since he never took a modern test.
Marilyn vos Savant (b. 1946)
228
Held the Guinness record in the 1980s. The number comes from an old-style childhood ratio test.
Terence Tao (b. 1975)
~230
Fields Medal winner and math genius. Score was estimated after his childhood results broke standard scales.
Kim Ung-Yong (b. 1962)
210
Korean prodigy who spoke multiple languages as a toddler and later worked for NASA. Now a professor.
Christopher Langan (b. 1952)
~200
Self-taught thinker who scored in the highest possible percentiles on advanced adult tests.
Rick Rosner (b. 1960)
~192
TV writer who specialized in taking advanced high-ceiling IQ tests, regularly averaging in the 190s.
Evangelos Katsioulis (b. 1976)
~198
Greek psychiatrist who founded high-IQ networks after scoring near 200 on advanced assessments.
Garry Kasparov (b. 1963)
~190
Longtime World Chess Champion. The score is a common estimate based on his dominance at the board.
Psychologists point out that once your IQ passes a certain point, a higher score does not mean much in the real world. When someone is that far ahead of the curve, actual success comes down to other things: creativity, drive, opportunity, and pure luck.
History is full of people with massive IQ scores who lived quiet, ordinary lives, while others with lower scores completely changed the world.
Albert Einstein is estimated to have had an IQ around 160, even though he never took an official test. That number is lower than several people on the list, yet his breakthroughs in physics are practically unmatched.
Testing experts say that comparing an IQ of 180 to an IQ of 150 is like comparing a 7’5″ basketball player to a 6’10” player. Both are easily tall enough to play the game; who actually wins depends on skill, practice, and hustle.
IQ Tests vs. Aptitude Tests – What’s the Difference?
In the United States, testing often relies on aptitude exams like the SAT, ACT, GRE, LSAT, or the military’s ASVAB. While these results overlap quite a bit with classic IQ scores, their main goals and setups are different, as explained by aptitude-test.com.
General intelligence tests look for baseline brain capabilities. They try to measure raw logic, abstract problem-solving, and how fast you learn new things.
To find the underlying baseline, IQ tests use a mix of tasks that check memory, visual puzzles, and processing speed. The goal is to judge the mental engine itself rather than what you learned in school.
For example, an IQ test might ask you to find patterns in shapes or solve word puzzles that do not require any study or memorization.
Aptitude tests focus on specific fields instead. They check how ready or talented you are for a particular type of work or school subject.
The SAT, for instance, aims to predict how well a student will do in college by testing math, reading comprehension, and writing mechanics.
The US military uses the ASVAB to spot specific skills in electronics, science, auto mechanics, and tool use. These scores help recruiters place people into job training programs where they naturally fit best.
Because aptitude tests check how well you apply what you have learned to specific tasks, they can feel a lot like school exams. But their main job is to predict future performance.
A mechanical test might use diagrams of gears and pulleys to see if you naturally understand physical forces, while a coding test focuses on the step-by-step logic needed for software design.
Scoring is also different. IQ tests stick strictly to a scale centered at 100, making it easy to compare people across age groups and generations.
Aptitude tests usually skip the standard IQ scale completely. Instead, they give you raw point scores or peer percentiles, like showing you scored in the top 10% for mechanical logic that year.
Schools and employers look at these percentiles to see if you meet the baseline for an engineering class or a company training program.
How Common is IQ Test in US?

IQ tests are mostly used in schools and clinics. School systems use them to find candidates for gifted programs, which usually require an IQ of 130 or higher.
Clinical psychologists use them alongside other tools to spot learning differences or developmental delays. Because these tests must be given one-on-one by a licensed professional, they take a lot of time and resources.
Because of that, it is very rare for companies or college admissions offices to give formal IQ tests to applicants. Doing so costs too much and creates legal risks around hiring fairness. Instead, institutions use targeted aptitude and cognitive tests built for screening.
The SAT and ACT check undergrad reasoning skills, while the GRE, MCAT, and LSAT screen candidates for graduate, medical, and law schools. They do this by looking at specific skills like analytical writing, data interpretation, and logic. While these tests track closely with general brainpower, they also reflect years of schooling and study preparation.
In the private sector, many HR departments use short cognitive screening tools like the Wonderlic Personnel Test. Well-known for testing quarterback prospects in the NFL draft, the Wonderlic is a fast, 12-minute exam with 50 logic and math questions. It works like a mini-IQ test that measures mental speed under a tight clock.
Government jobs and military entry rely heavily on structured aptitude tests. The US military uses the Armed Forces Qualification Test (AFQT), which is a score pulled from the ASVAB, to decide basic enlistment eligibility. While military analysts map these percentiles to baseline IQ levels for internal research, the scores are used publicly to show how easily someone can be trained for specific military roles.
Looking at the country as a whole, data tracking the average IQ by state in the US shows clear regional patterns. State averages basically just mirror local differences in school budgets, healthcare access, and family income, while the typical US score sits right around 98.
Bottom Line
Strip away the hype, and an IQ score is just a measure of how well you handle a test. It has limits.
A score of 120 means a sharp mind in the top 10% of test-takers. It makes abstract problems and schoolwork smoother, but it is no anomaly. In the real world, someone with a 120 IQ works right alongside people with a baseline score of 100 every day. With training, focus, and drive, both can hit the exact same professional milestones.
On a larger scale, global data shows how deeply environment shapes these numbers. Better school funding, solid nutrition, and decent healthcare unlock a population’s potential. Without those, the numbers mean very little. As for mythical 180+ scores? They are just trivia unless they are paired with actual creative execution.
Think of a high IQ like a computer’s raw processor speed. It is a solid baseline spec, but the actual output depends entirely on the software you run and what you choose to build with it. A high score offers a head start, but lasting impact, fulfillment, and genuine contribution come down to mindset, grit, and opportunity.
A high-octane engine is useless if the car never leaves the garage. Real intelligence is not a static number you inherit. It is what you build with the mind you have.