

The average teacher salary in the United States is $76,552 for the 2025-26 school year, according to the National Education Association.
California leads with $105,726, followed by New York at $100,367. Mississippi sits at the bottom with $56,504. The gap between California and Mississippi is $49,222 a year, before considering living expenses.
New teachers earn considerably less. The average starting teacher salary is $48,112, and only 35% of surveyed districts offer beginners at least $50,000. Salaries rise with experience, qualifications and local school district contracts.
The national and state averages are NEA estimates for the 2025-26 school year. Starting salaries cover 2024-25, and BLS occupational wages refer to May 2025.
What Is the Average Teacher Salary in the U.S. in 2026?
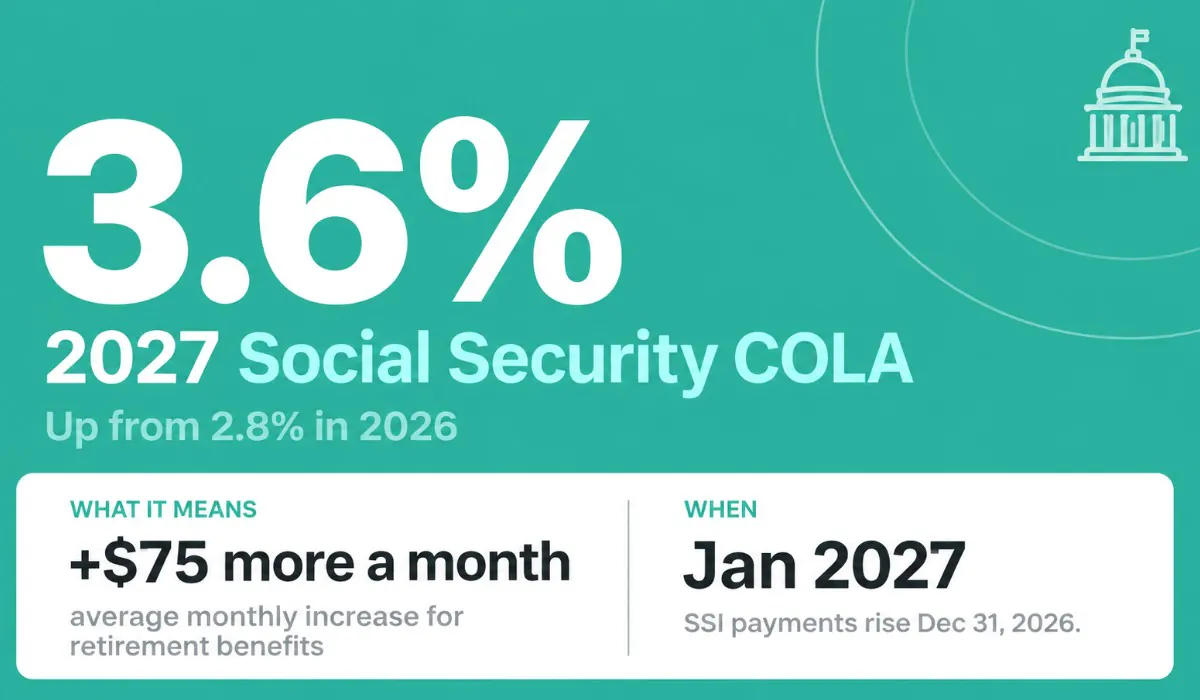
NEA estimates the national public school teacher salary at $76,552, up from $74,495 in 2024-25. That represents a 2.8% increase.
The average includes teachers at every career stage. Someone entering a classroom for the first time will generally earn less than an experienced teacher near the top of a district salary schedule.
| Teacher Pay Measure | Annual Salary |
|---|---|
| Average Public School Teacher, 2025-26 | $76,552 |
| Average Public School Teacher, 2024-25 | $74,495 |
| Average Starting Teacher, 2024-25 | $48,112 |
| Median Across Teaching Occupations, May 2025 | $63,250 |
Sources: NEA Rankings and Estimates 2026, NEA Starting Salary Benchmarks, and BLS occupational wage statistics. The NEA average covers public school classroom teachers. The BLS median covers a wider group of teaching occupations.
Average Teacher Salary by State in 2026
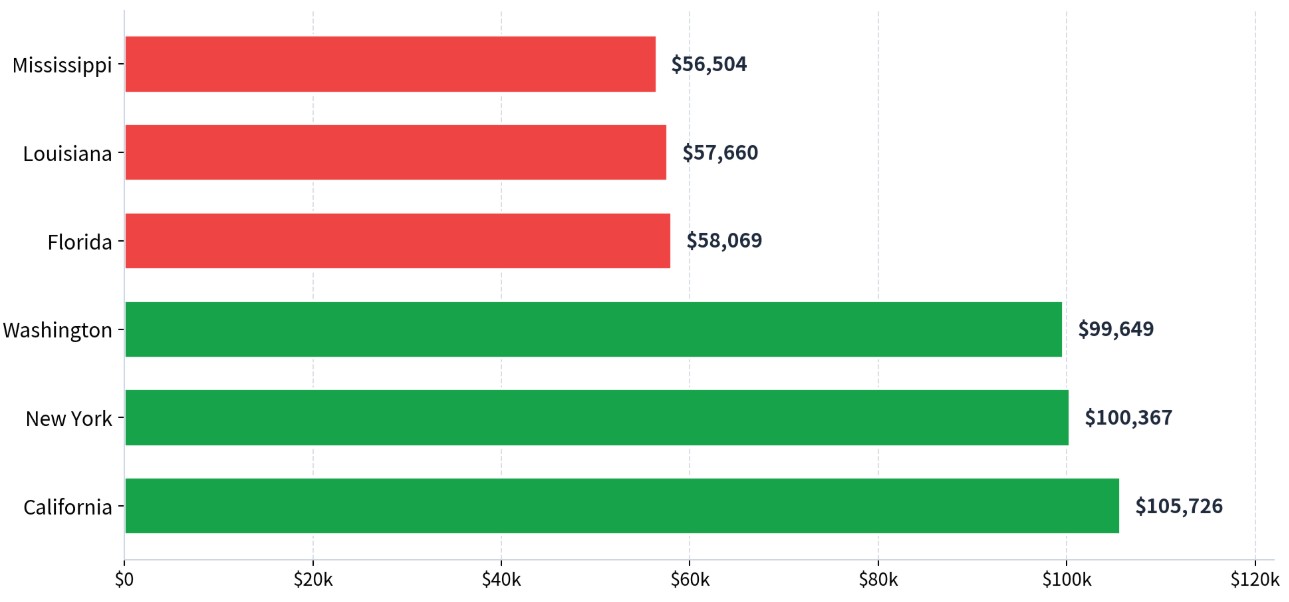
California, New York and Washington have the highest estimated teacher salaries among the states. Mississippi, Louisiana and Florida are among the lowest.
The figures below come from NEA Table E-6, covering the 2025-26 school year. Each state average combines salaries from public school districts across the state, including teachers with different experience levels.
| State | Average Teacher Salary in 2026 |
|---|---|
| Alabama | $64,466 |
| Alaska | $82,629 |
| Arizona | $66,748 |
| Arkansas | $60,120 |
| California | $105,726 |
| Colorado | $74,790 |
| Connecticut | $91,081 |
| Delaware | $78,614 |
| District of Columbia | $96,971 |
| Florida | $58,069 |
| Georgia | $72,758 |
| Hawaii | $77,812 |
| Idaho | $66,085 |
| Illinois | $80,077 |
| Indiana | $63,116 |
| Iowa | $67,041 |
| Kansas | $63,411 |
| Kentucky | $62,457 |
| Louisiana | $57,660 |
| Maine | $68,820 |
| Maryland | $90,741 |
| Massachusetts | $96,165 |
| Michigan | $73,088 |
| Minnesota | $78,007 |
| Mississippi | $56,504 |
| Missouri | $59,534 |
| Montana | $60,392 |
| Nebraska | $64,854 |
| Nevada | $75,074 |
| New Hampshire | $71,857 |
| New Jersey | $86,096 |
| New Mexico | $71,057 |
| New York | $100,367 |
| North Carolina | $59,971 |
| North Dakota | $62,325 |
| Ohio | $71,868 |
| Oklahoma | $62,055 |
| Oregon | $83,727 |
| Pennsylvania | $81,142 |
| Rhode Island | $88,120 |
| South Carolina | $67,107 |
| South Dakota | $60,451 |
| Tennessee | $62,941 |
| Texas | $68,001 |
| Utah | $75,306 |
| Vermont | $73,694 |
| Virginia | $72,014 |
| Washington | $99,649 |
| West Virginia | $58,281 |
| Wisconsin | $68,943 |
| Wyoming | $67,914 |
| United States | $76,552 |
Source: NEA Rankings of the States 2025 and Estimates of School Statistics 2026, Table E-6. State figures are estimates and may be revised as final state education department data become available.
The state average is useful for a national comparison, but the actual job offer comes from a school district. Teachers comparing California districts can use the California Department of Education salary statistics, while applicants in Texas can consult Texas school district to identify local employers.
How Much Do Starting Teachers Make?
The average starting teacher salary is $48,112, according to the NEA’s 2026 Starting Salary Benchmarks report, which examines salaries for the 2024-25 school year.
The study found that 3,973 districts, or 35% of those surveyed, offered at least $50,000. Another 10,303 districts, representing 91%, paid beginners at least $40,000.
The gap between $48,112 in starting pay and the $76,552 national teacher average is $28,440. New teachers should therefore examine the salary schedule, including how quickly pay rises after five or ten years.
State and local contracts can provide useful examples. The New York City teacher salary schedule shows how additional qualifications and years of service influence pay, with separate salary levels for different experience and education combinations.
Teacher Salary by Grade Level and Specialization
Teaching high school generally pays more than teaching preschool. The latest BLS occupational wage tables also show that salaries vary across special education and vocational teaching positions.
Median Annual Teacher Salary by Position
United States, May 2025
High School Teacher
$72,040
Special Education Teacher
$67,170
Career and Technical Education
$65,150
Middle School Teacher
$64,370
Kindergarten and Elementary
$63,820
Preschool Teacher
$38,140
Teacher Assistant
$36,780
Source: U.S. Bureau of Labor Statistics, May 2025 occupational median annual wages.
Elementary and Middle School Teacher Salaries
Kindergarten and elementary teachers earned a median of $63,820, according to the BLS elementary teacher wage data. Middle school teachers earned $64,370, with median earnings of $65,290 in local public schools compared with $60,220 in private schools, according to the middle school teaching report.
High School and Special Education Teacher Salaries
High school teachers earned a median of $72,040, based on the BLS high school salary figures. Special education teachers earned $67,170, according to the special education wage report.
Career and technical education teachers earned a median of $65,150. The BLS technical education profile includes teachers working in vocational subjects such as automotive repair, healthcare and culinary arts.
Preschool teachers earned a median of $38,140, according to the BLS preschool salary figures. Substitute teachers are commonly paid daily rates set by districts, so their annual earnings depend on how many assignments they complete.
Public School Teachers Earn More Than Private School Teachers
Public vs. Private School Teacher Salaries
Median annual wages, May 2025
Middle School Teachers
Public
$65,290
Private
$60,220
Public school median salary is $5,070 higher.
Special Education Teachers
Public
$69,470
Private
$61,290
Public school median salary is $8,180 higher.
Source: BLS Occupational Outlook Handbook. Public school figures refer to local government schools.
Public school districts usually follow established salary schedules, including annual steps and increases for additional qualifications. Union-negotiated contracts also influence salaries in many states.
Private schools set their own compensation packages. Some well-funded institutions pay competitive salaries, but smaller schools may have limited tuition revenue. The NEA’s teacher pay benchmarks also show how collective bargaining rights relate to starting and top salary levels.
How Much Do Teachers Make Per Month and Per Hour?
At the national average annual salary of $76,552, a teacher would earn $6,379.33 per month before taxes if paid in 12 equal installments.
| Pay Period | Gross Salary Equivalent |
|---|---|
| Annual | $76,552 |
| Monthly, Annual Salary ÷ 12 | $6,379.33 |
| Biweekly, Annual Salary ÷ 26 | $2,944.31 |
Hourly earnings depend on actual working hours. If a teacher works 40 hours weekly for 40 weeks, $76,552 divided by 1,600 hours equals $47.85 an hour. At 50 hours weekly across the same period, the figure falls to $38.28.
Those are examples using assumed hours, not official hourly wages. Teachers also spend time grading, planning lessons and meeting parents outside classroom hours. The BLS occupational characteristics provide additional context on teaching work and employment.
Does a Higher Teacher Salary Mean More Purchasing Power?
A California teacher earns nearly $50,000 more than a Mississippi teacher on average. Yet everyday prices are also higher in California.
The Bureau of Economic Analysis regional price indexes put California at 110.7 and Mississippi at 87.0 in 2024, with the national price level set at 100.
| State | 2026 Teacher Salary | 2024 Price Index | Price-Adjusted Equivalent |
|---|---|---|---|
| California | $105,726 | 110.7 | $95,507 |
| Mississippi | $56,504 | 87.0 | $64,947 |
Calculation: Teacher salary ÷ (regional price index ÷ 100). The estimates combine 2025-26 salaries with 2024 regional price data, the latest available in October 2026. Values are illustrative national-price equivalents, not actual take-home pay.
California still comes out ahead after adjusting for statewide prices, but its $49,222 salary advantage falls to $30,560 using this method.
Housing varies substantially within each state. Our coverage of South Florida living expenses illustrates why local housing prices deserve attention when comparing job offers. State income tax rates across America can also affect take-home pay.
Are Teacher Salaries Keeping Up With Inflation?
Teacher salaries increased by 28.2% in current dollars between 2016-17 and 2025-26. After inflation, the average teacher salary actually lost 4.6% of its purchasing power, according to NEA Table E-1 and Table E-6.
That works out to an annualized inflation-adjusted decline of around 0.5% over nine years. A salary that buys 4.6% less is a real loss, even when the dollar amount on the paycheck is higher.
Teacher Salary Growth Since 2016-17
Percentage change in U.S. public school teacher salaries through 2025-26
Salary Growth Before Inflation
+28.2%
Teacher salaries increased by 28.2% in current dollars.
Salary Growth After Inflation
-4.6%
Inflation-adjusted teacher salaries fell by 4.6%.
Teacher salaries rose in dollar terms between 2016-17 and 2025-26,
but their purchasing power declined.
Source: National Education Association, Rankings and Estimates 2026.
Salary changes compare the 2016-17 and 2025-26 school years.
Bars illustrate the magnitude of each percentage change.
Source: NEA Rankings and Estimates 2026, inflation-adjusted salary comparisons. The lines connect the verified endpoints and do not represent annual observations between them.
The NEA educator pay research provides the historical salary series, while the BLS Consumer Price Index measures changes in consumer prices over time.
Teachers also earn less than similarly educated workers in many other occupations. The Economic Policy Institute teacher wage study examines that earnings gap after considering education and other characteristics.
What to Check Before Accepting a Teaching Job?
A statewide average cannot replace a district salary schedule. Review the salary offered at your experience level, the raises available over the following years and the benefits deducted from each paycheck.
The New York City teacher pay schedules provide an example of how additional experience and education affect earnings. State education agencies also publish salary information, including the California school salary reports.
For a new teacher, the $48,112 average starting salary is a more realistic national benchmark than the $76,552 overall average. For someone considering relocation, district pay and local housing prices are the figures that deserve the closest attention.
The national teacher salary has risen, but inflation has erased part of those gains. Higher pay alone does not guarantee better living standards, particularly in districts where housing costs rise faster than wages.