
Buying a typical home in the United States now requires an annual household income of $109,796, according to new housing affordability data for June 2026.
That figure sits only slightly below the record of $110,382 reached a year earlier. The bigger problem is what American households actually earn. The estimated typical household income is $87,599, leaving a gap of $22,197 between earnings and the income needed to comfortably afford a median-priced home.
The latest Redfin housing affordability analysis offers a useful way to look at the market because it combines home prices, mortgage rates, property taxes and household income rather than focusing on sale prices alone.
Under the calculation, a home is considered affordable when monthly housing costs consume no more than 30% of household income. Redfin assumes a 15% down payment when calculating the $109,796 income requirement.
The Typical Household Is Still More Than $22,000 Short
The affordability gap has narrowed during the past two years, although buying a home remains beyond the comfortable range for a large share of households.
In June 2025, the difference between typical household earnings and the income required for a typical home was $26,125. Two years ago, it was $28,834. By June 2026, the gap had fallen to $22,197.
Household income has been rising faster than overall housing costs, which explains part of that improvement. The median home sale price still increased 2.2% from a year earlier, while estimated household income rose about 4%.
For someone earning the typical household income of $87,599, the numbers remain uncomfortable. Buying the median-priced home would require about 37.6% of income to go toward housing instead of the 30% affordability benchmark used in the study.
This fits a wider income picture we have already examined. Our earlier look at middle-class income in the US in 2026 found a national middle-class range stretching from $54,403 to $163,208. A household can therefore fall comfortably within a conventional definition of the middle class while still earning too little to buy the typical home under the current affordability calculation.
Mortgage Rates Are Still Doing Buyers Few Favors
Home prices tell only part of the story. Mortgage rates continue to push monthly payments much higher than buyers faced before the pandemic housing boom.
Freddie Mac reported that the average 30-year fixed mortgage rate reached 6.69% for the week ending August 6, up from 6.66% the previous week. The comparable rate a year earlier was 6.63%.
Earlier in 2026, borrowers briefly received more relief. As we reported in January, the 30-year rate had fallen to 6.06%, its lowest level since September 2022. Rates have since climbed back toward the upper-6% range.
New home loan applications rose 2.8% last week, ending a three-week decline.. The boost comes as 30-year mortgage rates fell to 6.09%, down from 6.87% a year ago.
Refinance applications jumped 7% from the prior week and were up 132% year-over-year, while purchase applications… pic.twitter.com/eTnVx0P6ti
— Realtor.com (@realtordotcom) February 18, 2026
That movement has an immediate effect on affordability because a higher mortgage rate raises the monthly payment even when the purchase price stays exactly the same. Buyers can therefore face a larger income requirement without the home itself becoming more expensive.
The longer-term price increase compounds the problem. Our previous analysis of US home value growth found that housing values rose sharply during the first half of the decade, leaving buyers in 2026 dealing with both elevated prices and borrowing costs well above the ultra-low rates available during the pandemic period.
Only 34% of Listings Are Affordable to the Typical Household
Another figure from the Redfin data shows how limited the market remains for median earners. Just 34.2% of US home listings were affordable to a household earning the typical income in June.
That has improved from 30.5% a year earlier, yet the current share remains far below the conditions buyers encountered before mortgage rates surged in 2022. Redfin reported that more than half of listings were affordable to the typical household during nearly every month in its records before that change.
For buyers trying to enter the market for the first time, the lower end of the housing market provides a somewhat different picture.
A separate Redfin analysis of starter homes found that a household needs $70,693 a year to afford the typical entry-level property. That requirement fell 1.5% from the previous year.
The estimated typical household income of $87,599 is about $17,000 higher than the income needed for a starter home. Redfin defines starter homes as properties between the 5th and 35th percentile of sale prices.
That distinction is important because the national $109,796 figure describes the typical home sold throughout the entire market. Buyers willing to consider lower-priced properties have substantially more room, although availability differs sharply by city.
Only Three Major Metros Pass the Affordability Test

Housing affordability changes dramatically depending on location.
Among the 46 major metropolitan areas with sufficient data in the Redfin analysis, only St. Louis, Indianapolis and Pittsburgh had typical household incomes high enough to afford the median-priced local home.
Other cities illustrate how misleading an improvement in prices can look without comparing those prices with local wages.
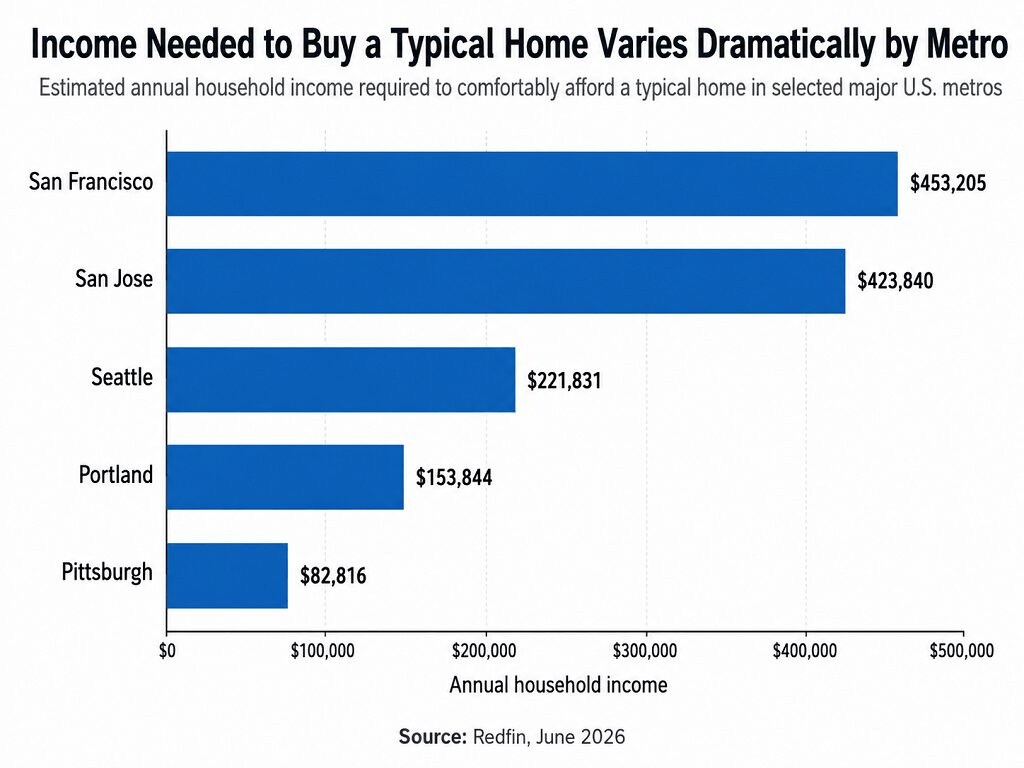
Seattle recorded the largest annual decline in required income, falling 7.4% to $221,831. San Jose followed with a 6.5% decline, yet buyers there still need approximately $423,840 a year to afford the typical home. Estimated median household income in San Jose is $176,401.
Portland recorded the third-largest improvement, with required income falling 4.5% to $153,844.
At the opposite end, San Francisco requires an estimated income of $453,205 to comfortably afford the median-priced home, the highest figure among the markets examined. Pittsburgh saw the largest percentage increase from a year earlier, with the required income rising 6.3% to $82,816.
Housing Is Becoming Slightly Easier to Afford, From a Very Expensive Starting Point
The national numbers show improvement, although the scale is modest. Required income has fallen from the record reached last year, household earnings have gained ground and a larger share of listings now falls within the 30% affordability limit.
The same figures also show why homeownership remains difficult for households earning ordinary salaries. A family making nearly $88,000 a year still comes up more than $22,000 short of the income Redfin estimates is needed to comfortably buy the typical US home.
The problem also reaches younger households before they begin shopping for a property. As we previously covered in our report on Gen Z housing affordability, only 26.9% of full-time Gen Z workers could comfortably afford a one-bedroom apartment under the same basic 30% housing-cost benchmark. High rents can make saving for a down payment harder before mortgage costs even enter the calculation.
Housing affordability has broader demographic consequences as well. Our earlier analysis of housing costs, household formation and declining birth rates examined how later home purchases are becoming part of a wider shift toward delayed marriage, family formation and homeownership.
For buyers watching the market in the second half of 2026, the national benchmark is now clear: roughly $110,000 in annual household income is needed to comfortably afford the typical home. Lower mortgage rates or weaker home-price growth could bring that number down. With the 30-year mortgage rate at 6.69% in early August, financing costs remain one of the largest obstacles standing between typical earnings and typical home prices.
References
- Redfin, The Income Needed to Afford Typical American Home Holds Steady Near Record High of $110,000
- Redfin, First-Time Buyers Catch a Break as Starter-Home Affordability Improves
- Freddie Mac, Primary Mortgage Market Survey
- Fox Business, Here Is the Income Needed to Afford the Typical American Home