
The most common blood type in the United States is O positive (O+), found in about 37 to 38 percent of the population.
That answer sounds simple, but the reason it matters goes far beyond a single percentage. O+ appears in more than one in three Americans, yet hospitals still depend on it heavily during trauma care, major surgeries, cancer treatment, childbirth emergencies and periods when fewer people donate.
The figure comes from large-scale donor data published by the Stanford Blood Center and national statistics reported by the American Red Cross, which both show O+ as the dominant blood type in the United States.
When O+ is combined with O−, the broader Type O category represents close to half of all Americans. That is why Type O donors sit at the center of blood supply planning, emergency medicine and donation campaigns.
National Blood Type Distribution: What The U.S. Pattern Shows
The best national estimates come from donor records, blood center data and population summaries. No single public U.S. database gives a live count of every blood type, so published figures usually rely on large donation datasets and long-running blood center records.
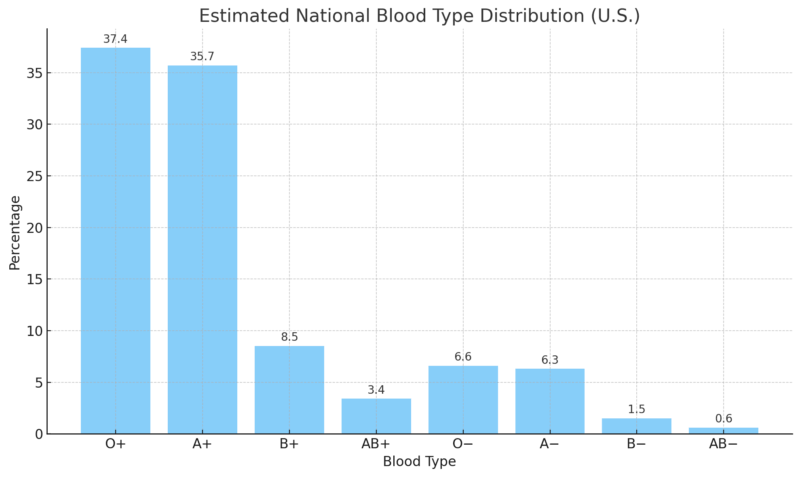
According to Stanford Blood Center data, O+ accounts for about 37.4% of the U.S. population. A+ follows closely at about 35.7%. Together, those two types make up more than seven in ten Americans.
That concentration affects hospital inventory. Blood banks cannot stock every type in equal amounts. They have to plan around what patients are likely to need, which types can be used in emergencies and which types can run down fastest when donor turnout drops.
Estimated National Blood Type Distribution In The U.S.
Blood Type
Estimated U.S. Share
Why It Matters
O+
~37.4%
Most common type and heavily used for Rh-positive patients
A+
~35.7%
Second most common type and a major part of routine hospital supply
B+
~8.5%
Less common nationally, but more common in some Asian and Black communities
O−
~6.6%
Universal donor type for emergency RBC transfusions
A−
~6.3%
Needed for A− and AB− patients and sometimes used for A+ or AB+ recipients
AB+
~3.4%
Rare positive type, but AB plasma is highly useful
B−
~1.5%
Rare type that can become difficult to source in some regions
AB−
~0.6%
Rarest major ABO/Rh type in the United States
The percentage range explains why some sources say O+ is 37%, while others round it to 38%. That difference does not change the main finding: O+ is the leading U.S. blood type by a clear margin.
O+ also appears in hospital use more than the population share alone might suggest. The reason is compatibility. For RBC transfusions, O+ can be used for many Rh-positive recipients when medical teams need blood quickly and the patient can safely receive Rh-positive units.
Why O+ Can Be Common And Still Run Short
People often assume the most common blood type should be the easiest to keep in stock. Blood supply does not work that way.
O+ is common, but it is also used in large volume. Surgery patients, trauma patients, cancer patients, people with severe anemia and patients with major bleeding may all need transfusions. When one type is used more than others, a large donor base does not automatically prevent shortages.
The American Red Cross page on Type O blood explains why Type O donors are especially important: someone in the United States needs a transfusion about every two seconds, while donated blood products have limited shelf lives. Supply has to be replaced continually.
O+ is also easier to use than many other types during time-sensitive care for Rh-positive patients. That creates a practical tension for blood banks: O+ is common enough to carry in large quantities, but demand is high enough that shelves can empty faster than expected.
Rh Factor Distribution And Why Negative Types Are Harder To Stock
The ABO system explains whether blood is Type A, B, AB or O. The Rh factor adds the positive or negative part. That second marker changes transfusion planning in important ways.
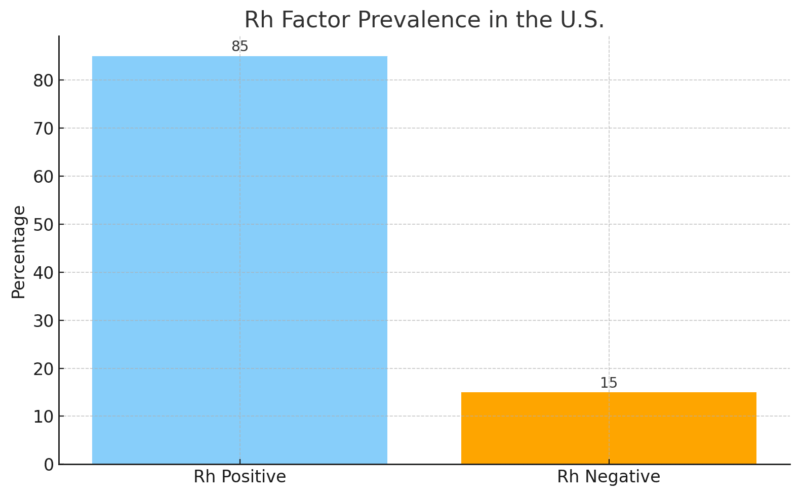
According to the Connecticut Blood Center, about 85 percent of Americans are Rh-positive, while about 15 percent are Rh-negative. That split explains why negative types are much less common in every ABO group.
Rh-negative units are harder to replace because the donor pool is smaller. O− is the best-known example, but A−, B− and AB− can also become difficult to locate, especially for patients who need repeated transfusions or more closely matched units.
Rh Factor Prevalence In The U.S.
The most important Rh-negative type in emergency care is O−. Stanford Blood Center identifies O− as the universal donor type for RBC transfusions because it lacks A, B and RhD markers that can trigger immediate incompatibility problems in many recipients.
That is why O− is so valuable in emergency rooms, trauma centers and neonatal care. Medical teams may not have time to confirm a patient blood type before transfusion begins, especially after major injury or severe bleeding.
Hospitals also try to protect O− inventory. The AABB bulletin on group O use recommends reducing over-reliance on O RhD-negative RBCs and reserving them for patients who need them most, especially when pregnancy-related Rh risk is relevant.
Blood Type Distribution By Ethnicity: Why Donor Diversity Changes Care
Blood type patterns vary by ancestry, and that has direct consequences for hospitals. Broad ethnic labels cannot predict one individual blood type. The useful point is different: inherited blood markers are distributed unevenly in donor populations, so a diverse donor pool helps hospitals find compatible blood for a diverse patient population.
According to demographic analyses by Medical News Today, O+ remains the leading blood type in major U.S. demographic groups, but the share differs sharply.
Blood Type Distribution By Ethnic Group In The U.S.
Ethnic Group
O+
A+
B+
Notes
African American
~47%
~24%
~18%
Higher B frequency than white or Hispanic groups
Hispanic / Latino
~53%
~29%
~9%
The highest prevalence of O+ in the country
Asian American
~39%
~27%
~25%
Highest B and AB frequencies in the U.S.
Caucasian (White)
~37%
~33%
~9%
Closest match to national averages
Why Ethnicity Matters For Blood Matching
Hospitals serving diverse communities have to think beyond the eight common ABO/Rh types. Patients who receive many transfusions can develop antibodies against other blood markers. Once that happens, finding compatible blood becomes harder.
- Hispanic and Latino donors are especially important for Type O supply because O+ and O− together account for a large share of that population.
- Asian American donors help support B and AB inventories, which can be harder to maintain in regions where those types are less common.
- Black donors are especially important for patients with sickle cell disease, because closer antigen matches can reduce transfusion complications.
The American Red Cross notes that certain rare blood markers are more common in specific racial or ethnic groups, including U-negative and Duffy-negative phenotypes. That is why donor diversity is a medical supply issue, not only a participation issue.
“The highest percentage of Group O was found in Hispanic (56.5 %), North American Indian (54.6 %), and black non-Hispanic (50.2 %) donors. Hispanic and black non-Hispanic donors had a much lower percentage (7.3 and 7.1 %, respectively) of Rh- compared to white non-Hispanic donors (17.3 %).” — G. Garratty, S.A. Glynn & R. McEntire, Transfusion, 2004.
That study is older, but it remains one of the most cited large U.S. donor datasets because it included more than 3 million donors from five blood centers. Newer public summaries still show the same broad pattern: O+ leads nationally, while B and AB types vary more by community.
Ranking All Blood Types From Most To Least Common
The ranking below helps explain why some blood types dominate routine inventory while others require careful planning. Small percentage differences can become important because U.S. hospitals use large numbers of units every year.
Blood Type Prevalence Ranking
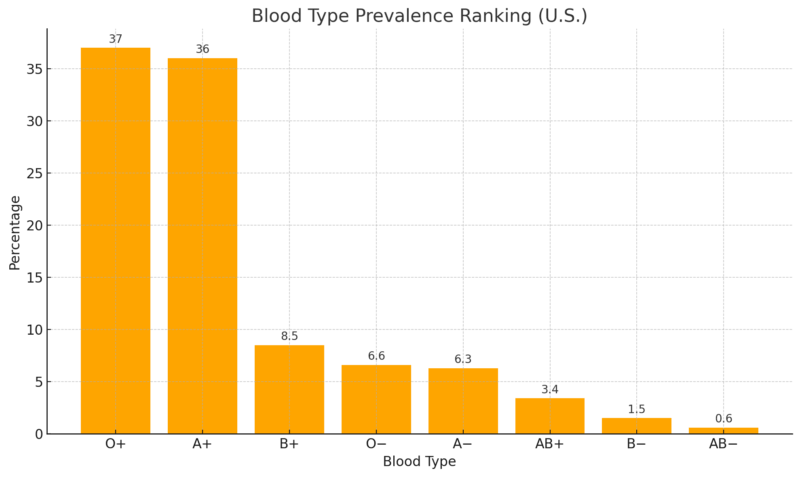
The most common U.S. blood type is O+. The rarest standard ABO/Rh type is AB−, which Stanford Blood Center estimates at about 0.6% of the population.
Rarity does not always mean low value. AB plasma is considered universal plasma because it can be given to patients of any ABO type. That is why AB donors may be especially useful for plasma donation even though AB is rare in the general population.
The ARC blood type compatibility guide makes the distinction clear: O− is the universal donor for RBC transfusions, while AB is the universal donor for plasma. Many readers mix those two ideas together, but hospitals treat them as separate products with separate compatibility rules.
O+ And O− In Hospital Protocols
O+
For RBC transfusions, O+ can be given to Rh-positive recipients with A+, B+, AB+ or O+ blood. Because about 85% of Americans are Rh-positive, O+ has a large practical role in routine transfusion care and some emergency protocols.
O+ patients can receive O+ or O− RBCs. They cannot safely receive A, B or AB RBCs because Type O blood contains anti-A and anti-B antibodies. That is why blood type matching still matters even when a type is common.
O−
O− is the emergency workhorse for RBC transfusions when the patient blood type is unknown. It can be used before full testing is complete, which can save time in trauma care.
O− supply is fragile because only a small share of Americans have it, while emergency demand is much larger than its population share. Hospitals therefore try to use O− carefully and move to type-specific blood as soon as the patient blood type is confirmed.
The same issue explains why O+ use has grown in some trauma settings. For selected adult patients, especially when pregnancy-related Rh risk is not a concern, O+ can help conserve limited O− inventory while still allowing immediate treatment.
Blood Donation Supply Challenges
Blood banks publicly report that demand for Type O blood can outpace supply even though Type O is the largest category. Supply pressure comes from three facts at the same time: blood has a limited shelf life, emergencies are unpredictable, and donor turnout rises and falls through the year.
Donation campaigns focus heavily on Type O donors because blood centers cannot plan around population share alone. They have to plan around actual use. A common type can become a shortage type when hospitals use it faster than donors replace it.
One more detail helps explain the urgency: whole blood is usually separated into components, including RBCs, platelets and plasma. Each component has its own shelf life and use case. That means one donation can help more than one patient, but it also means blood centers must manage several inventories at once.
Population Genetics And Why Blood Type Frequencies Change Slowly
ABO and Rh types are inherited, so national blood type patterns do not swing quickly from year to year. A large shift would require major demographic change over long periods.
That is why the U.S. distribution has stayed broadly stable for decades: O+ and A+ remain dominant, O− remains medically valuable but limited, and AB− remains the rarest standard ABO/Rh type.
Genetics also explains why blood type is not a lifestyle marker. Diet, exercise and general health do not change a person ABO or Rh type. Blood type is determined by inherited markers, although rare medical situations, such as stem cell transplantation, can complicate blood typing later.
“Compared with individuals with blood group O, blood groups A and B were associated with increased odds of up to 1.56 (95 % CI, 1.43-1.69) for thromboembolic events and decreased odds for hypertension (0.94 [95 % CI, 0.92-0.97]).” — H.E. Groot.
Research on blood type and disease risk should be read carefully. Blood type can be associated with some health risks in population studies, but it does not determine one person medical future. For the public, the most important everyday role of blood type remains transfusion compatibility.
The Rarest Blood Types In The United States And Worldwide
The eight common ABO/Rh labels are only the beginning of blood typing. The American Red Cross notes that there are hundreds of other known antigens that can affect matching. For most people, those markers never become part of daily life. For patients who need frequent transfusions, they can become critical.
Rare blood types matter most when a patient has developed antibodies that rule out many ordinary donor units. In those cases, hospitals may need help from specialized networks such as the American Rare Donor Program, which helps locate compatible units for patients with uncommon blood needs.
1. Rh-null (“Golden Blood”): Extremely Rare Worldwide
View this post on Instagram
Rh-null is the rarest blood type documented. Fewer than 50 people globally have been identified with this phenotype.
Rh-null blood lacks all Rh antigens. That makes it medically valuable for some patients with rare Rh needs, but it also creates a serious problem for the person who has it. Someone with Rh-null blood can generally receive only Rh-null blood.
Because of that scarcity, Rh-null units may be frozen and handled through rare donor networks when a compatible unit is needed. That is why rare donor registries matter even though most people never hear about them.
2. Bombay Blood Group (hh Phenotype)
The Bombay phenotype is caused by the absence of the H antigen, the base structure needed for A, B and O blood group expression. A person with Bombay blood can look like Type O on basic testing, but standard Type O blood is not compatible for them.
That distinction is important because people with the Bombay phenotype can usually receive blood only from another Bombay donor.
Estimated prevalence:
3. Vel-Negative Blood Type
The Vel antigen is found in more than 99 percent of the population. Vel-negative blood is rare enough that mismatches can cause serious transfusion reactions.
Because of its low frequency, specialized testing may be needed to identify Vel-negative donors. That can matter for patients who have already developed antibodies after a transfusion or pregnancy.
4. U-Negative Blood Type (Primarily In Individuals Of African Descent)
U-negative individuals lack the U antigen, part of the MNS blood group system.
This phenotype occurs in a small share of people of African descent and is rare in other populations. It can be essential for patients with sickle cell disease who develop anti-U antibodies and need a more precise match.
FAQ
What Is The Most Common Blood Type In The United States?
O positive is the most common blood type in the United States. It appears in about 37 to 38 percent of the population, depending on the source and rounding method.
Is O+ The Universal Donor Blood Type?
No. O− is the universal donor type for RBC transfusions. O+ can be given to many Rh-positive patients, but it is not the universal donor type because Rh-negative patients may need Rh-negative blood.
Why Do Hospitals Need So Much O+ Blood?
Hospitals use O+ heavily because most Americans are Rh-positive and many patients can safely receive it. Its high population share helps, but high use can still create shortage pressure.
What Is The Rarest Common Blood Type In The U.S.?
AB− is the rarest of the eight standard ABO/Rh blood types in the United States. Stanford Blood Center estimates that it accounts for about 0.6% of the population.
Why Is O− So Important If It Is Not The Most Common Type?
O− can be used in emergencies before a patient blood type is known. Because only a small share of Americans have O− blood, hospitals have to protect that supply carefully.
Can Blood Type Change Over Time?
For most people, blood type stays the same for life because it is inherited. Rare medical situations, such as stem cell transplantation, can complicate later blood typing.
How Can Someone Find Out Their Blood Type?
People may learn their blood type through blood donation, medical testing, pregnancy care, surgery records or a healthcare provider. Home tests also exist, but medical records are the safer source for clinical decisions.
Conclusion
@footdocdanaBlood types, explained simply! Which one are you? (VC: greenscreencut)♬ Así Fue (En Vivo Desde Bellas Artes) – Juan Gabriel
The most common blood type in the United States is O positive, present in roughly 37 to 38 percent of the population.
Its dominance is consistent across major public blood center summaries, including Stanford Blood Center and the American Red Cross, and its prevalence shapes nearly every part of transfusion medicine, from trauma care to inventory planning.
Ethnic variation further influences supply patterns. Hispanic and Latino donors contribute heavily to Type O supply, Asian American donors help support B and AB inventories, and Black donors can be especially important for antigen-matched blood used in sickle cell care.
The main takeaway is simple: O+ is the most common type, but common does not mean unlimited. O+ is used heavily, O− remains difficult to replace, and rare blood types depend on donor networks that most people never see until an emergency makes them necessary.