The quest to measure the inner workings of the human mind, to distill the staggering complexity of intelligence into a single number, is perhaps the most ambitious and contested project in modern psychology.
This number, the Intelligence Quotient (IQ), is not a fixed, genetic blueprint; it’s a dynamic snapshot resulting from the intricate dance between our individual brain wiring, everything we’ve ever experienced, and the formal structure of the testing room.
This report moves beyond the charts and statistics of IQ testing. It’s an in-depth look at how we measure intelligence today, focusing not just on the mechanics, but on the person taking the test.
The Archaeology of the Assessment

To understand the modern apparatus of IQ testing, one must excavate its foundations, which were laid not in the sterile clinics of the 21st century but in the crowded classrooms of early 20th-century France.
The lineage of every modern test traces back to 1905, when Alfred Binet and Théodore Simon were commissioned by the French government to create a tool to identify children who were struggling in the standard curriculum, according to Verywell Mind.
Binet’s original intent was benign and remedial. He expressly warned that his “scale” was not a measure of innate, immutable intelligence, nor was it a label to be permanently affixed to a child. He viewed intelligence as plastic, capable of improvement through “mental orthopedics.” However, when the test migrated across the Atlantic, it underwent a profound ideological transformation.
In the United States, proponents like Henry Goddard and Lewis Terman adapted the scale, creating the Stanford-Binet, and stripped it of Binet’s nuance. In their hands, the IQ score became a weapon of the eugenics movement, used to justify the segregation and sterilization of the “feeble-minded,” a category that disproportionately included immigrants, the poor, and ethnic minorities.
The Physicality of Intelligence: The “Kit”.
In an era of digital ubiquity, the measurement of IQ remains stubbornly analog. The administration of a gold-standard test like the WAIS-IV is a tactile, heavy experience. The “kit” itself is a suitcase-sized apparatus weighing nearly 15 pounds, costing upwards of $1,800.
Inside this kit lies the taxonomy of human cognition, physically manifested:
- The Stimulus Books: Spiral-bound booklets that stand upright on the table, creating a barrier and a focal point between the examiner and the subject. They contain the visual matrices, the picture completion tasks, and the visual puzzles.
- The Blocks: Perhaps the most iconic artifact of IQ testing is the set of nine plastic cubes, colored solid red, solid white, and half-red/half-white. These blocks, derived from the designs of Samuel Kohs in 1920, are cool to the touch and click satisfyingly, or frustratingly, against the table surface.
- The Scoring Forms: Despite the availability of iPads (Q-interactive), many clinicians still rely on paper record forms, shielding their frantic scribbling behind a clipboard or the stimulus book to avoid influencing the subject.
The persistence of these physical objects is not accidental. They allow for the observation of “soft signs “, the tremors in a hand while stacking blocks, the way a subject organizes their workspace, or the frustration tolerance exhibited when a puzzle piece fails to fit. These are data points that a digital screen cannot capture.
Tools for Understanding How We Think Now
While hundreds of “IQ tests” proliferate on the internet, the clinical measurement of adult intelligence is dominated by two instruments: the Wechsler Adult Intelligence Scale (WAIS-IV) and the Stanford-Binet (SB5). These tests do not merely measure “smartness”; they deconstruct cognition into specific, measurable domains based on the Cattell-Horn-Carroll (CHC) theory of cognitive abilities.
The WAIS-IV: The Global Standard
The WAIS-IV, released in 2008 (with the WAIS-5 currently rolling out in 2024), is the most widely used assessment for adults aged 16 to 90. It abandons the old “Verbal vs. Performance” dichotomy in favor of four distinct indices that contribute to the Full Scale IQ (FSIQ).
The Verbal Comprehension Index (VCI)
This index measures Crystallized Intelligence (Gc), the breadth of knowledge a person has acquired and their ability to access it. It is the domain most heavily influenced by education and culture.
- Vocabulary: The subject is asked to define words ranging from the concrete (“Bed”) to the abstract (“Palliative”). This is often the single highest correlate with overall g (general intelligence), reflecting the reality that language is the operating system of complex thought.
- Similarities: The subject must explain the abstract relationship between two concepts (e.g., “In what way are an Enemy and a Friend alike?”). This test tests verbal concept formation and the ability to move from the particular to the general.
- Information: A test of general knowledge (e.g., “Who was Catherine the Great?”).
Clinical Note: The VCI is highly resilient to aging and brain injury. A person with early-stage dementia may still score highly here, masking deficits in other areas. Conversely, for non-native speakers or those from differing cultural backgrounds, this index can be a severe underestimate of true cognitive potential according to the NCBI.
The Perceptual Reasoning Index (PRI)
This index measures Fluid Intelligence (Gf ), the ability to solve novel problems on the spot, independent of schooling.
- Block Design: The subject must replicate a test geometric pattern using the red-and-white blocks under a strict time limit. This task requires the integration of visual analysis (occipital lobe), spatial planning (parietal lobe), and motor execution (frontal lobe). It is visceral and often stressful; subjects report “seeing” the solution but failing to make their hands execute it in time.
- Matrix Reasoning: The “classic” IQ test format. The subject views an incomplete pattern and selects the missing piece from the options. This is considered the purest measure of g and is the least culturally biased subtest.
- Visual Puzzles: A mental rotation task where the subject must select three shapes that combine to form a target image, without manipulating physical objects.
The Working Memory Index (WMI)
This index measures the capacity to hold information in the mind and manipulate it. It is the “RAM” of the brain.
- Digit Span: The subject repeats strings of numbers forward, backward, and in ascending order. “Forward” tests simple retention; “Backward” and “Sequencing” test true working memory manipulation.
- Arithmetic: The subject solves mental math word problems without paper or pencil. This is not just a math test; it is a test of concentration and the ability to banish distraction.21
The Processing Speed Index (PSI)
This index measures the neurological efficiency of the brain, how quickly it can take in visual information and produce a motor output.
- Symbol Search: The subject scans a row of symbols to see if a target symbol is present, working as fast as possible for 120 seconds.
- Coding: The subject copies symbols associated with numbers using a key.
Clinical Note: Processing speed is often the first domain to degrade with age, depression, or brain injury. A low PSI score can drag down the Full Scale IQ of an otherwise brilliant individual, leading to the “spiky profile” phenomenon.
The Stanford-Binet (SB5): The Adaptive Alternative
While the WAIS dominates adult testing, the SB5 is often preferred for extremes, the profoundly gifted or the intellectually disabled, because of its “routing” system. The test adapts in real-time; if a subject answers correctly, the questions get harder immediately. If they struggle, the test drops to a lower level.
The SB5 measures five factors, Fluid Reasoning, Knowledge, Quantitative Reasoning, Visual-Spatial Processing, and Working Memory, split into Verbal and Nonverbal domains for each. This 5×2 structure allows a clinician to assess the IQ of a non-verbal autistic child or a stroke victim with aphasia, measuring their reasoning ability without the barrier of spoken language.
The Neurodivergent Divergence
Perhaps the most significant development in modern IQ measurement is the recognition that the “Full Scale IQ” (FSIQ) is often a lie for neurodivergent populations. The neurodiversity paradigm has shifted the focus from the single number to the “Spiky Profile.”
The Autistic Profile: Peaks and Valleys
In a neurotypical brain, abilities tend to correlate. If you are good at vocabulary, you are likely good at puzzles. This creates a “flat profile.”
Autistic brains, however, frequently demonstrate massive intra-individual scatter. A meta-analysis of WAIS-IV profiles in autistic adults reveals a distinct pattern:
- High Peaks: Matrix Reasoning and Block Design (Perceptual Reasoning) often soar into the Superior or Very Superior range.
- Deep Valleys: Processing Speed (Coding/Symbol Search) and Working Memory frequently plummet to Average or Borderline levels.
This “spiky” nature means that an autistic individual with an FSIQ of 100 is not “average.” They might be a genius (IQ 135) in logic who is functionally disabled (IQ 75) by slow processing speed. The single number erases their struggle and their brilliance simultaneously.
The Geography of Intellect (United States)
View this post on Instagram
When we zoom out from the individual to the collective, IQ measurement becomes a tool for sociological analysis. Researchers attempt to aggregate these scores to determine the “cognitive capital” of states and nations. This is where the science becomes most precarious and most political.
Estimating the “Smartest” States
It is crucial to state that the US government does not administer WAIS-IV tests to the general population to get to figure out what state is highest and which state is lowest in terms of intelligence.
Data on average IQ in the US states is therefore estimated, usually by using standardized test scores (SAT, ACT, NAEP) as proxies for g.
Prominent analyses, such as those by McDaniel (2006) and updated by Pesta (2022), rely on the strong correlation (approx. 0.8-0.9) between these educational tests and general intelligence.
Poverty acts as a cognitive suppressor. The “Scarcity Mindset” theory posits that the constant mental overhead of managing poverty consumes “bandwidth” in the prefrontal cortex, specifically taxing Working Memory and Fluid Reasoning. Research suggests that being in a state of financial scarcity can functionally lower a person’s effective IQ by up to 13 points, nearly a full standard deviation 42
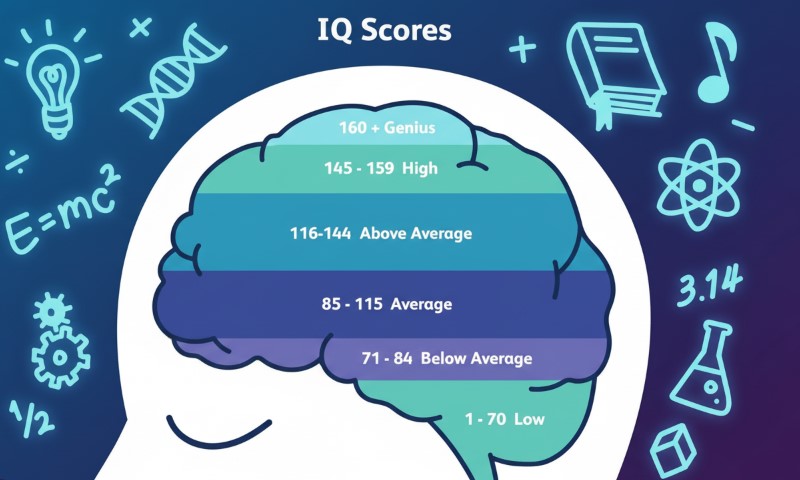
Therefore, when we see Mississippi scoring a 94.2 and Massachusetts a 104.3, we are not necessarily seeing a difference in genetic potential; we are seeing a difference in environmental load. The lead in the water, the stress in the home, and the quality of the school lunch all contribute to the “IQ score.”
Conclusion
How is IQ measured today? It is measured with red and white blocks that date back to 1920, and with fMRI scanners that map the blood flow of the firing mind. It is measured in quiet rooms where anxiety wars with logic, and on global maps that confuse poverty with stupidity.
The IQ score remains a powerful tool, perhaps the most predictive metric psychology has ever produced. It predicts academic success, job performance, and even longevity. But as our understanding of neurodiversity and sociology deepens, we are learning that the map is not the territory.
The “Spiky Profile” of the autistic genius, the depressed scores of the child in poverty contribute to the test-taker results’ ‘s remind us that intelligence is not a single, static number. It is a dynamic, living force, constrained by the environment and colored by the human experience.