Over the past five years, U.S. home values have increased by roughly 8–9% per year on average, while over the past ten years, they’ve risen about 6–7% per year on average. In other words, national home prices saw an exceptionally rapid climb in recent years, far above historical norms.
This post explores these figures in detail using national-level data from authoritative sources like Zillow, illustrating how U.S. home prices have changed year by year and what the average annual appreciation has been for the 5-year and 10-year periods.
Home values surged nearly 45–55% in total over the last 5 years (an unusually high growth rate), and almost doubled over the last 10 years, equating to those ~8% and ~7% yearly averages, respectively, according to fred.stlouisfed.org.
National Home Price Growth: 5-Year and 10-Year Overview
Since 2020, U.S. home values have risen by 45.3 percent. In other words, more than 10 years of typical home value growth has been packed into a five-year period, a new report from Zillow shows. https://t.co/gG1D4eYP41
— Inman (@Inman) February 27, 2025
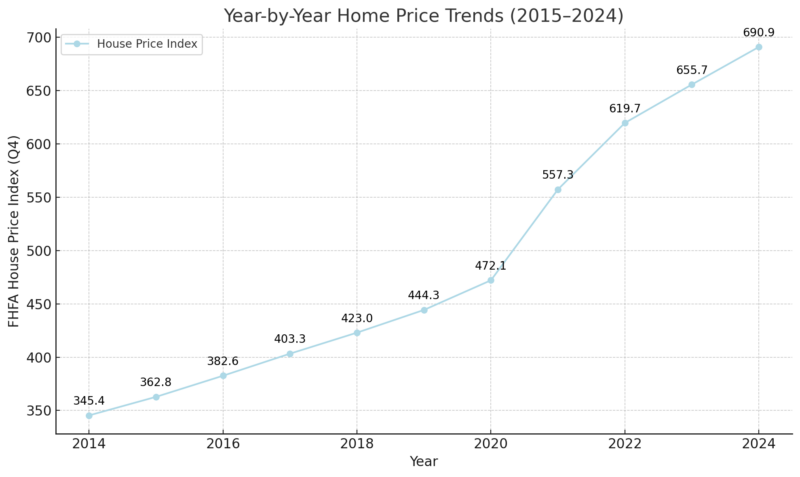
To quantify home value appreciation, we look at broad national indices that track U.S. house prices. According to the Federal Housing Finance Agency’s House Price Index (FHFA HPI), U.S. home prices rose from an index level of ~345 in late 2014 to about 691 by late 2024.
This nearly 100% cumulative increase over ten years corresponds to an average annual growth rate on the order of ~7% per year. In the more recent five-year span (2019–2024), the index jumped from ~444 to 691 – about a 55% total increase, which works out to roughly 9% per year on average.
For a different perspective, the S&P CoreLogic Case-Shiller U.S. National Home Price Index and Zillow’s Home Value Index tell a similar story.
Zillow reports that home values climbed 45.3% from February 2020 to February 2025, packing “more than a decade’s worth of typical growth into just five years”.
Historically, U.S. home values tend to rise around 4% per year in normal times, so the recent five-year period saw roughly double the typical annual appreciation rate.
Meanwhile, over a ten-year horizon, the average annual increase still exceeds the historical norm, given the strong gains of the past few years layered on top of the steady growth from the mid-2010s.
Period (Years)
Cumulative Increase in Home Values
Average Annual Increase
2014–2024 (10 years)
≈ 100% (doubling of prices)
≈ 7.2% per year
2019–2024 (5 years)
≈ 55% total rise
≈ 9.2% per year
As shown above, U.S. home values nearly doubled in the past decade, and over half of that growth occurred in just the last five years.
Next, we’ll look at the year-by-year trend to see how these averages came to be.
Year-by-Year Home Price Trends (2015–2024)
To better understand these averages, it helps to examine annual home price changes.
The following table lists the national FHFA House Price Index values at year-end and the year-over-year percentage increase for each year over the last decade:
Several important observations emerge from this data:
Steady Growth (2015–2019)
From 2014 through 2019, home prices nationally increased at a consistent ~5% per year pace. This was a period of sustained but modest appreciation, reflecting a recovering housing market in the 2010s with relatively balanced supply and demand.
The average annual increase during this half-decade was about 5.1%, very much in line with longer-term historical averages (in fact, slightly above the ~4% typical long-run rate).
Surge during 2020–2022
Home values accelerated dramatically in 2020–2022, the years marked by the COVID-19 pandemic housing boom. In 2021, national prices jumped by 18% in one year, followed by another 11% jump in 2022.
These two years of double-digit growth are the main reason the 5-year average is so high. Ultra-low mortgage rates, pandemic-driven housing demand (as many sought more space or moved to new areas), and limited housing inventory fueled this unprecedented appreciation.
According to Zillow’s analysis, the surge from 2020 to 2022 compressed what would normally be a decade’s worth of price growth into just a couple of years.
Recent Cooldown (2023–2024)
View this post on Instagram
By 2023, the pace of appreciation normalized significantly. As mortgage rates rose sharply and housing affordability worsened, price growth decelerated to about 5–6% in 2023 and an estimated 5.4% in 2024.
These rates are much closer to historical norms. There was a brief period in late 2022 to early 2023 when some local markets saw flat or slightly declining prices, but on a national basis, the market held up with a modest climb.
The return to mid-single-digit annual growth in 2023–2024 helped bring the 5-year average down a bit (from what would have been even higher if the 2021–2022 boom had continued unabated).
Even so, the five-year period (2019–2024) still averages out to roughly 8–9% per year, well above the ten-year average, because of those two explosive growth years in the early 2020s.
In summary, the 10-year average (≈6–7%/yr) reflects both the steady mid-2010s and the volatile early 2020s, while the 5-year average (≈8–9%/yr) is dominated by the recent surge. It’s important to note that these are nominal home price increases (not adjusted for inflation).
Even after accounting for general inflation, real home price growth was very robust in the past five years.
State-by-State Home Value Growth: 5-Year vs. 10-Year Comparison
Across the U.S., home prices have surged in recent years, but the extent of that growth varies significantly by state. Below is a comparison of key states, showing both cumulative growth and average annual appreciation over the past 5 and 10 years.
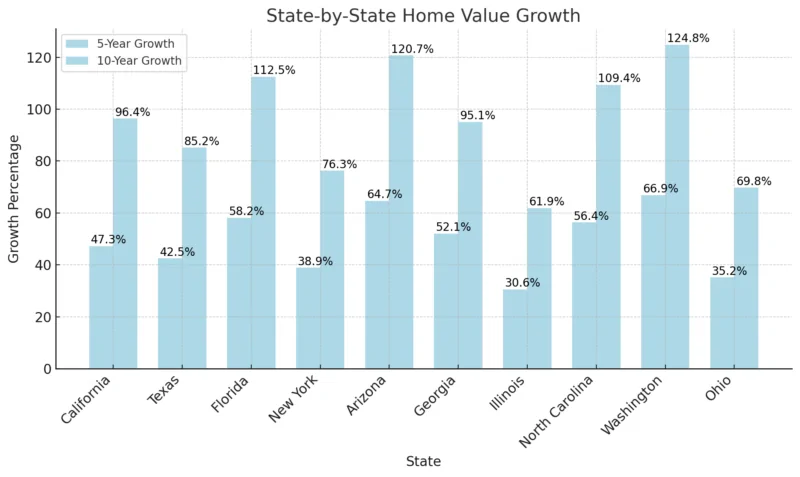
Western and Sun Belt states—like Arizona, Washington, and Florida—have seen the most explosive growth, with over 60% home price increases in just five years, and more than 100% appreciation over the last decade, according to FHFA.
California saw strong growth overall, particularly in the earlier part of the decade, but has since slowed due to affordability constraints.
Midwestern states like Ohio and Illinois had more modest increases, though they still outpaced inflation and represent more stable long-term markets.
Southern states such as Georgia and North Carolina saw high growth driven by population inflows and strong housing demand.
Construction Material Costs and Their Impact on Home Values
Beyond regional demand, rising construction costs have also been a major driver of home value increases over the past decade.
Prices for materials like lumber, concrete, and crushed stone have climbed steadily since 2019, pushed higher by fuel costs, trucking shortages, and large-scale infrastructure spending.
These added expenses often pass through to homeowners as part of overall project costs, gradually lifting home prices nationwide.
According to Christopher DeFeo, owner of DeFeo Materials, the connection is straightforward “When the cost of base materials like crushed stone or sand rises, it affects everything built on top of them, from foundations and driveways to retaining walls and roadbeds. Those higher input costs eventually make their way into the housing market itself.”
As supply chains remain tight and demand for construction materials stays strong, these rising costs will likely continue shaping home affordability in the years ahead.”
Data Sources and Reliability
The figures above are drawn from well-regarded national data sets:
By focusing on national-level data, we’ve smoothed out regional variations. Some metro areas saw far higher appreciation (e.g., many Sun Belt cities exceeded 50–60% growth in just the last 5 years), while a few areas lagged (some even flatlined).
But on aggregate, U.S. home values today are about 1.5 times higher than five years ago, and roughly double what they were ten years ago. These averages give a big-picture sense of the housing market’s trajectory.
Conclusion

In the last decade, U.S. housing has proven to be a tremendous source of home equity gains for owners: national home prices rose around 6–7% per year on average from 2014 to 2024, culminating in a total increase of about 100% over ten years.
Even more striking, about half of that gain occurred in just the most recent five-year span – a period during which home values jumped roughly 8–9% per year on average (far above normal), as the market experienced an extraordinary boom. Going forward, analysts expect growth to moderate.
With higher interest rates and affordability challenges in 2024–2025, forecasts generally call for much lower annual price increases (on the order of a few percent or even flat prices) in the near term.
Nevertheless, the 5-year and 10-year average appreciation rates documented here highlight how strongly the housing market has performed in recent times at the national level.
Such insights are valuable for homeowners and investors planning for the future, as they set realistic expectations, understanding that the recent supercharged gains are atypical, and long-run growth tends to revert closer to mid-single digits per year.
For further research, visiting services like Information.com can be of big help. That can help buyers check tax history, assessed values, current estimated property value, and recent sales history, including past sale prices.